
Shortlisted for the 2018 Kantar Information is Beautiful Awards:
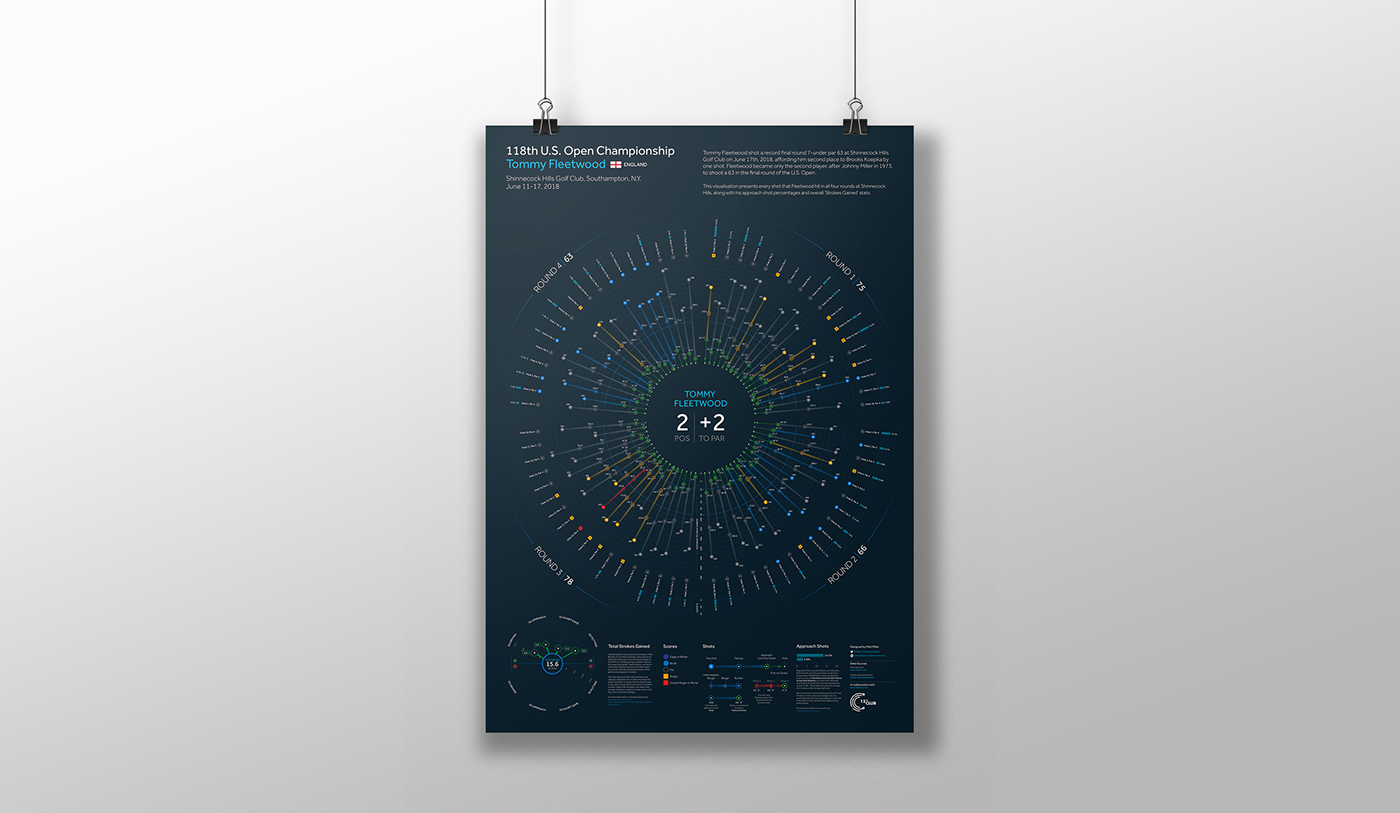
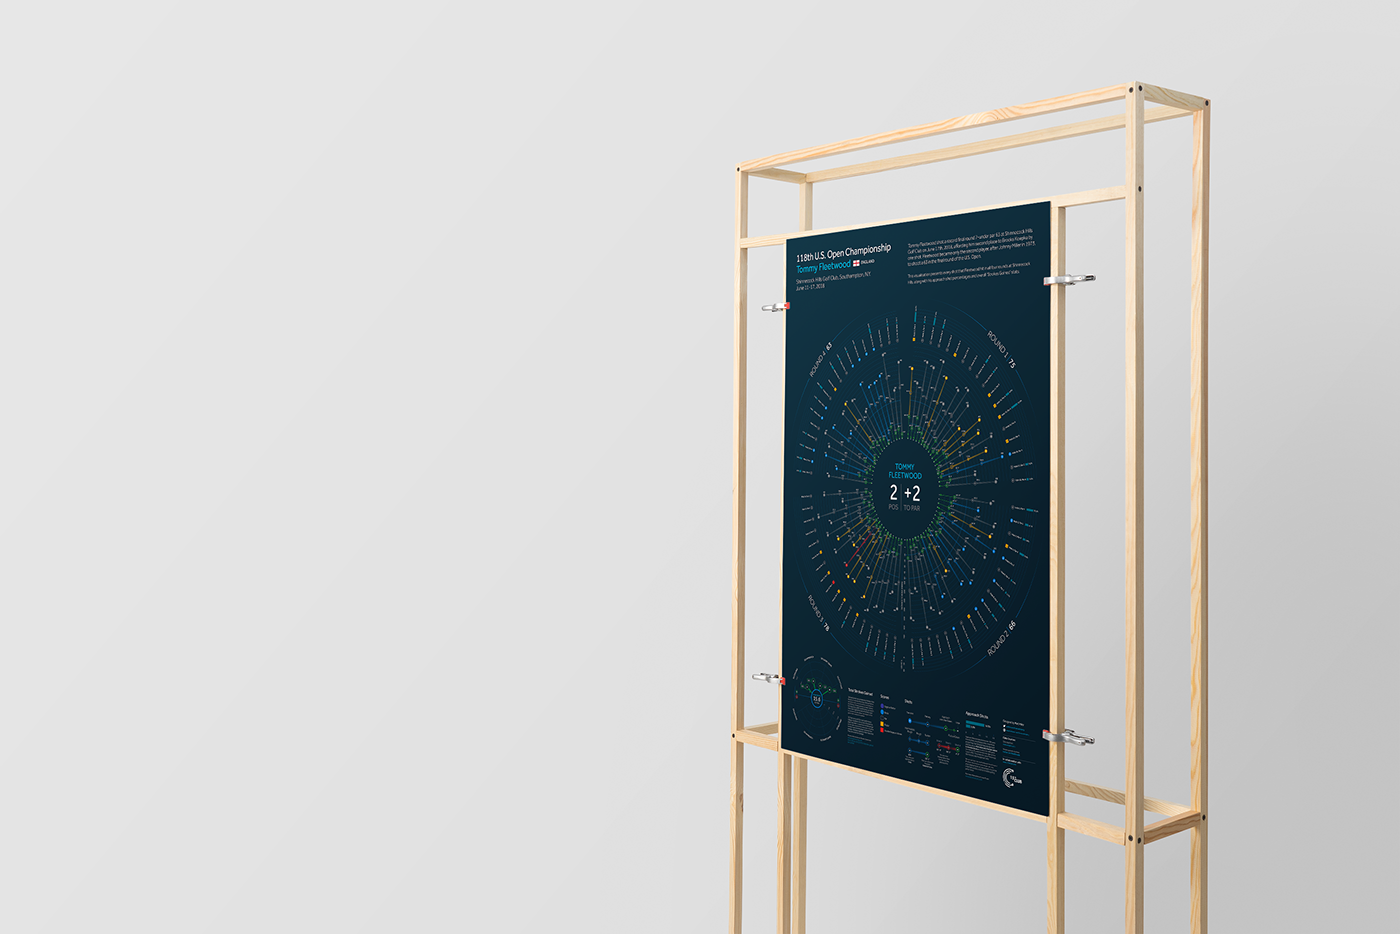
During this year’s U.S. Open at Shinnecock Hills Golf Club, the English golfer Tommy Fleetwood shot a record-equalling final round of 63 (7 under par). Although Fleetwood missed out on the Championship by one shot to Brooks Koepka, he became only the second player, after Johnny Miller in 1973, to shoot a 63 in the final round of a U.S. Open.
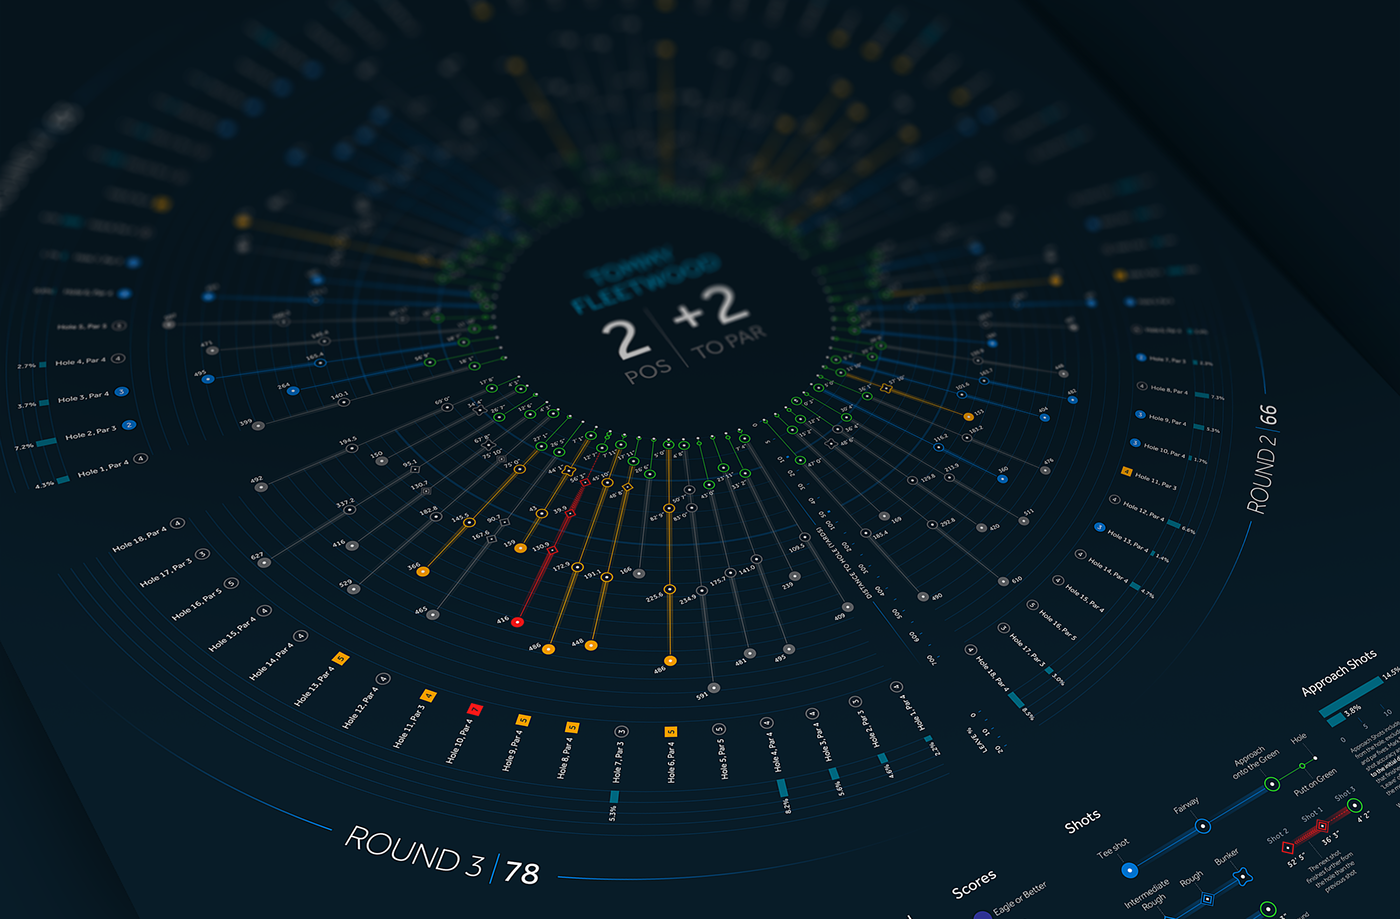
This poster visualises every shot Tommy Fleetwood hit during all four rounds of the U.S. Open. It also displays his ‘Leave’ percentages which represent how accurate his approach shots were into greens played in regulation, along with his overall ‘Strokes Gained’ stats for the Championship.
The idea was to create a ‘performance fingerprint’ for an outstanding golfer, establishing a clear visual language that represents four rounds of golf during a Major Championship. As a designer I’m interested in the value that design can bring to analytics. This visualisation only scratches the surface of what data scientists and designers can do to help elite athletes explore data-driven insights and continuously improve performance.
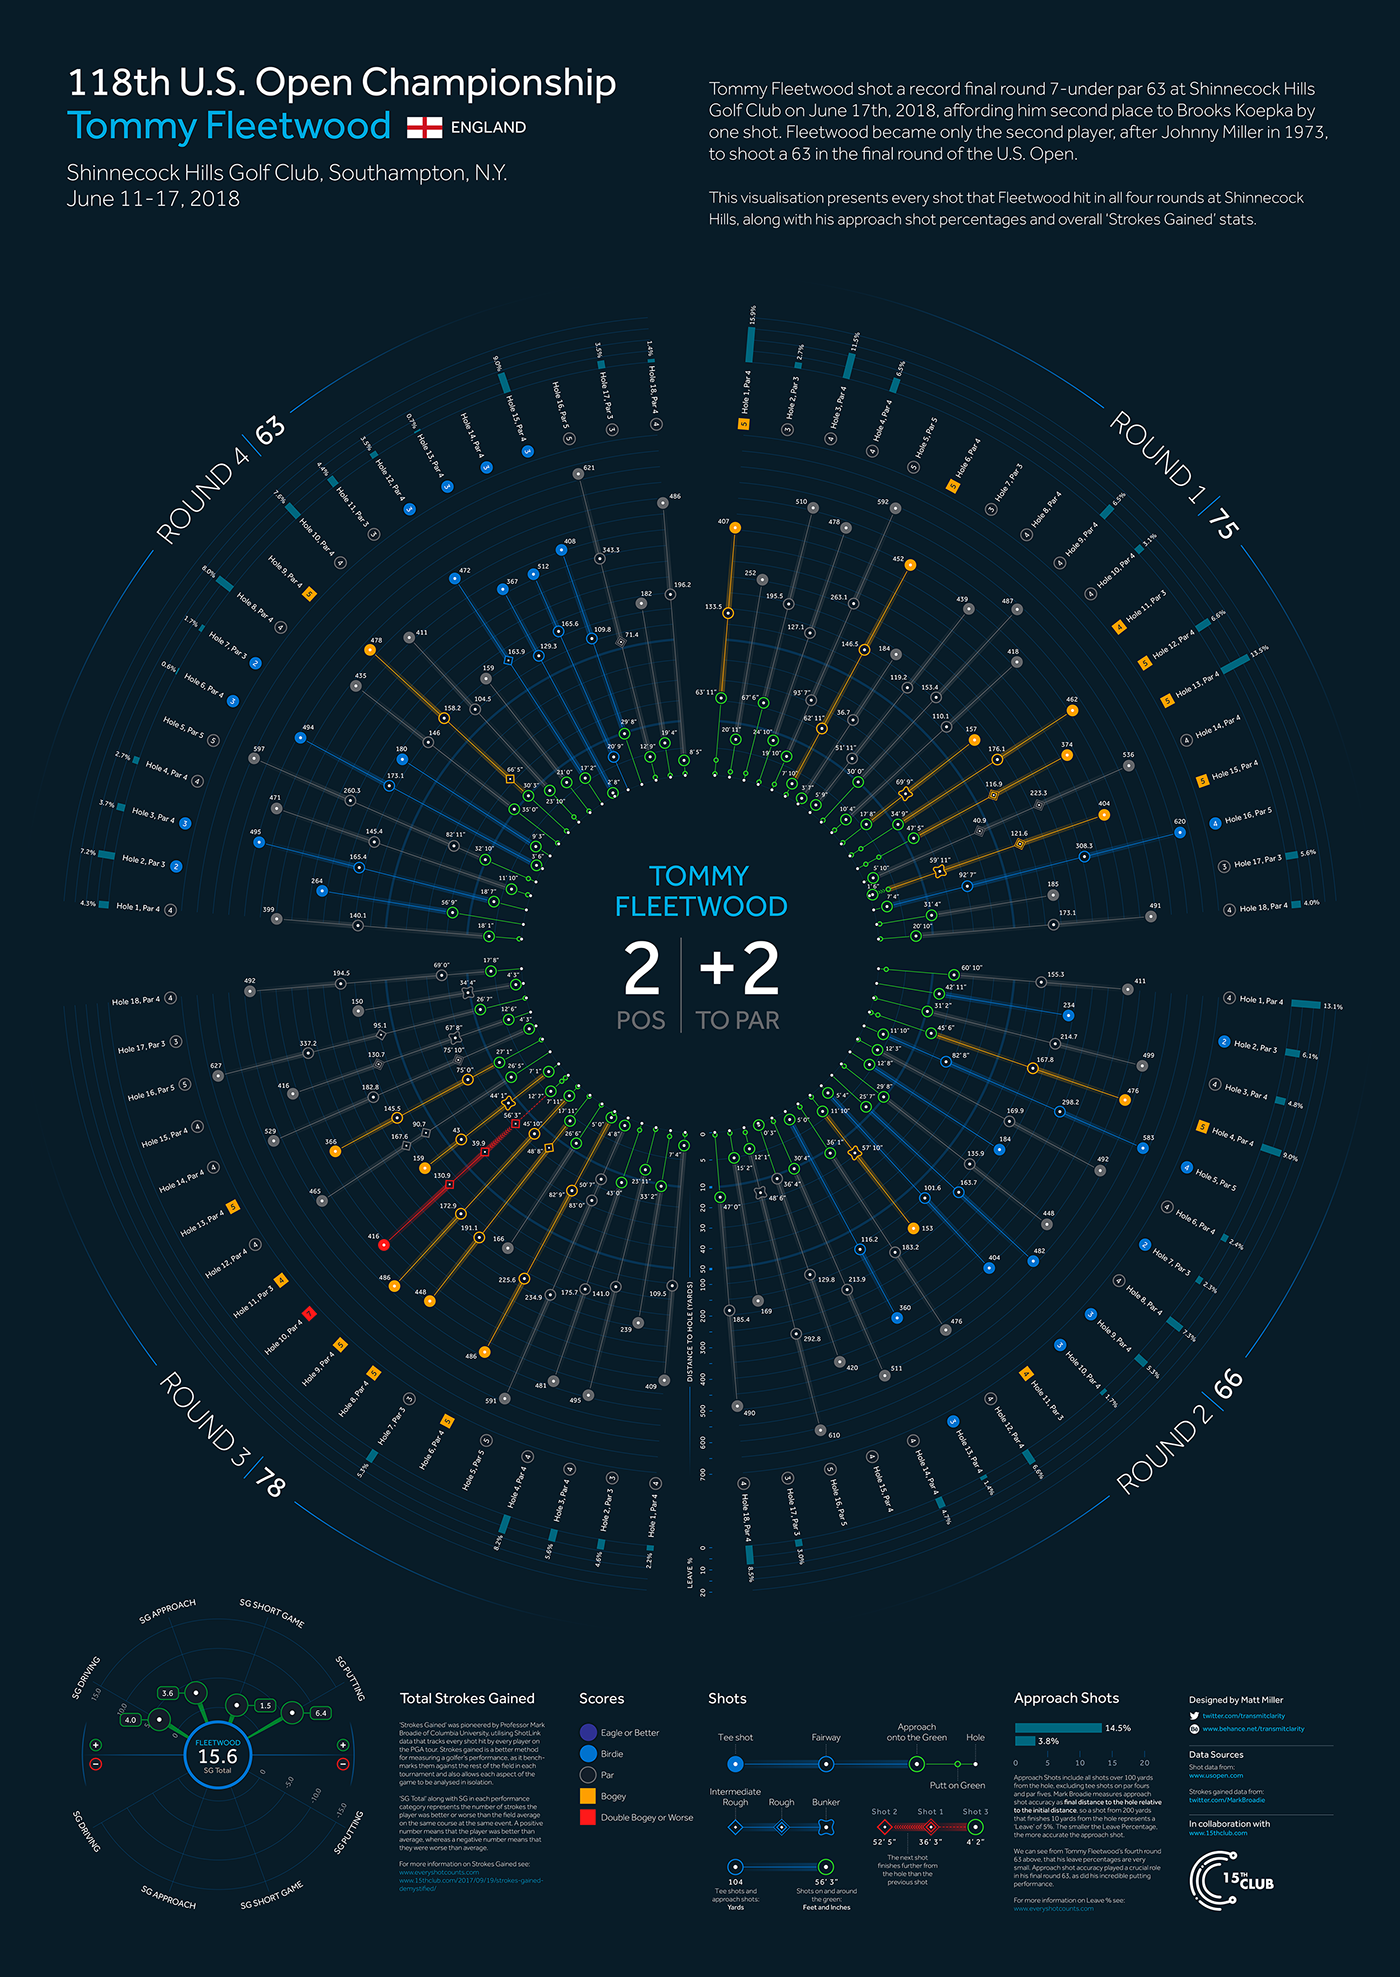


This has been a purely personal project, and it’s taken a few weekends of manual data-entry, playing around with data in Tableau and then coming up with the final visualisation in Adobe Illustrator. The shot data was sourced from www.usopen.com as well as the Sky Sports Golf TV coverage, then validated by the amazing team at The 15th Club: www.15thclub.com. The Strokes Gained stats were published by Mark Broadie on Twitter. For more information on Strokes Gained then please read Mark Broadie’s brilliant book ‘Every Shot Counts’: www.everyshotcounts.com.
Matt Miller
July 2018

