Background: Every year Akamai has a great role to play in the major events happening across geographies. Some of the events could be Black Friday, Super Bowl, March Madness, Olympics etc, To provide a seamless experience of the website to millions of users a lot of planning and execution goes in. The key is to understand the realtime performance of the sites.
Objective: Design a dashboard to view realtime traffic, traffic trends, devices across various time zones and accounts. The user should be able to see the data visualizations for one or more accounts at a time in order to compare with other reports.
Role: UX research, IA, Visual design, Prototype
A good understanding of user needs and business goals is a key to the success of any project. This was carried out as a one-time project initially. But the users found it very insightful, and post usability testing few features were added and this application is used frequently for every event.
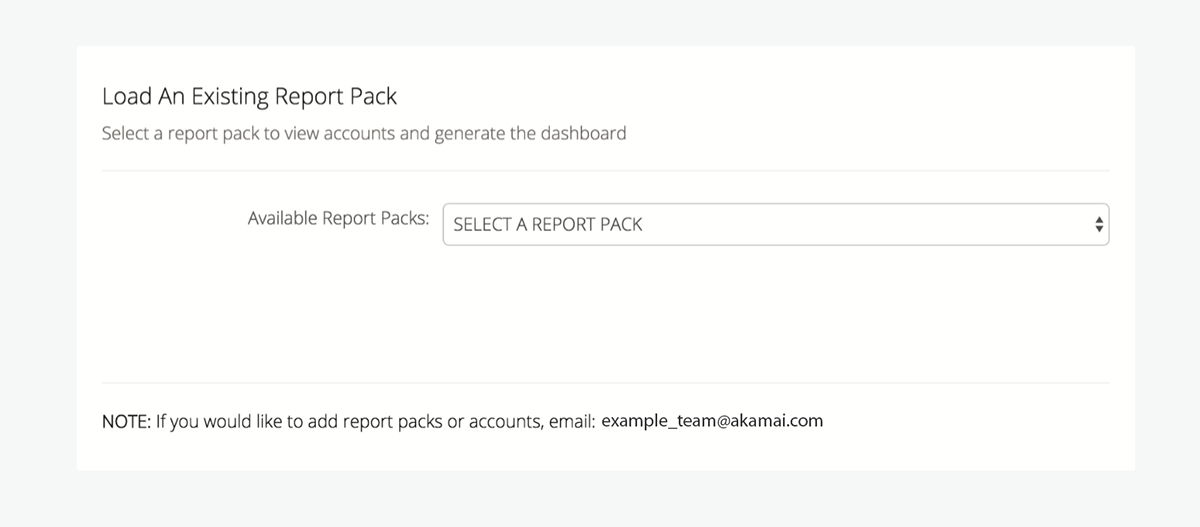
Selecting a report pack
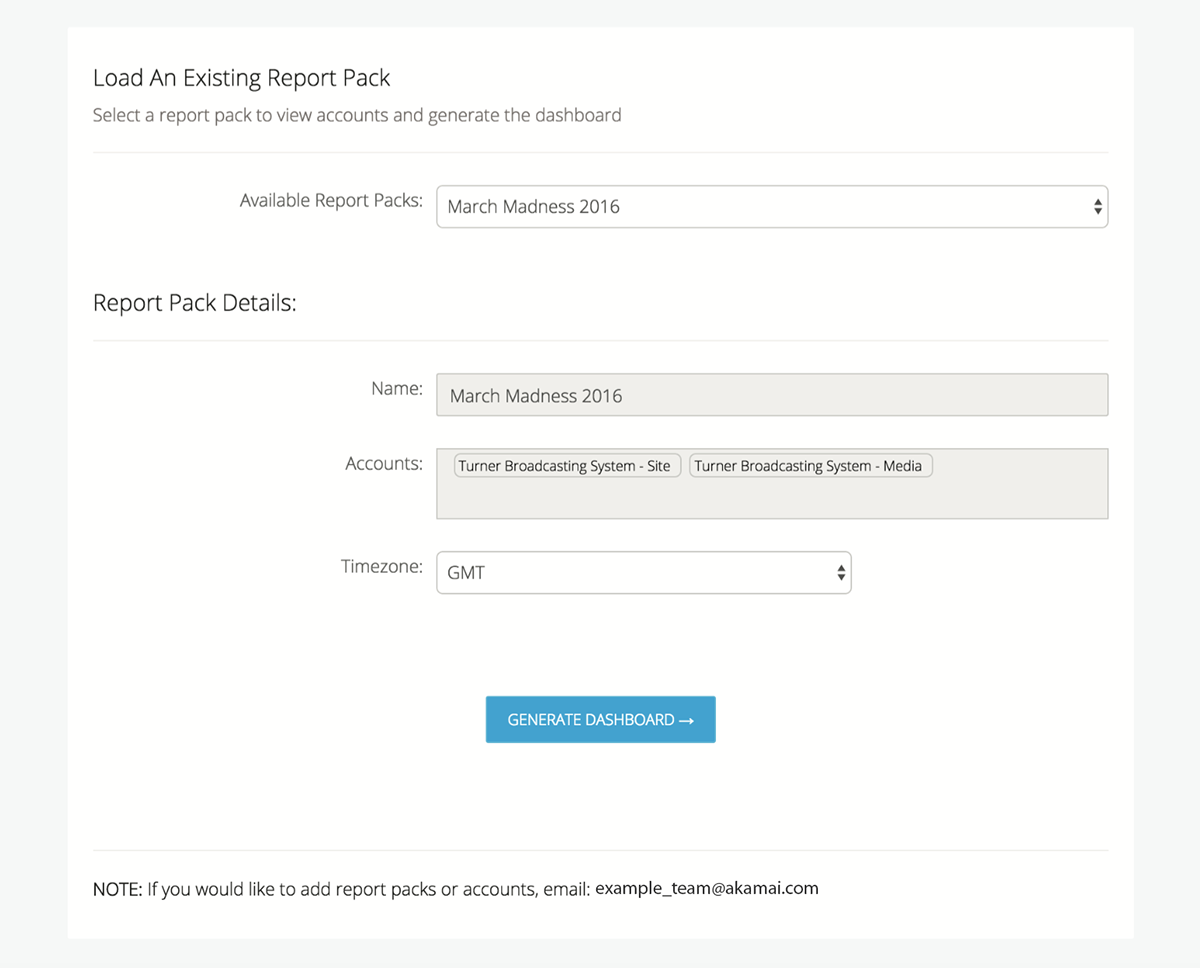
Creating custom report pack
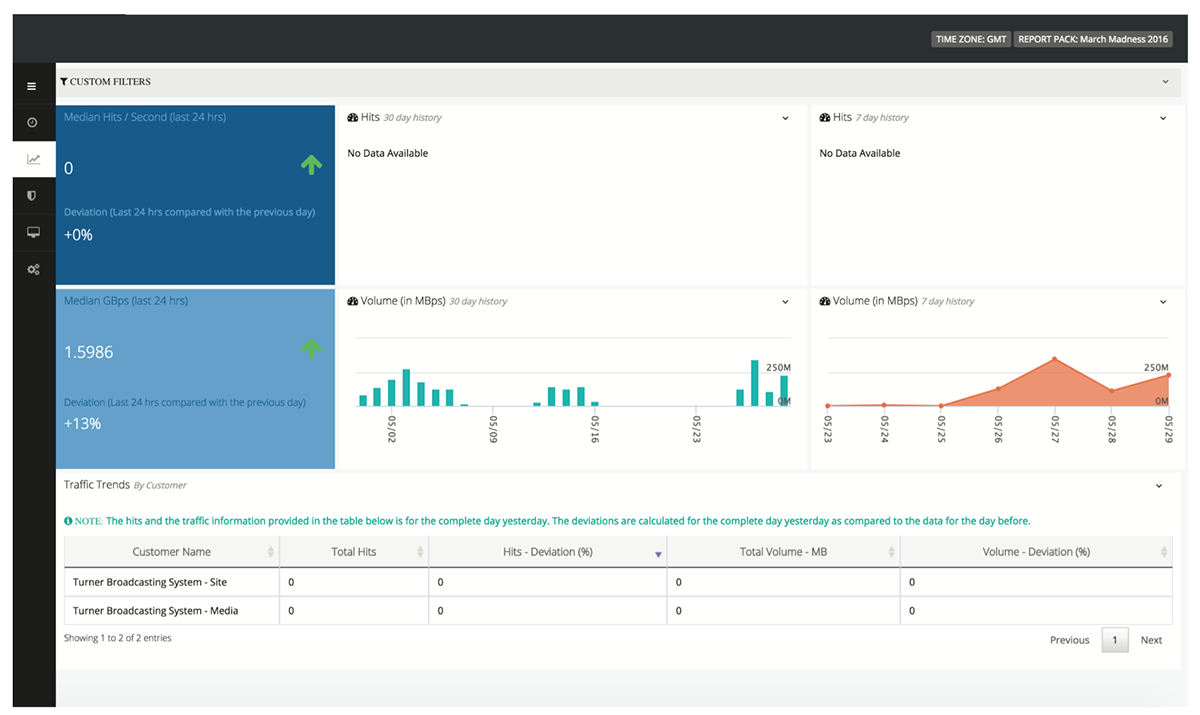
Traffic trends
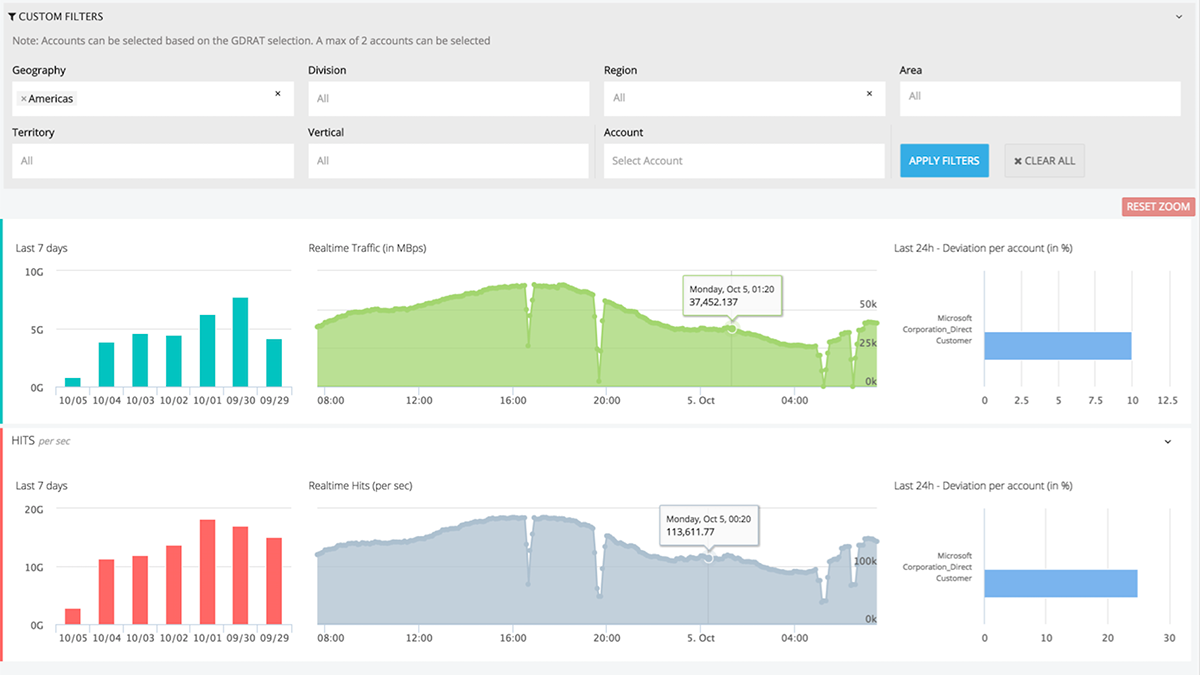
Realtime traffic trends