Visualizing Exponential Scale
A breakdown of the Youtube popularity of Girl Talk samples
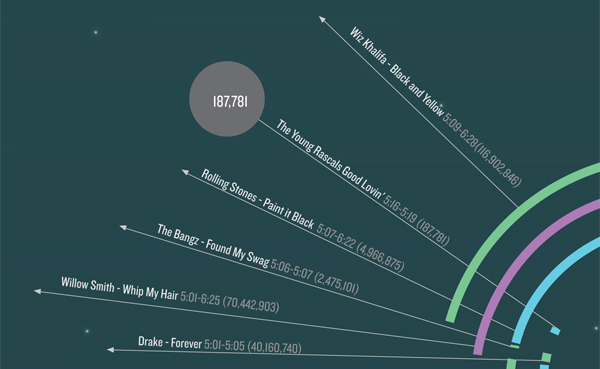
In trying to compare the samples used in Girl Talk's mashup "Triple Double" I found it most intriguing to compare the Youtube popularity of the individual tracks. The most surprising fact, however, was that the range of numbers was on a scale between 2,000, and over 100 million. How do you visually compare numbers like that in a meaningful way? This is my solution. Enjoy!

The samples were broken up into three brackets for scale. As you read down the graph, the scale shifts, showing the previous layer in comparison with the current layer, allowing for dramatic number comparison over the length of the chart. Everything is to scale, so you can see that in the final panel, the first numbers are barely visible.