Google’s HEART Framework helps measure the quality of user experience.
You can apply HEART to a specific feature or a whole Product
Happiness:
Measures of user attitudes, often collected via survey.
Measures of user attitudes, often collected via survey.
For Example :
1. Satisfaction
2. Perceived ease of use
3. Net-promoter score
The Net Promoter Score® (NPS) and its expanded version the Net Promoter System are metrics proven to measure customer loyalty. The Net Promoter Score gauges how loyal your customers are, by conducting short 2-minute surveys.
How to calculate your Net Promoter Score is based on a single question (although pros ask more than one question, we will come to that later).
“On a scale of 0-10, how likely is it that you would recommend [company name] to your friends, family or business associates?”
Customers that give you a 6 or below are Detractors, a score of 7 or 8 are called Passives, and a 9 or 10 are Promoters.
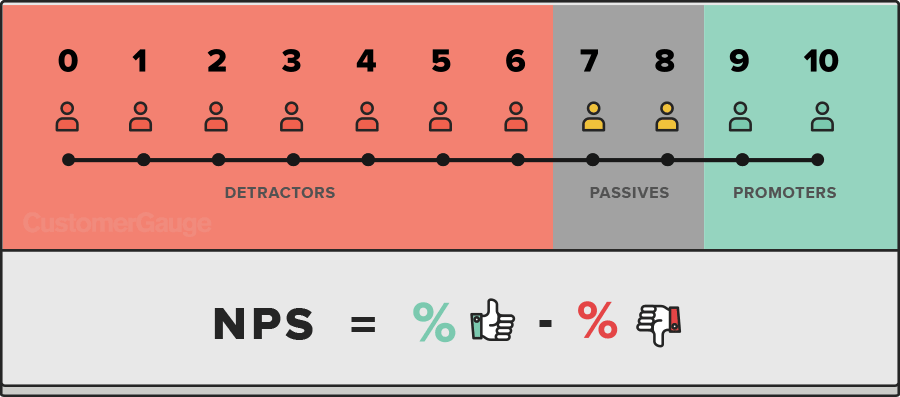
To calculate your Net Promoter Score, detract the percentage of Detractors from the percentage of Promoters. It is that simple. So, if 50% of respondents were Promoters and 10% were Detractors, your Net Promoter is a score of 40.
The importance of the Net Promoter Score is that it gives you insights into your customer loyalty spectrum. As you move up the scoring scale, from 0 to 10, customers defect at lower rates, will spend more and will move from negative word of mouth to positive.
How you ask customers what affects their score should be different for promoters than detractors and passives. Take a look at the two survey examples below of a travel company, to see how you can discover with just a single question what is most impacting the customer experience.
Source from : https://customergauge.com/blog/how-to-calculate-the-net-promoter-score/
https://storage.googleapis.com/pub-tools-public-publication-data/pdf/36299.pdf
https://medium.com/uxinthe6ix/how-we-used-the-heart-framework-to-set-the-right-ux-goals-4454df39db94
Source from : https://customergauge.com/blog/how-to-calculate-the-net-promoter-score/
https://storage.googleapis.com/pub-tools-public-publication-data/pdf/36299.pdf
https://medium.com/uxinthe6ix/how-we-used-the-heart-framework-to-set-the-right-ux-goals-4454df39db94

---------------------------------------------------------------------------------------------------------------
Engagement:
Level of user involvement
For Example:
1. Number of visits per user per week
2. Number of photos uploaded per user per day
3. Number of shares
Adoption:
Gaining new users of a product or feature.
For Example:
Upgrades to the latest version
New subscriptions created
Purchases made by new users
Retention:
The rate at which existing users are returning.
For Example
Number of active users remaining present over time
Renewal rate or failure to retain (churn)
Repeat purchases
Task Success:
Efficiency, effectiveness, and error rate.
For Example
Search result success
Time to upload a photo
Profile creation complete
You don’t necessarily need to create metrics in all of these categories — you should choose the ones that are most important for your particular project (see the Goals-Signals-Metrics process in the next section). The HEART framework can help you decide whether to include or exclude a particular category. For example, engagement may not be meaningful in an enterprise context where users are expected to use the product every day as part of their work. In this case a team may choose to focus more on happiness or task success. But it may still be meaningful to consider engagement with specific features of the product, as an indicator of their utility.
Choose one or two categories in the HEART framework that are the focus of your product or project.
But how do you figure out which metrics to implement and track?
It starts with goals.
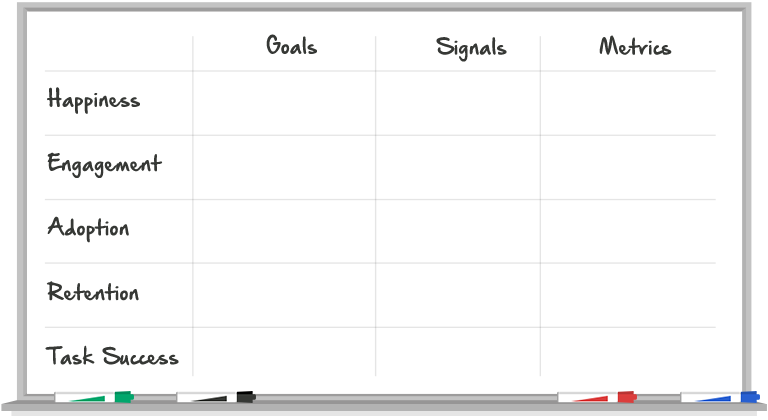
Goals - The Goals Signals Metrics process facilitates the identification of
meaningful metrics you'll actually use. Identifying clear goals will help choose the right metrics to help you measure progress. You may not realize that different members of your team have different ideas about the goals of your project. This process provides an opportunity to build consensus about where you're headed.
meaningful metrics you'll actually use. Identifying clear goals will help choose the right metrics to help you measure progress. You may not realize that different members of your team have different ideas about the goals of your project. This process provides an opportunity to build consensus about where you're headed.
Signals - Map your goals to lower-level signals.
There are usually a large number of potentially useful signals for a particular goal. Once you have generated some promising candidates, you may need to pause and do some research or analysis to choose.
If you're already collecting potentially useful signals, you can analyze the data you have and try to understand which signals seem to be the best predictors of the associated goal.
Metrics - Refine those signals into metrics you'll track over time or use in A/B testing. The specifics depend a lot on your particular infrastructure. But, as in the previous step, there may be many possible metrics you could create from a given signal.
You'll need to do some analysis of the data you've already collected to decide what's most appropriate.


