
City and County of Denver - State of the City Infographics
The city's annual State of the City event updates the residents of Denver on accomplishments of the last year and the vision the Mayoral administration has for the year ahead.
In the past, this event was marked by a speech and a State of the City Report. This report ranged in length from 20 to 40 pages. Analytics showed that few people would download the report from the website and the assumption was that ever fewer were taking the time to read the whole document.
For the most recent State of the City, the Mayor’s office requested a new approach. In 2017, the city provided a live stream of the speech and a corresponding web page that gave an executive summary. The information was condensed from a 20-plus page report into 10 infographics, providing the critical points of the speech in an easily digestible format.
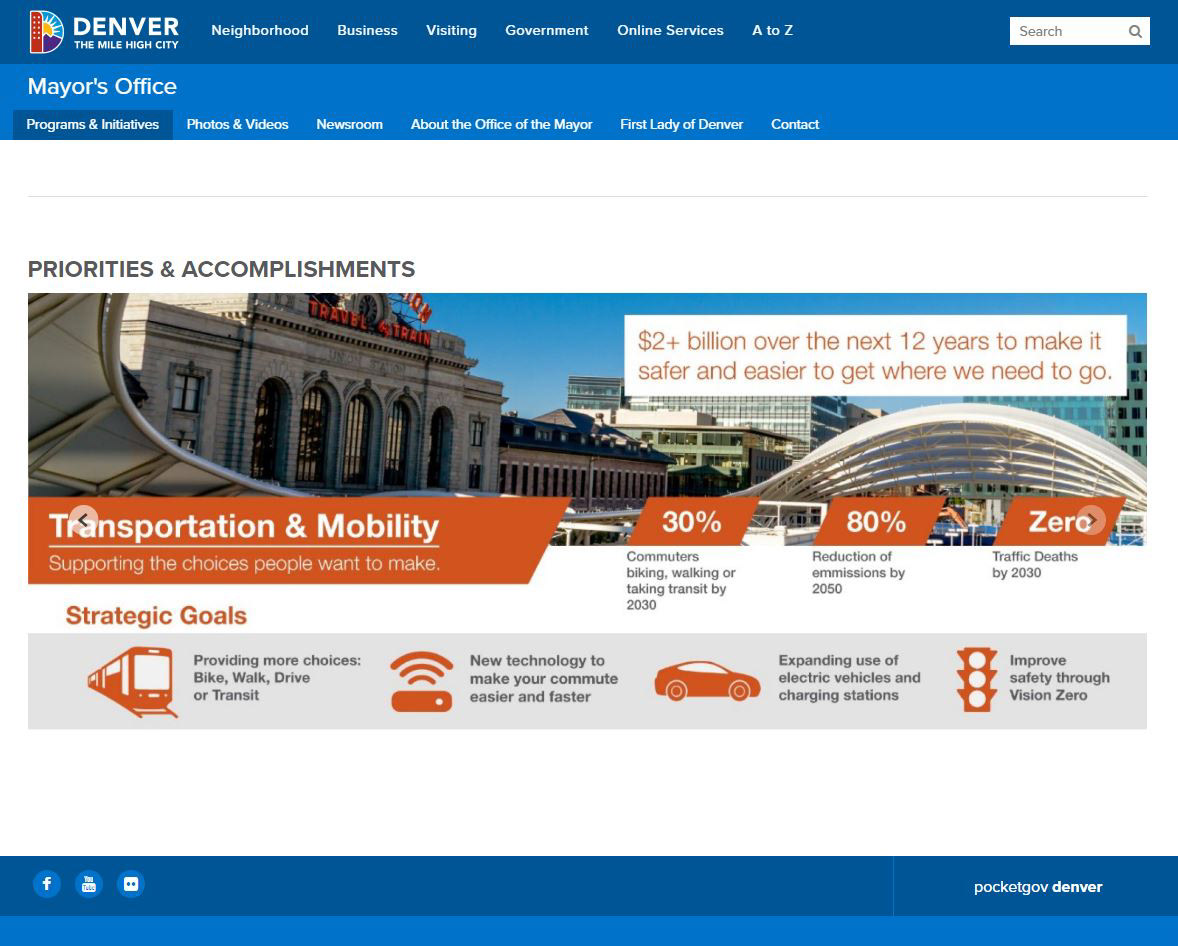
Screenshot of State of the City Website focused on Info-graphic Image Gallery
The Process - A Multi-Faceted Effort
The creation of these infographics was a joint effort between the Mayor's office, pertinent city agencies, and the Denver Marketing and Media Services team. This collaborative effort led to the production of infographics that showcased the most important stats and main points of the State of the City speech in an easy to read, visually engaging format.
For this project, we used Adobe Illustrator for the infographic templates and iconography and Adobe Photoshop to finesse some of the photos. We adhered to the City and County of Denver Brand standards for visual cohesion with the website. Approved infographics were placed in an image gallery on the State of the City page in a photo gallery using the Adobe Experience Manager Platform.


The Result? Better Citizen Engagement Even After The Speech
The State of the City is always a popular event on the day it occurs, but after the speech interest wanes. With the new format, there was a spike of interest of the day of the speech, as well as in engagement post-event.
Below are the page view trends from July 2016 - December 2016 under the more traditional format. Total page views for this period were 2,991:

July to December 2016 showing spike in interest on day of speech then sharp decline.
In the same period from July 2017 – December 2017, there were 3,956 page views (up over 30 percent). With the 2017 State of the City vanity URL, there is a more gradual decline in interest, as well as a spike in September 2017 (the spike can be attributed to large Mayoral initiatives being implemented and people cycling back to the State of the City page for details).

This citizen-centered approach to providing executive summary level details on very complex issues proved to be a valuable asset to all. City agencies and the Mayor's office were able to showcase their accomplishments and goals, and the Denver Marketing and Media Services department was able to create visually engaging content - pushing the boundaries on the old government stereotypes.


