A graphic design application acting as an alternative to the thermostat that aims to reduce heating energy waste through targetting resident behaviour.
COMMUNICATION QUESTION
How can graphic design be applied in order to improve the use of physical space?
How can graphic design be applied in order to improve the use of physical space?
METHODOLOGY
1. Observe problem or opportunity in a specific space
2. Collect appropriate data (contextual, historical, numerical)
3. Analyze data
4. Design
1. Observe problem or opportunity in a specific space
2. Collect appropriate data (contextual, historical, numerical)
3. Analyze data
4. Design
TARGET SPACE
Aged households
PROBLEM
Excessive energy consumption for heating in aged households due to manual heating control.
STATISTICS
Old houses (built before 1976) represent 73% of total UK housing stock. Only 22% of houses are considered modern. The average family spends £22 for gas and £13 for electricity per week. Heating accounts for 67.5% of total household energy use.
AUDIENCE
Mostly families/students unable to afford modern housing and aged tenants reluctant to leave due to extended periods of inhabitance, more than 20 years.
Mostly families/students unable to afford modern housing and aged tenants reluctant to leave due to extended periods of inhabitance, more than 20 years.
IDEA
Graphic design applications that target resident behaviour in order to solve the problem.
Graphic design applications that target resident behaviour in order to solve the problem.
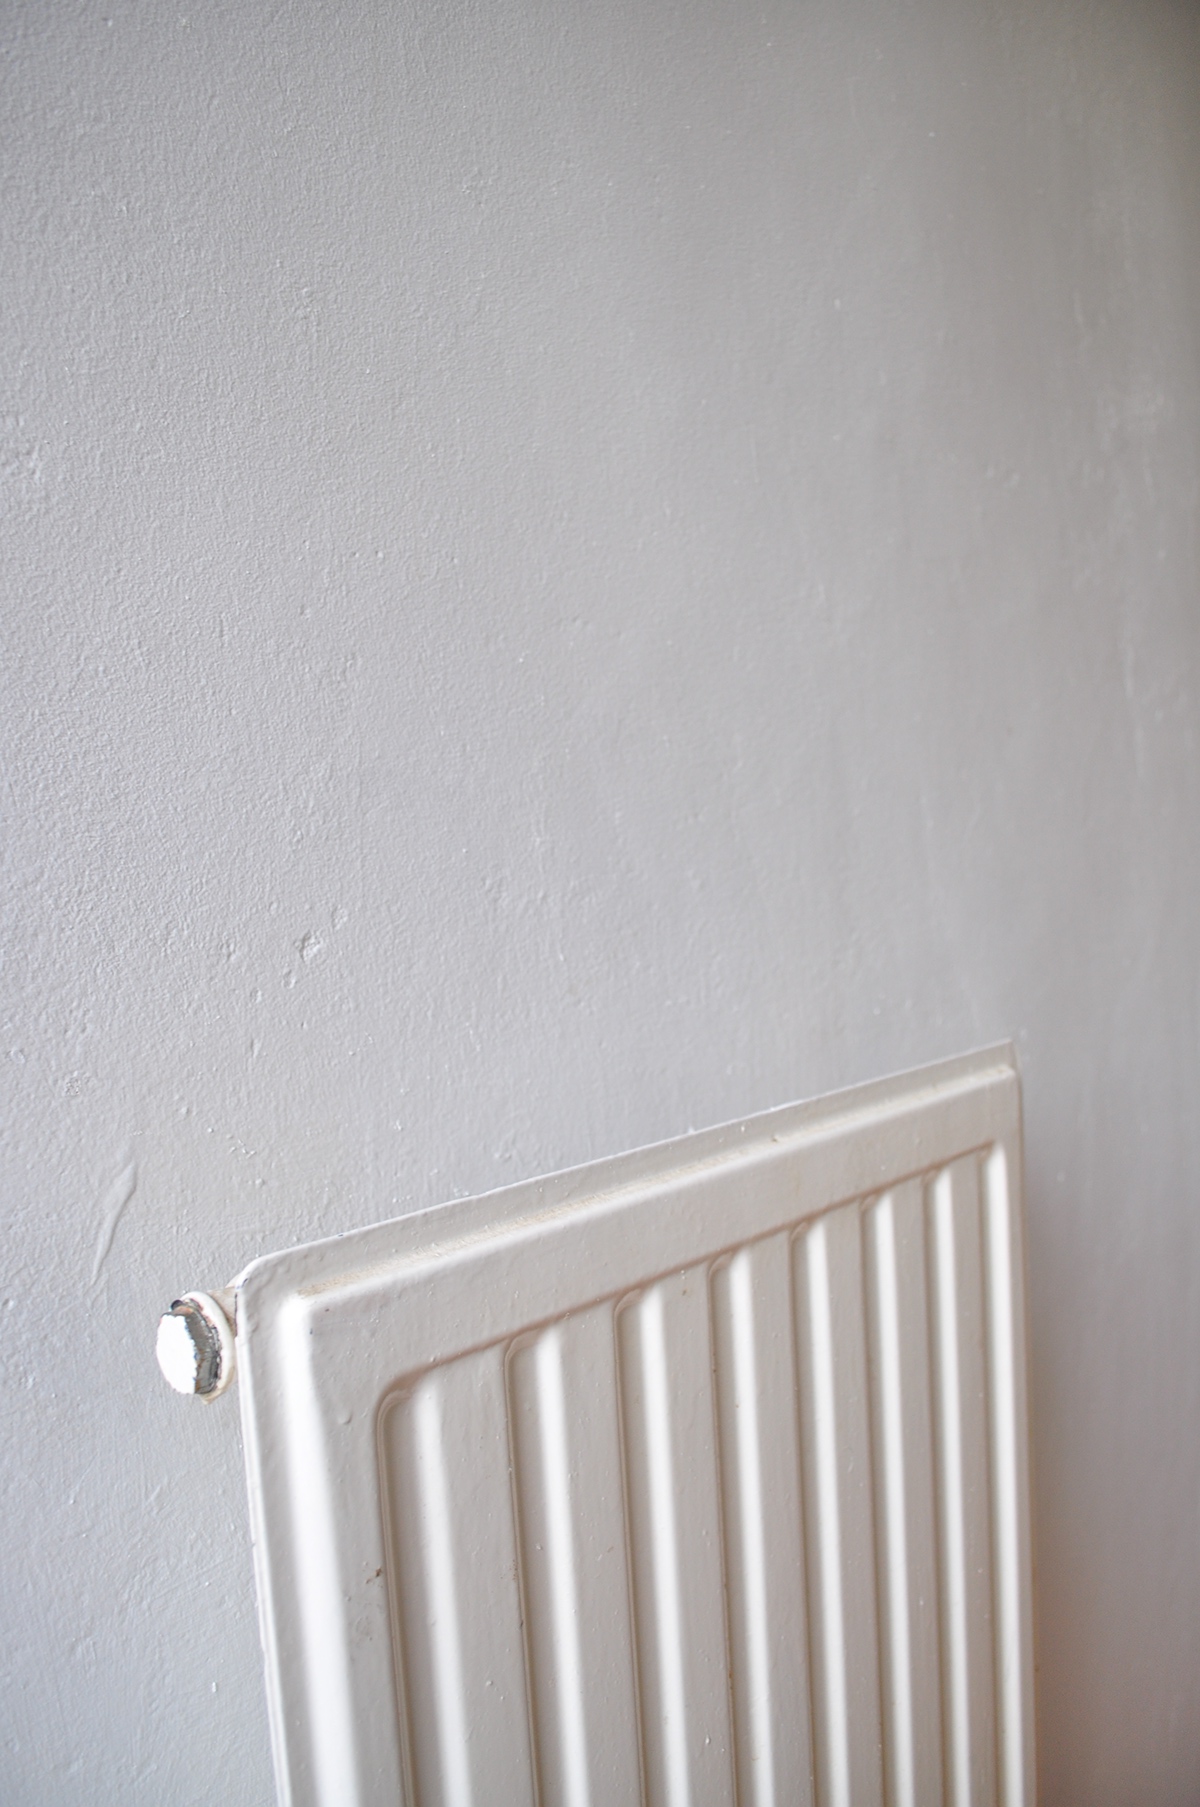
DESIGN
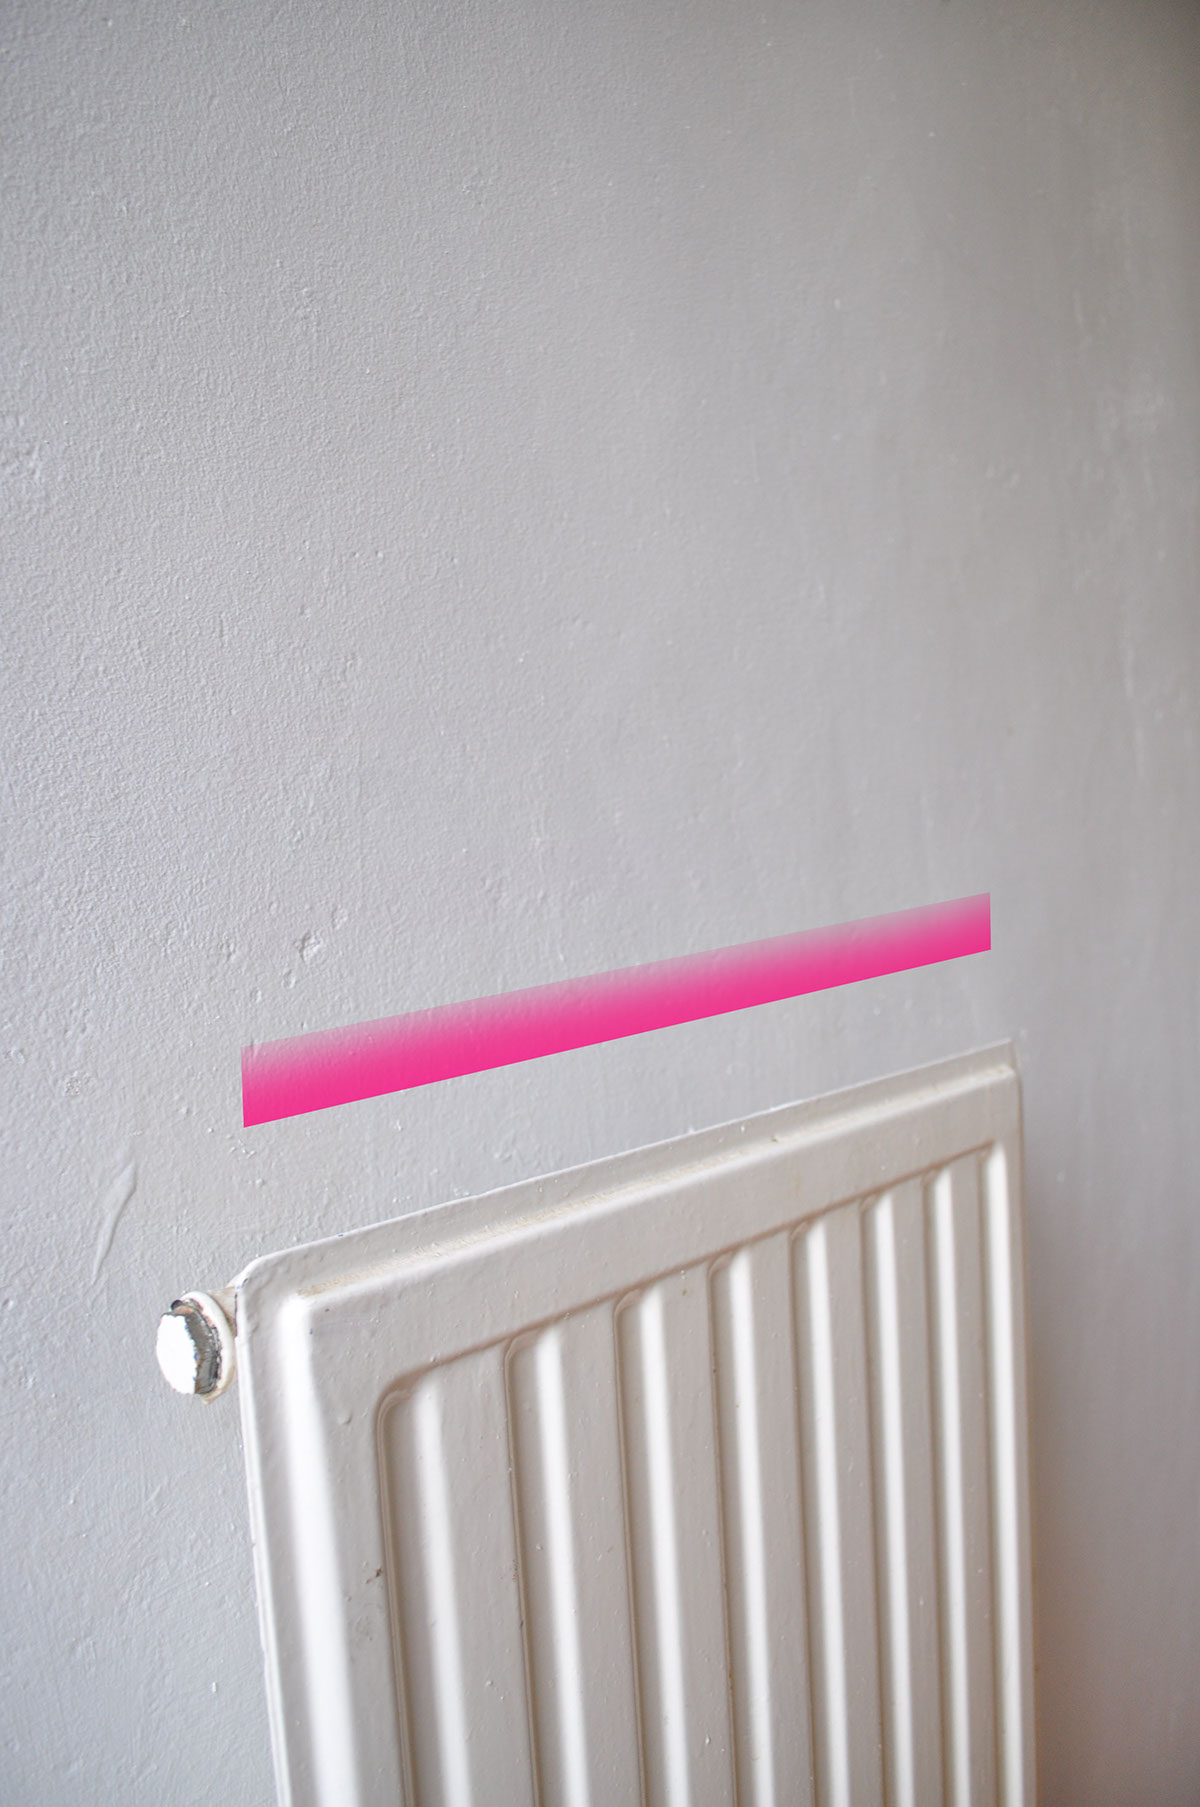
Heat-sensitive prints that become apparent at a certain temperature and alert the user.
Heat-sensitive prints that become apparent at a certain temperature and alert the user.
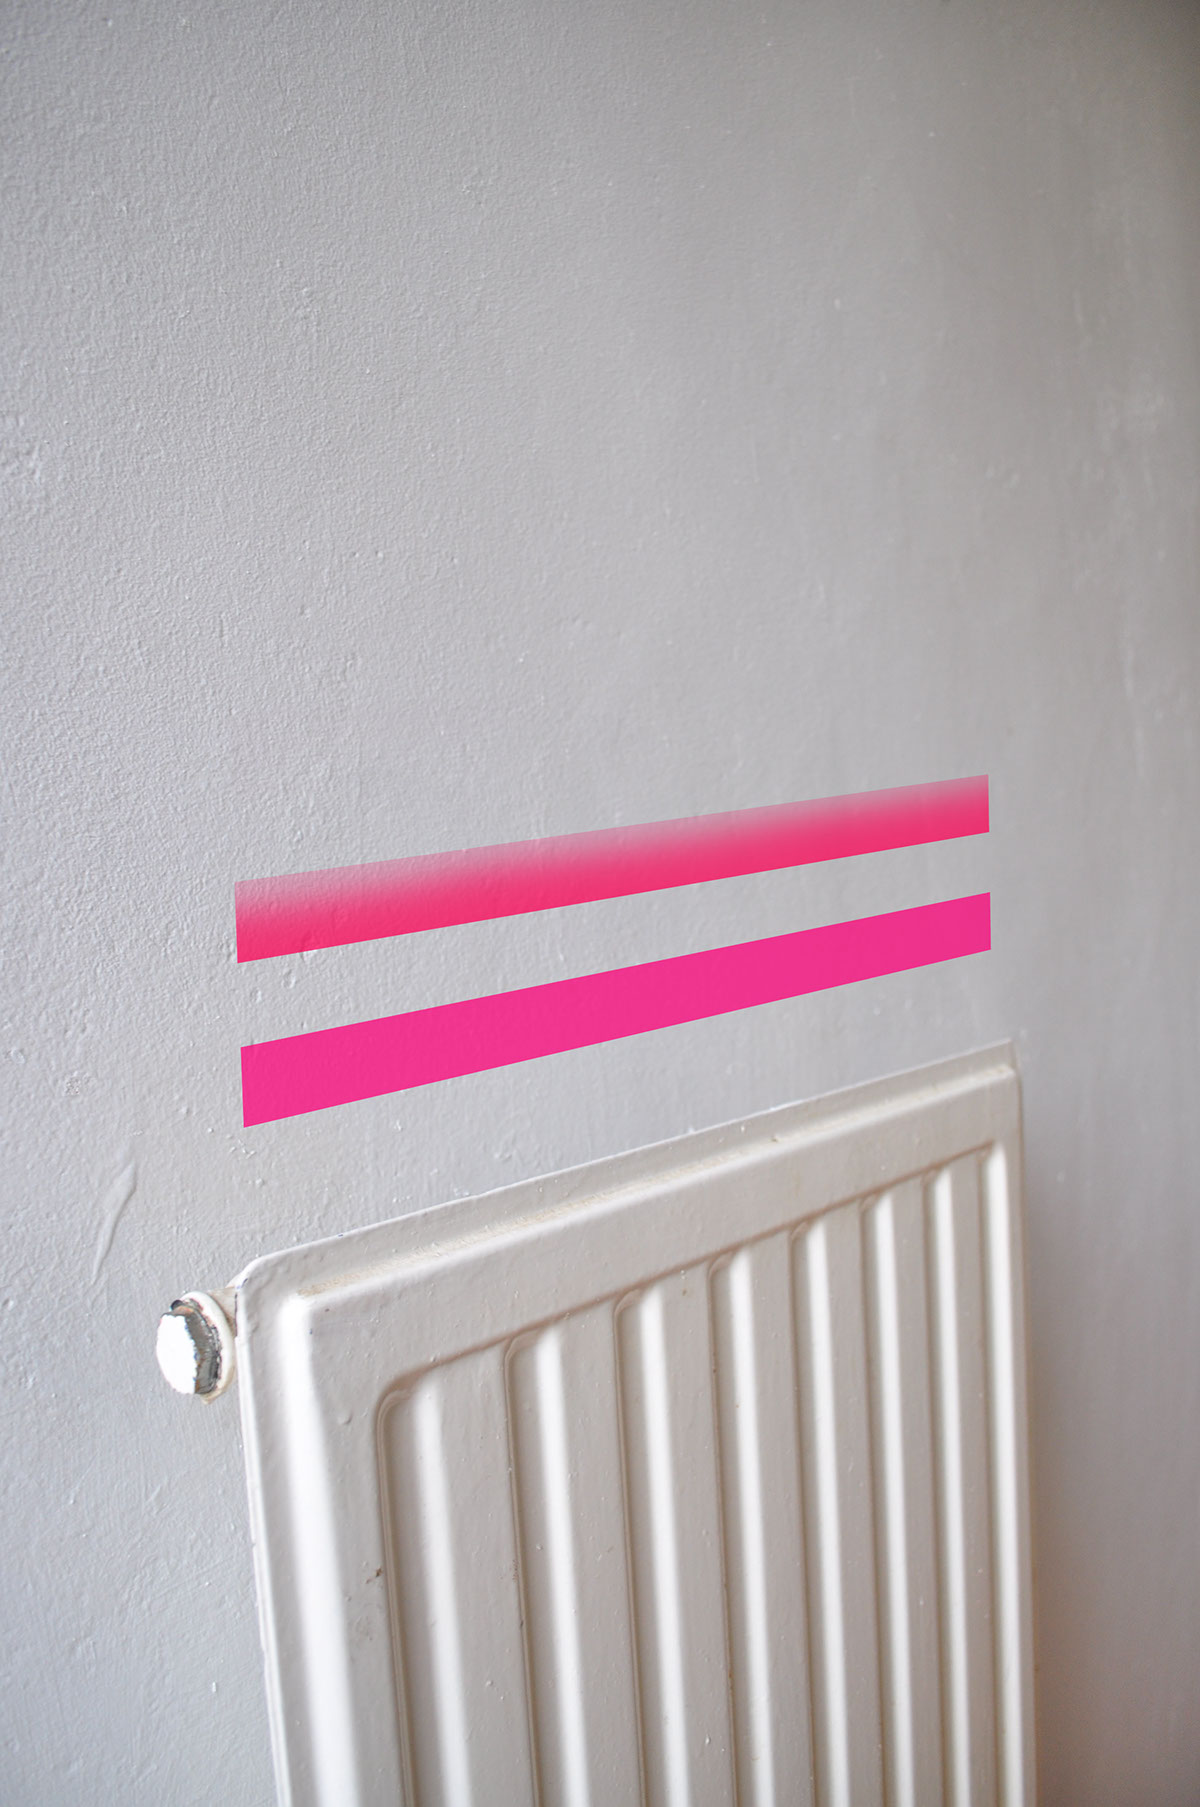
CHROMATIC APPROACH
Colour as signage
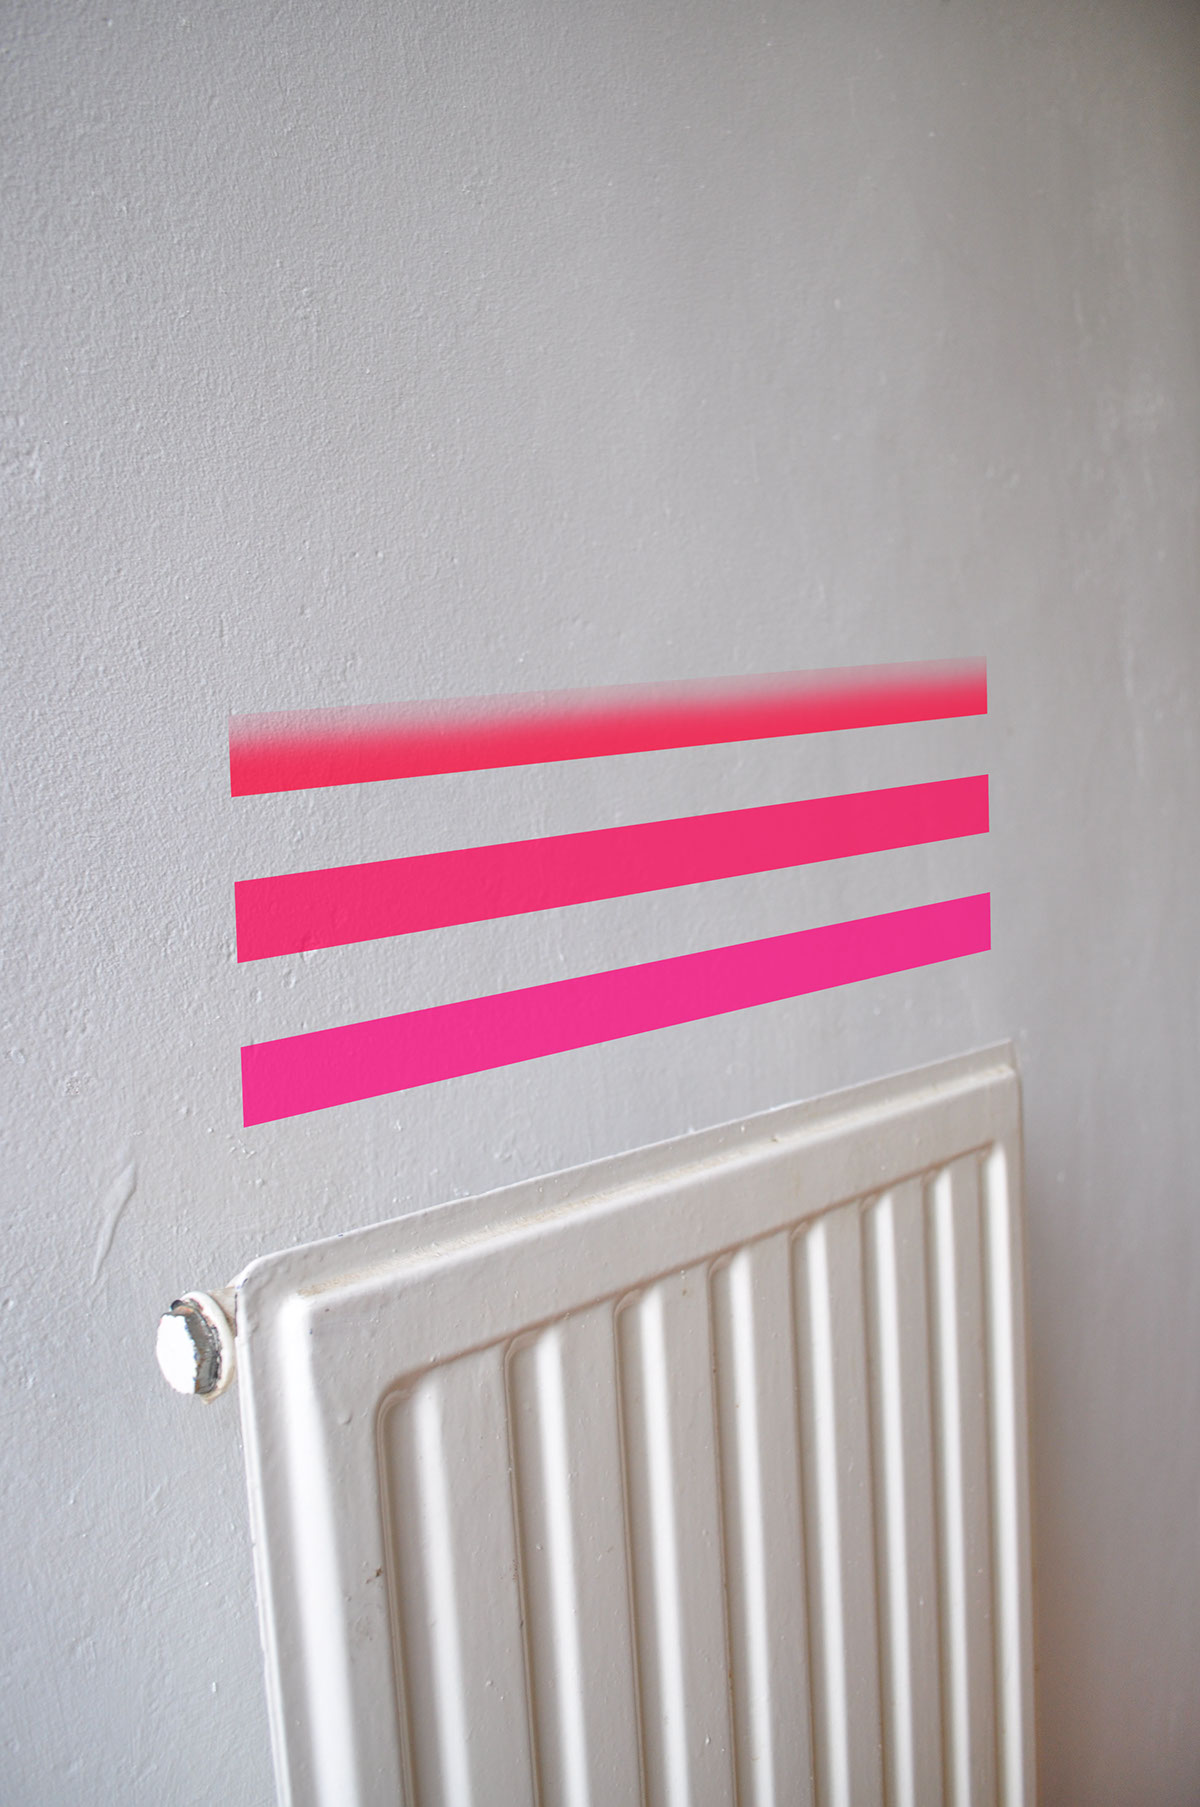
A scale of different colours that represents a temperature scale from colder to warmer. The pink colours of the first two indicators aspire a warm and cozy feeling as the radiator starts emanating heat.

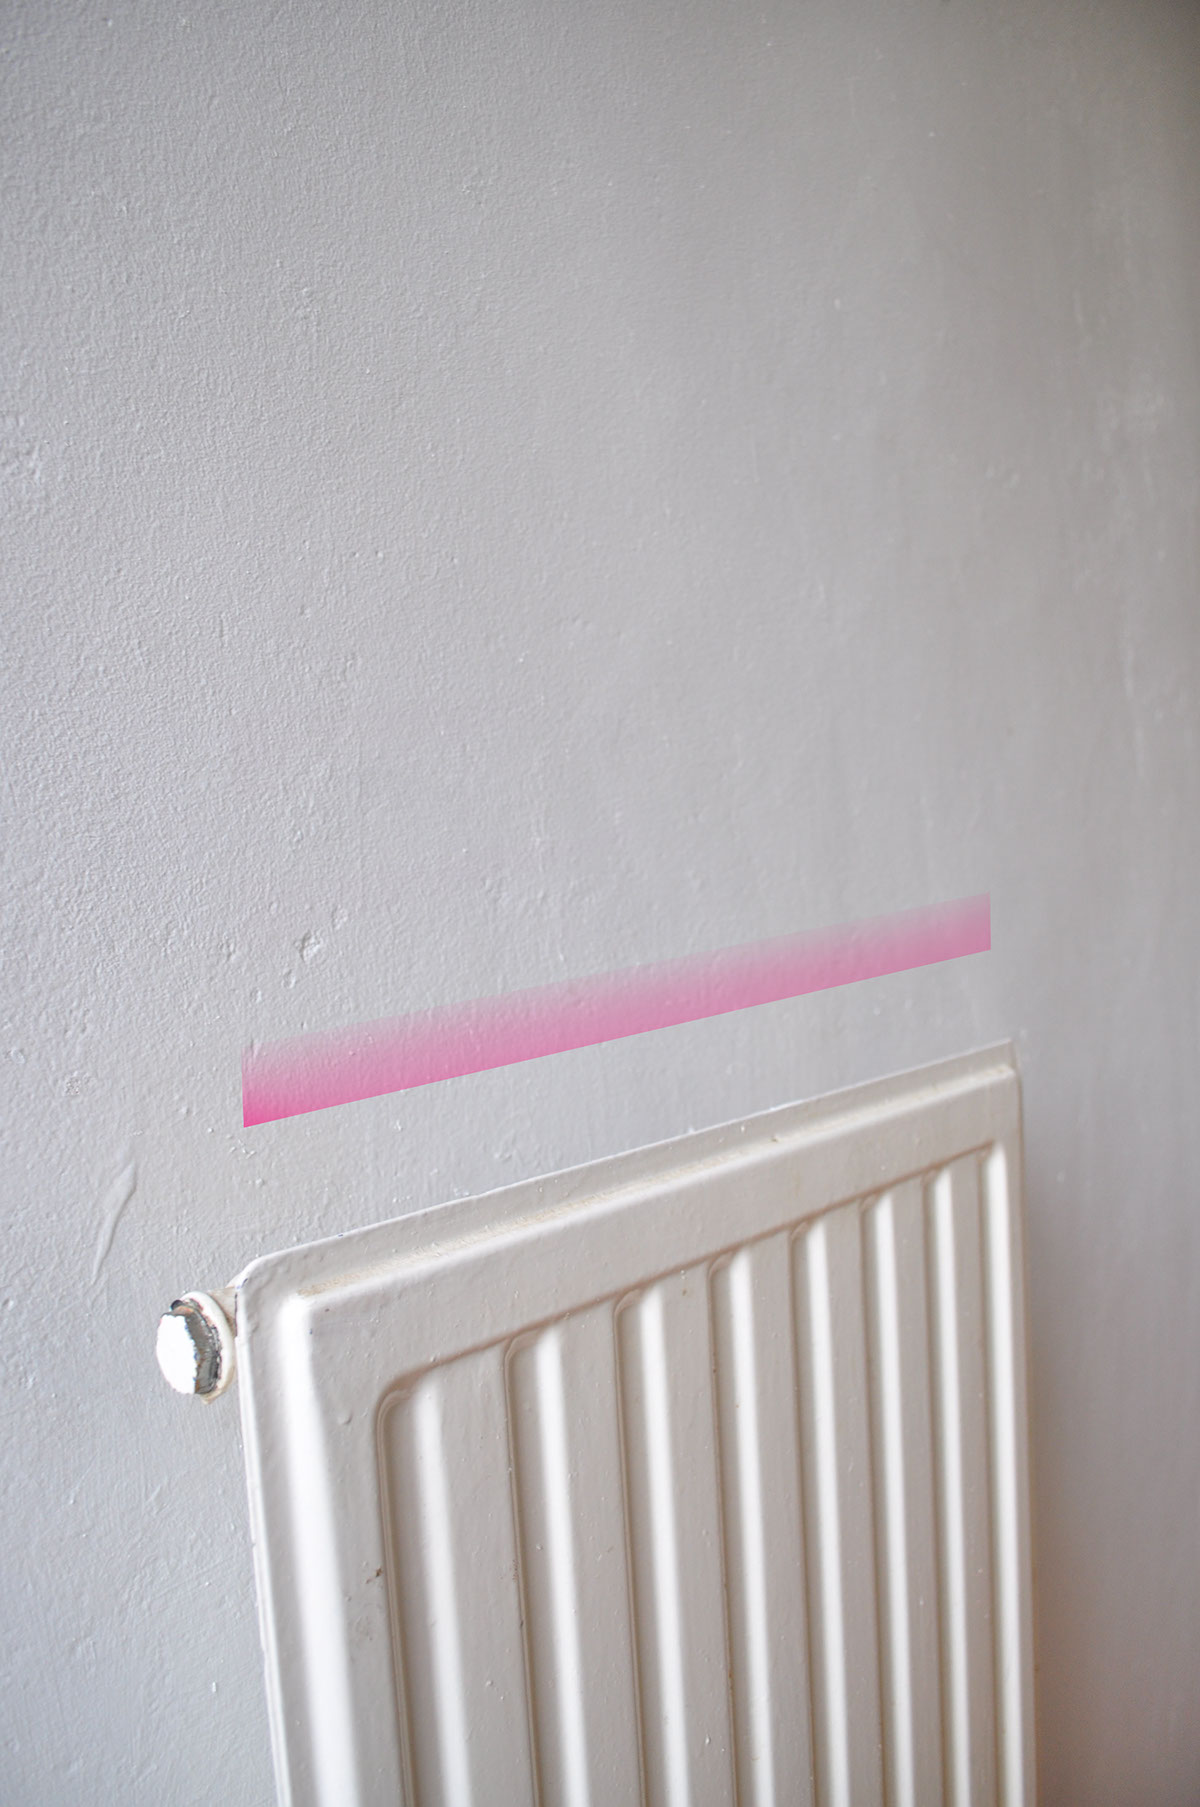
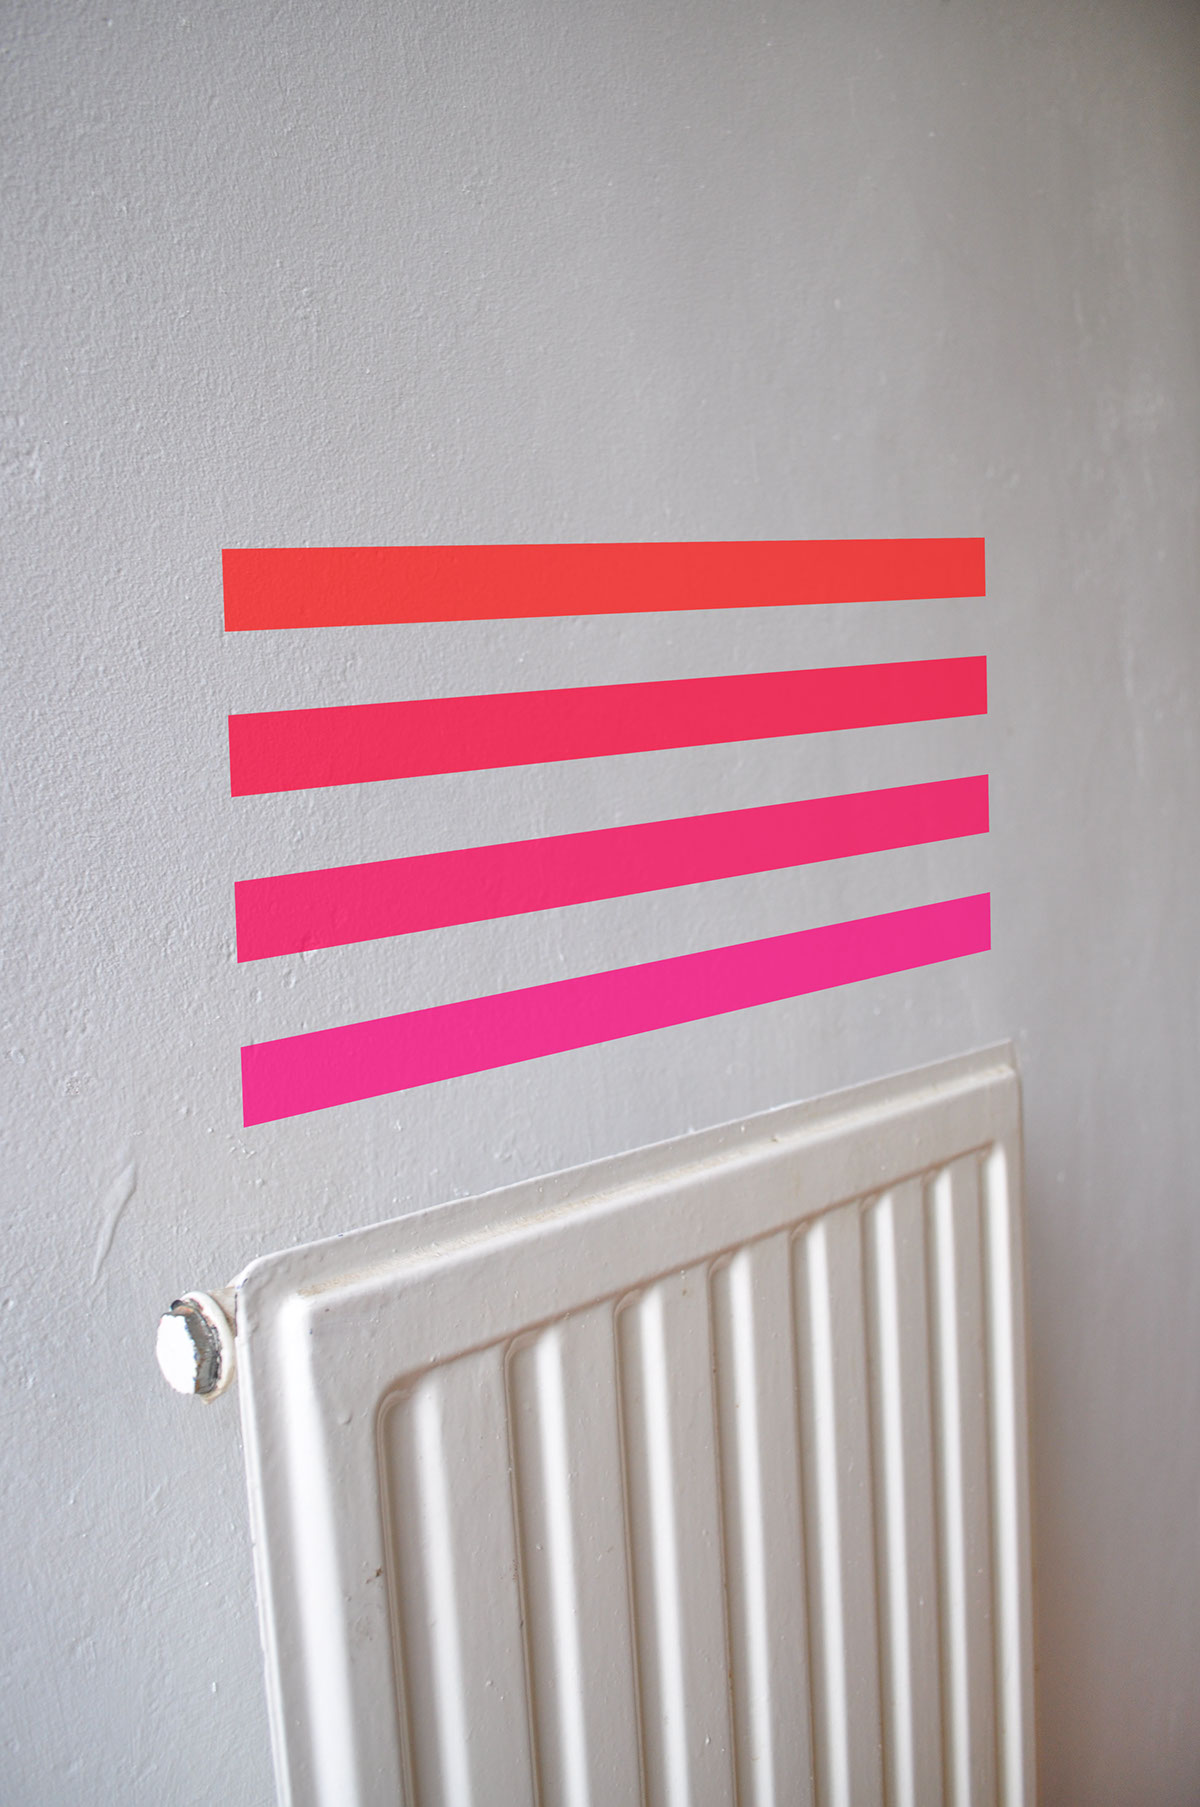
When heat consumption starts becoming excessive the colours of the scale start turning red, aspiring a feeling of discomfort and danger.
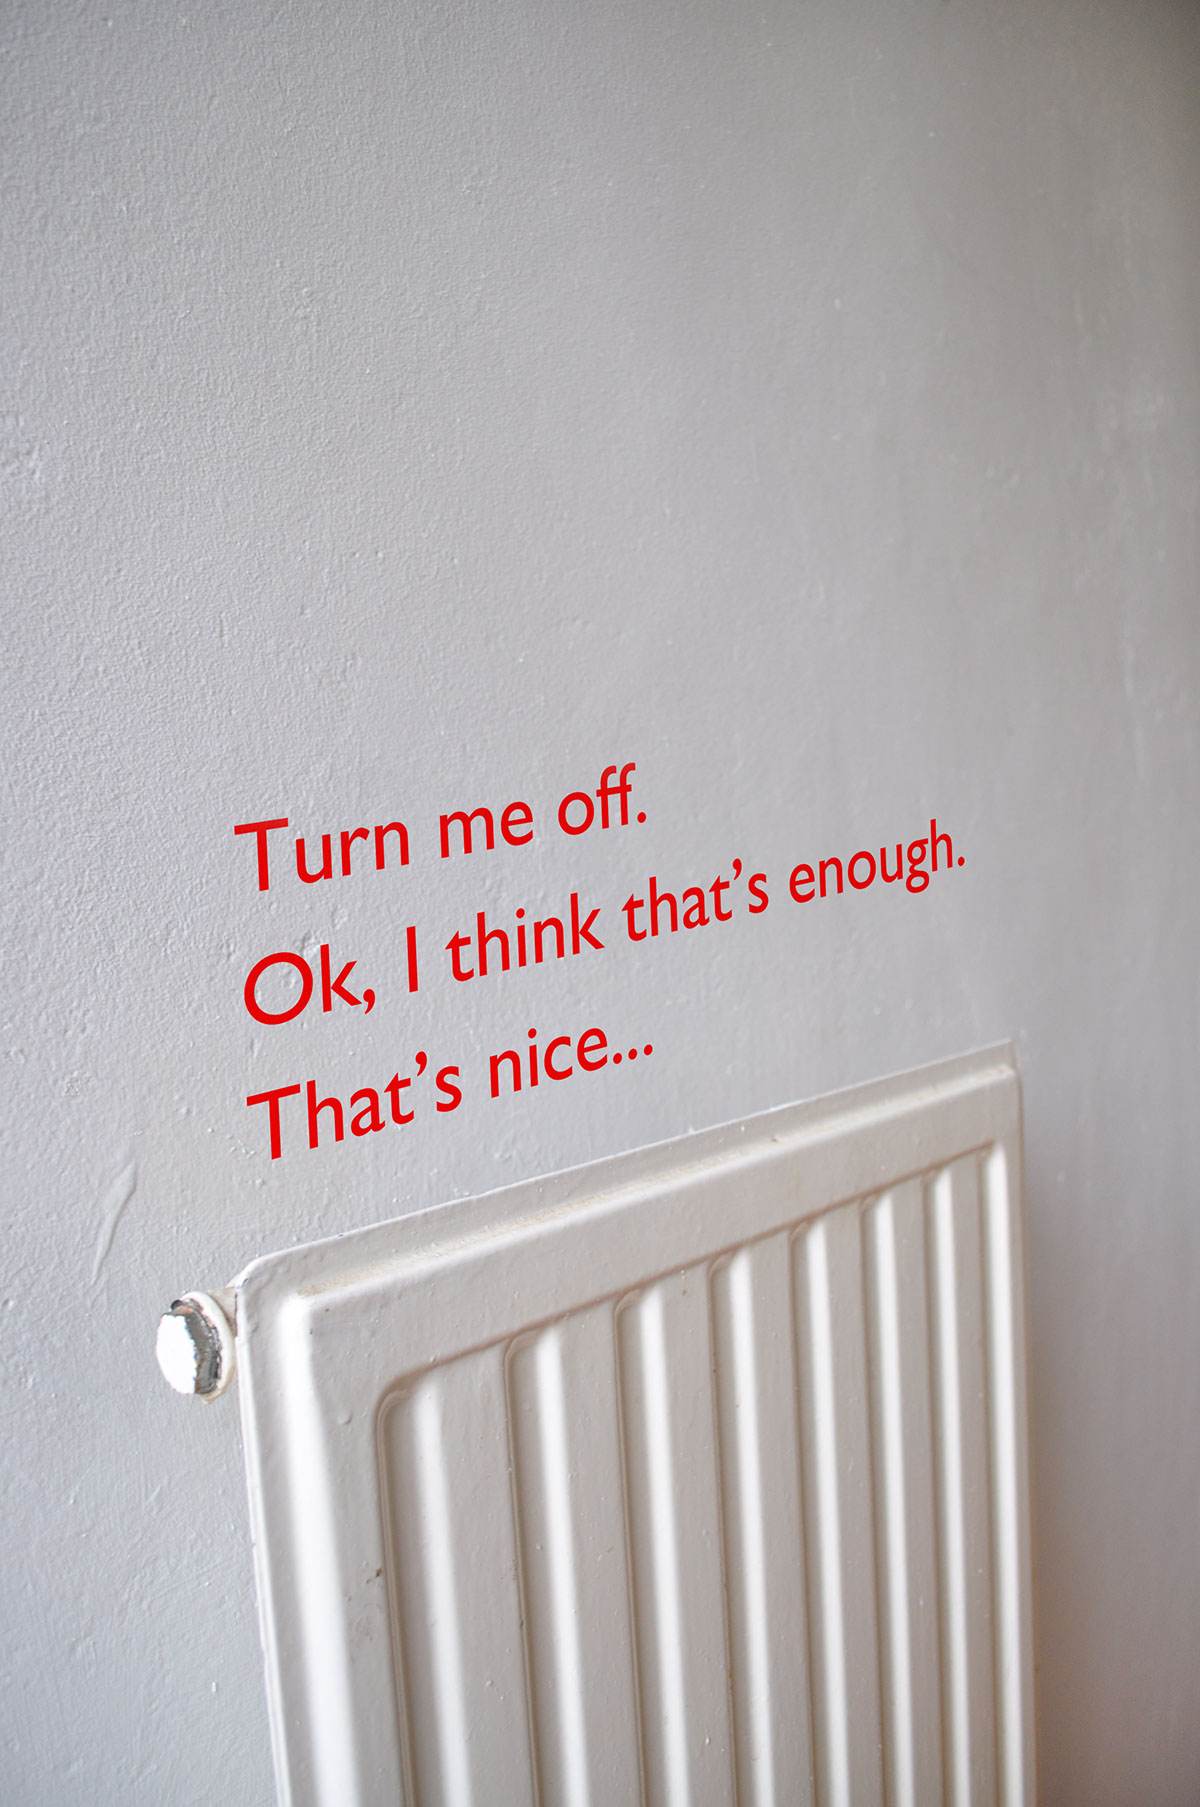
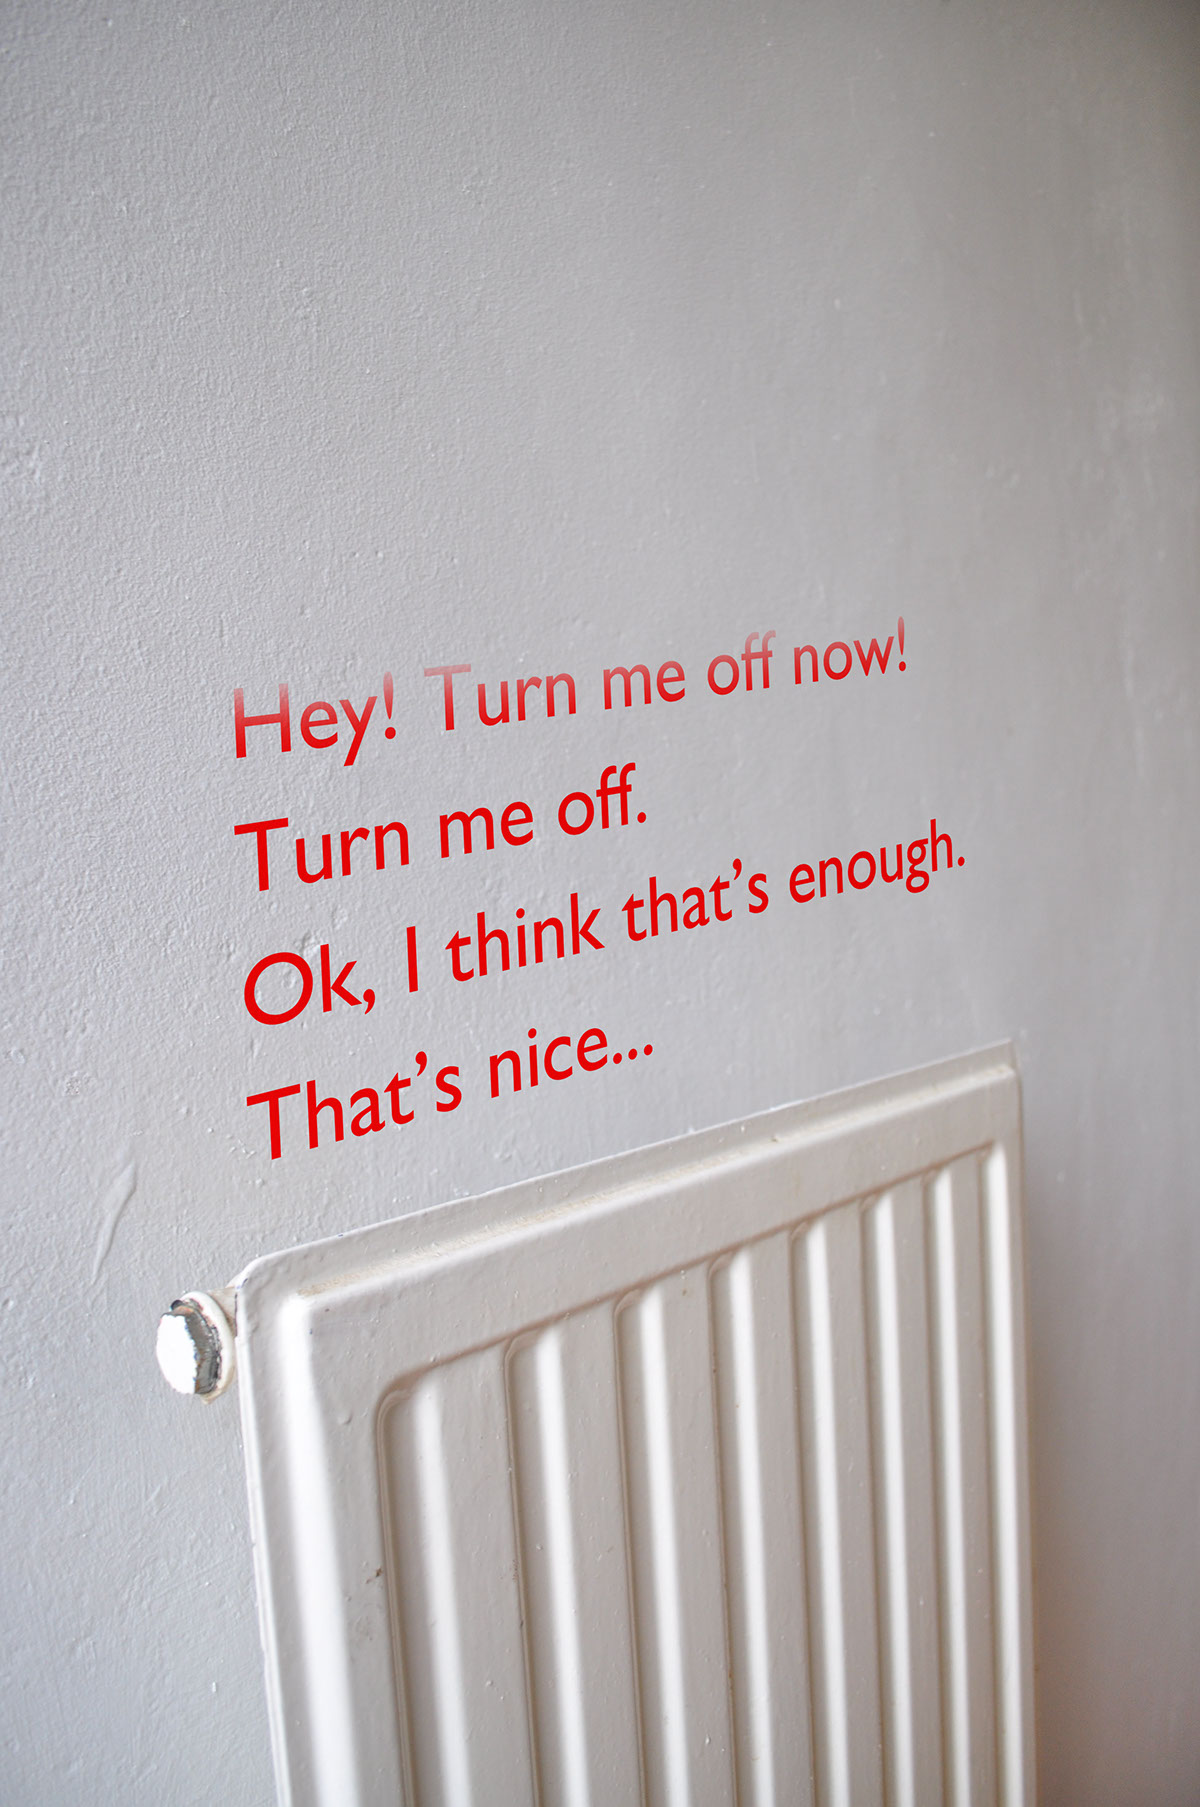
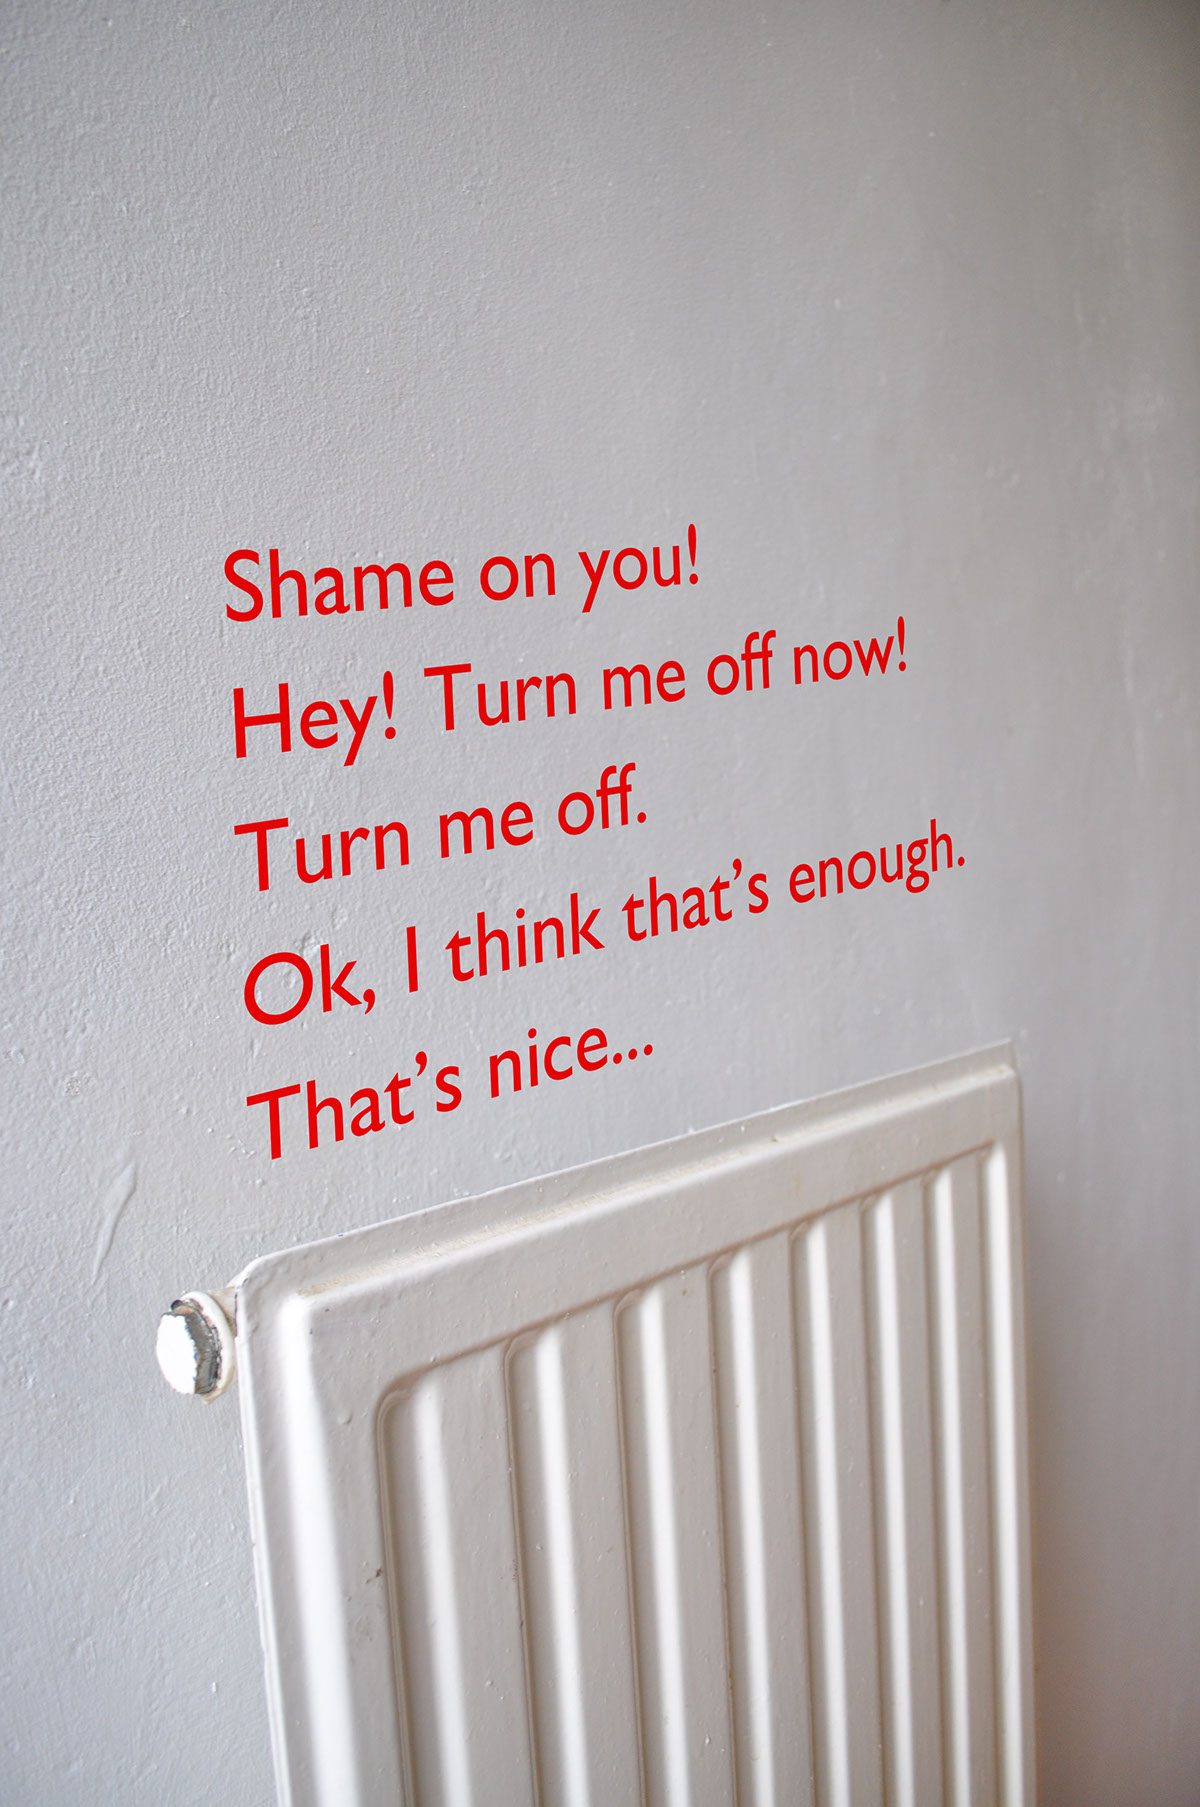
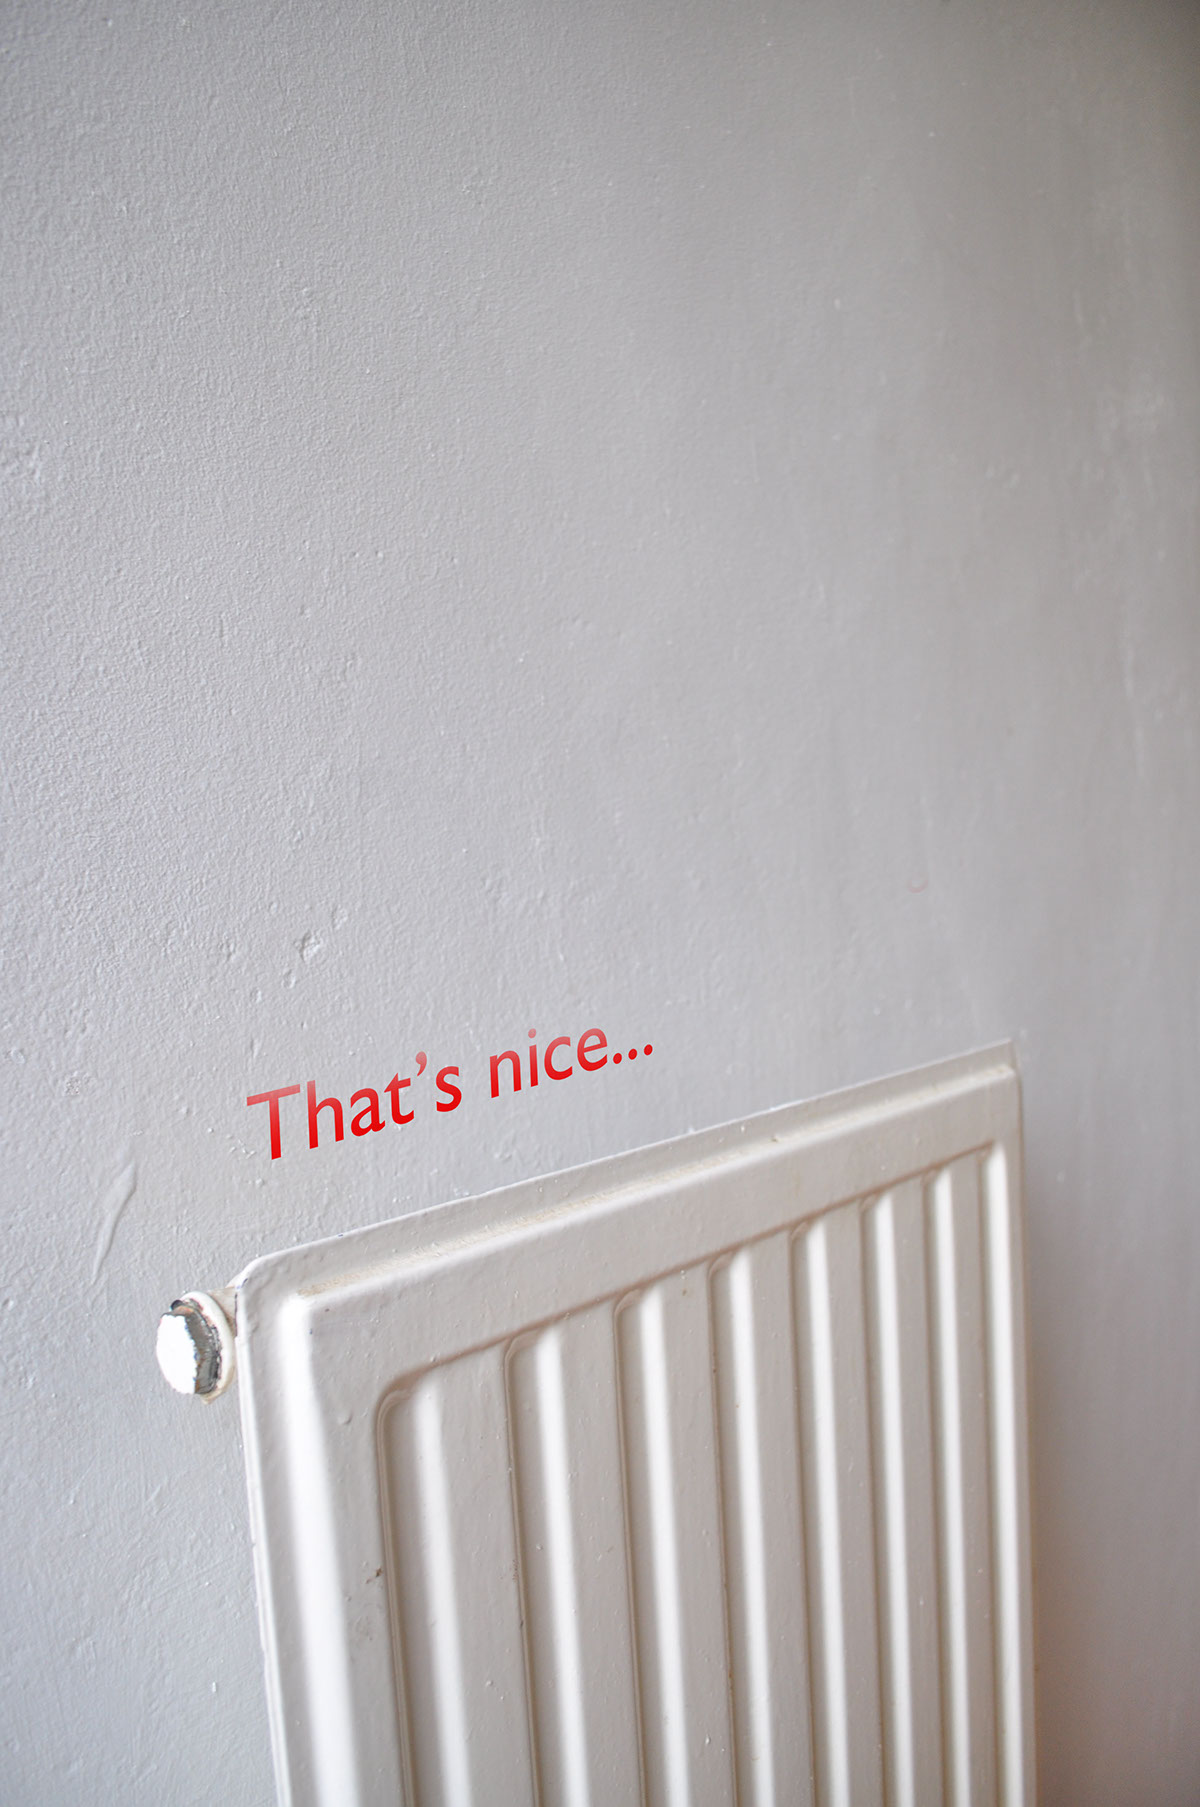
TYPOGRAPHIC APPROACH
What would your radiator tell you?
When you turn on the heating, the atmosphere starts getting enjoyably warm. After a while the room
reaches a desirable temperature. It is then time to turn the heating off.
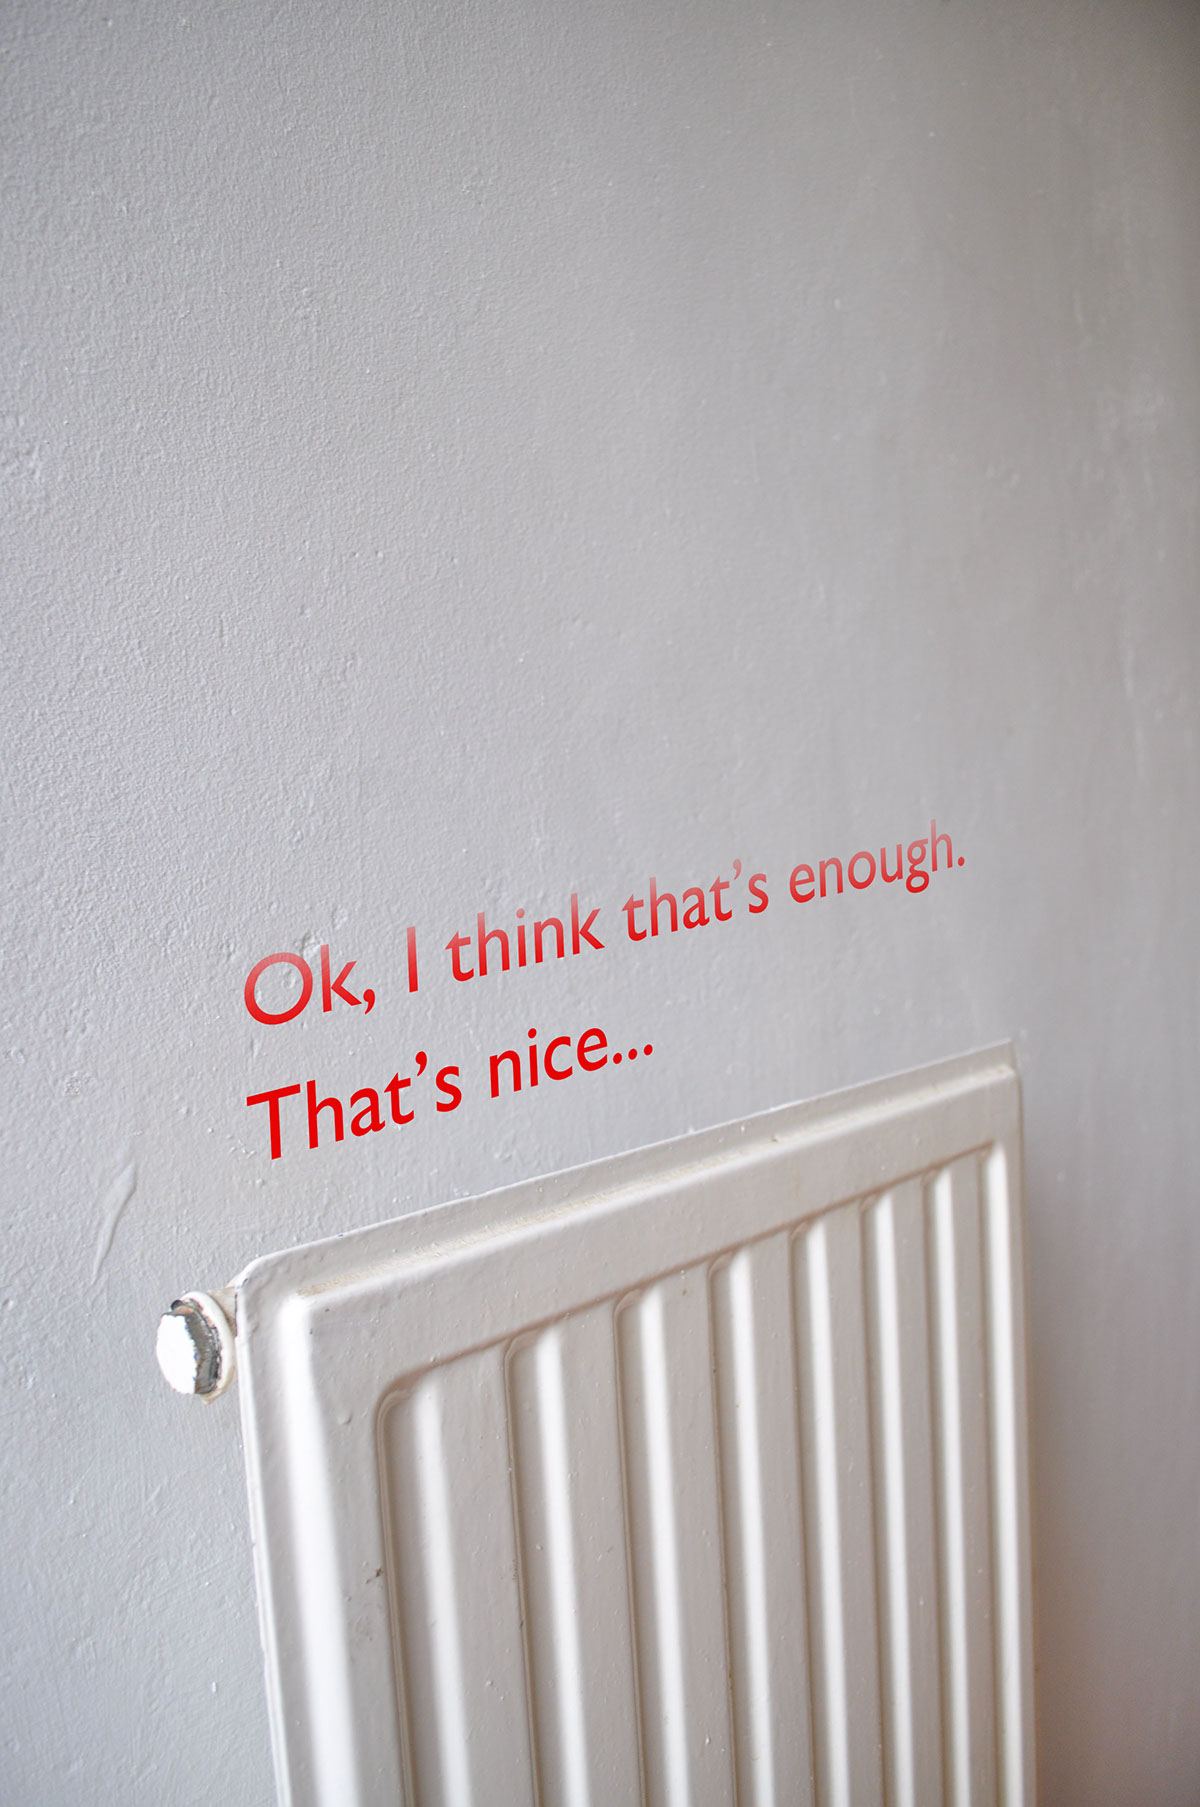
The radiator continues to tell the user to turn it off, each time more aggressively until finally he/she decides to do so, thus tackling the problem through targetting user behaviour.