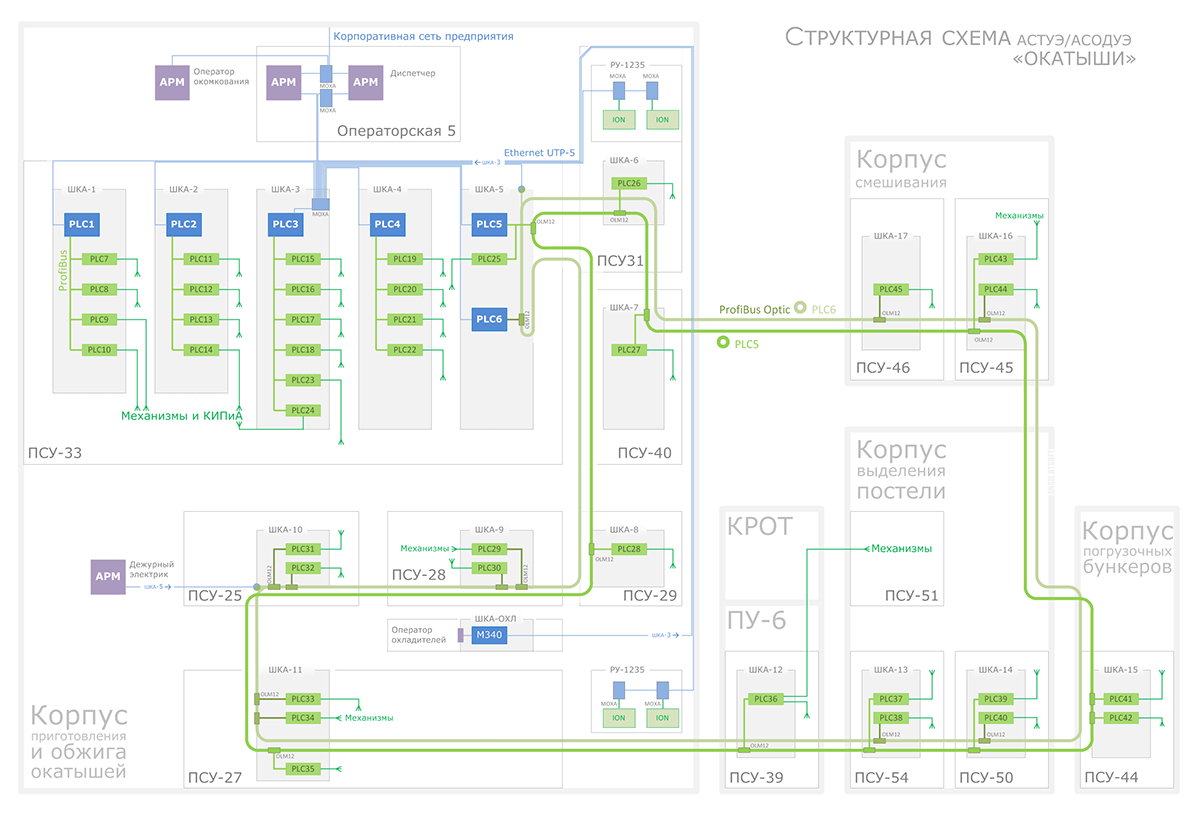
The chart shows the process automation system structure at Katch Kanar ore mining plant.
The system was developed in RTSoft with my participation in 2010–2012
What the hell is it?
Operator's workstations (APMs) are connected by Industrial Ethernet with 6 controllers (PLC 1 to 6), which drive all plant facilities in different buildings from a single room • To make this possible 9612 input-output analog and digital signals are collected, distributed and raw-processed by a lower-level IO system of 39 modular stations (PLC 7 to 45) — those are wired up with ProfiBus over copper medium and fiber, where the distance is too large for copper (fiber ring is about 1.5km long).
Design tricks
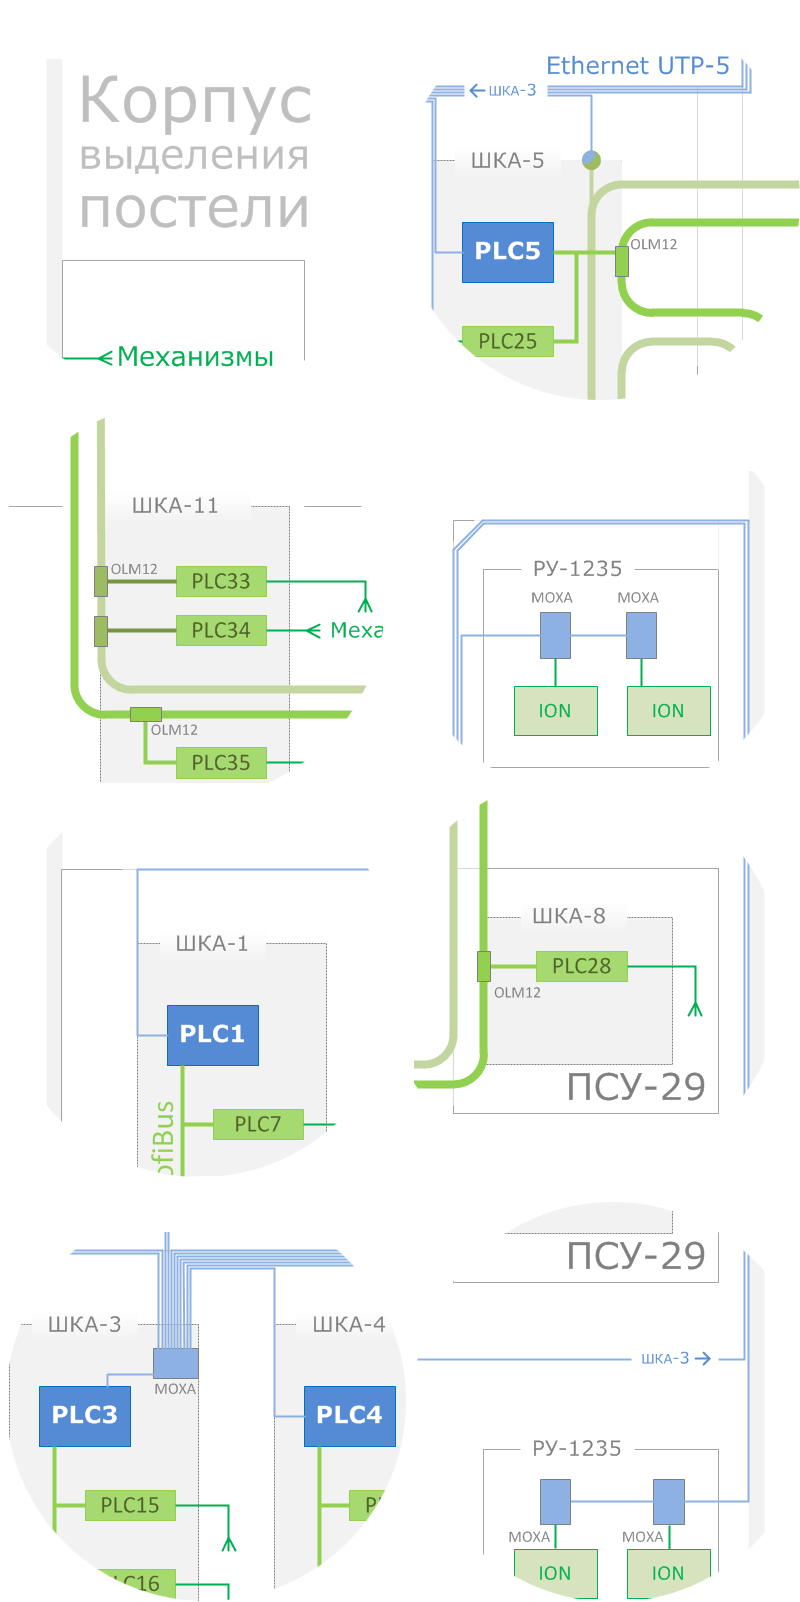
Along with equipement and networks, buildings, rooms and lockers are displayed — all labeled and arranged with respect to physical locations • Networks of different purpose/type are separated with colour, line thickness and edge rounding radius • Chart gives no fail when printed in black and white • A lot of effort was put into neutralizing visual noise • Respecting the law 1+1=3 or more, lines were sticked together without whitespace in between, if the separation is not essential • You can see how field wires embrace the walls of rooms and lockers, playing a double role.