Making the concept of supply chains tangible
From the food we eat to the clothes we wear, supply chains affect us every day. While they are pervasive, their concept can also be hard to understand.
"Academics can’t agree on a shared definition of what a supply chain is and levels of understanding of among policy makers, business leaders and lay people alike are generally very poor."
The Warwick Manufacturing Group was in search of new ways to engage the public and make supply chains understandable in human terms. We worked with their researchers as well as two multinational companies to analyse, design and represent supply chains in intuitive ways, resulting in a data sculpture that is now permanently exhibited at the University of Warwick.


It's all about connections
The most telling aspect of supply chains is the vast connectivity between products and suppliers. While it is the connections that make a supply chain to what it is, they are precisely the part of the story that usually stays invisible to the public.

Visualising pieces of data and the relations between them can make characteristics of a system intuitively accessible. Working with operational data from two companies, the first thing we did was to get a deeper understanding of the unique interconnections making up their supply chains. Although the term "chain" evokes the idea of linear links, visualizing the data quickly taught us that supply chains are much more like networks.
From visualisation to physicalisation
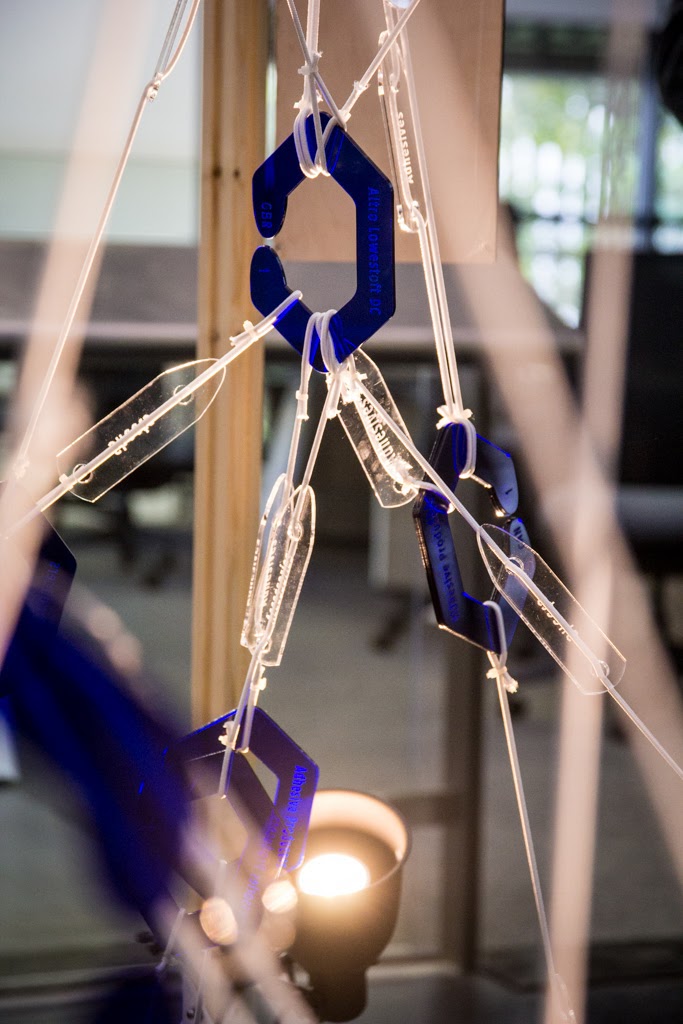
For the final realisation, we took the technique of visualising data in graph form one step further by designing a visual language of physical components to represent the supply chains we investigated. The data sculpture we built out of this modular system is called LINK and represents the supply chains of two companies, each with their own characteristics.

Simple parts
LINK consists of interlocking pieces that represent the suppliers, factories, distribution centers, customers and the products travelling between them. Each category of elements has its own shape which visually encodes its type and also determines which other categories can be linked to it. Individual pieces are labelled with the specific supply chain element it represents.

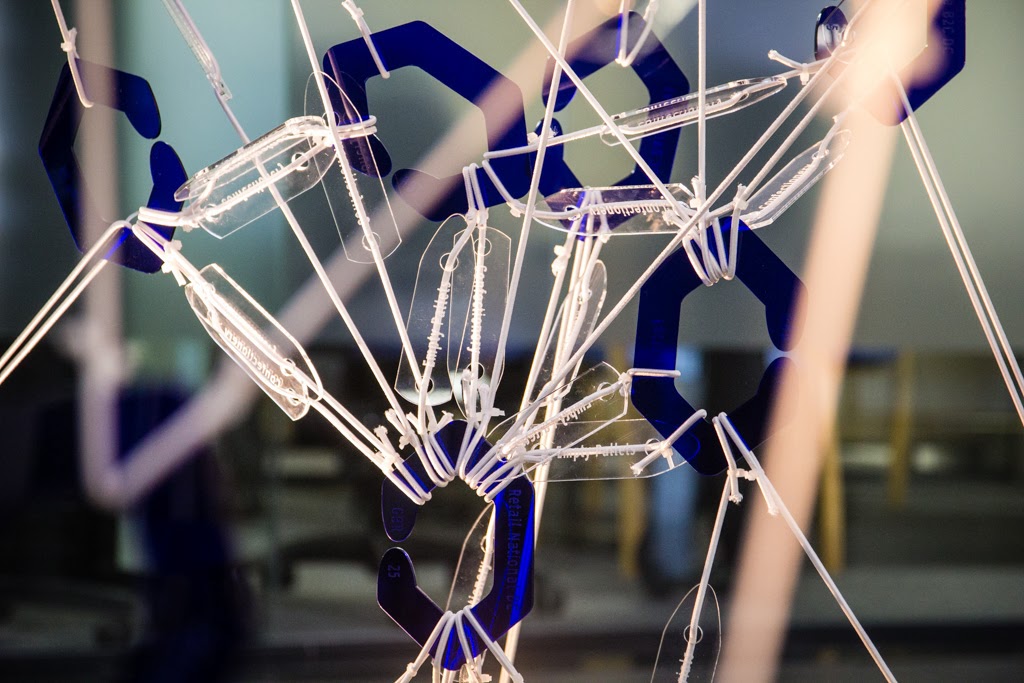
Complex structures
By making these simple connections, complex structures emerge at a higher level. The interconnected pieces of LINK allow to take a step back and see how the composition of supply chains differ from product to product.
Making it
To aid our research and design, we met with the researchers to understand and map the data present in the My Chain Reaction study. This allowed us to construct a database of elements that facilitated scalable digital fabrication of many components. The database also powered visualisations that accompany the work at the Global Supply Chain Debate and are accessible online afterwards.

All components of the installation were digitally fabricated by laser cutter from durable material.
“LINK has created a vehicle through which we can engage with different stakeholders. It has proven particularly useful at helping other companies visualise the shape and flows within their supply chain and potential pinch points. Unfold were extremely professional and easy to work with. LINK has far exceeded my expectations in terms of the quality of finish, and most importantly its power to engage.”
-Jan Godsell, Professor of Operations and Supply Chain Strategy-
"I was initially skeptical but ended up being pleasantly surprised by the effectiveness of the artwork to help visualise the supply chain. This really helped me stop seeing the supply chain as linear. The artists have actually been very effective at explaining the concept of the supply chain, probably because they are not caught up in jargon!"
-Heather Begley-
"This is probably the smartest and most innovative creative thing that I have seen a corporate entity embark on. And I have worked for a couple of the big global logistic players."
-Jonathan Withers-

