
Rain drops
25 years precipitation in Eindhoven
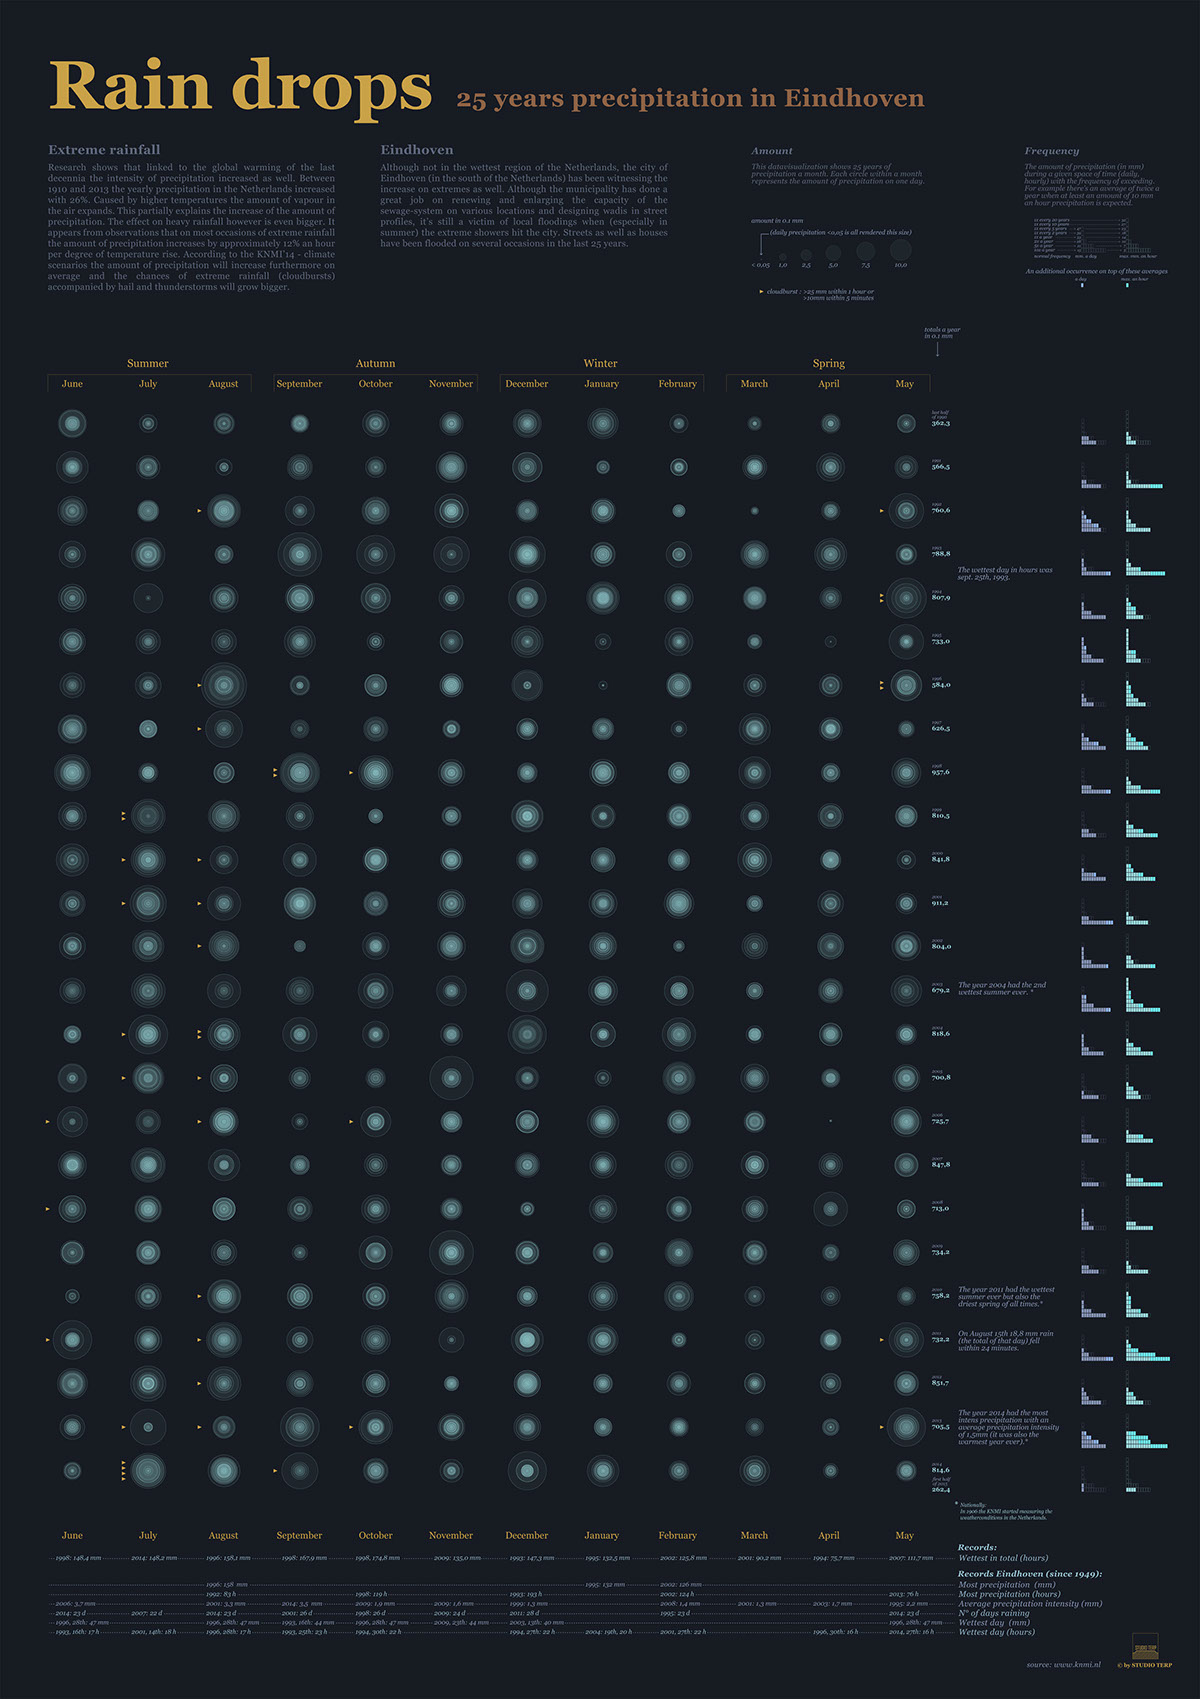
Extreme rainfall
Research shows that linked to the global warming of the last decennia the intensity of precipitation increased as well. Between 1910 and 2013 the yearly precipitation in the Netherlands increased with 26%. Caused by higher temperatures the amount of vapour in the air expands. This partially explains the increase of the amount of precipitation. The effect on heavy rainfall however is even bigger. It appears from observations that on most occasions of extreme rainfall the amount of precipitation increases by approximately 12% an hour per degree of temperature rise. According to the KNMI’14 - climate scenarios the amount of precipitation will increase furthermore on average and the chances of extreme rainfall (cloudbursts) accompanied by hail and thunderstorms will grow bigger.
Eindhoven
Although not in the wettest region of the Netherlands, the city of Eindhoven (in the south of the Netherlands) has been witnessing the increase on extremes as well. Although the municipality has done a great job on renewing and enlarging the capacity of the sewage-system on various locations and designing wadis in street profiles, it’s still a victim of local floodings when (especially in summer) the extreme showers hit the city. Streets as well as houses have been flooded on several occasions in the last 25 years.
This datavisualization shows 25 years of precipitation a month.
Each circle within a month represents the amount of precipitation on one day.


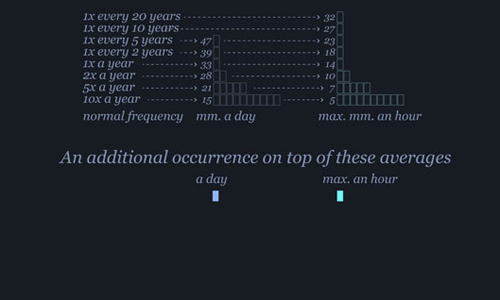
The amount of precipitation (in mm) during a given space of time (daily, hourly) with the frequency of exceeding. For example there’s an average of twice a year when at least an amount of 10 mm an hour precipitation is expected.


Thank you for viewing, please do appreciate and let me know what you think of it in the comments!

