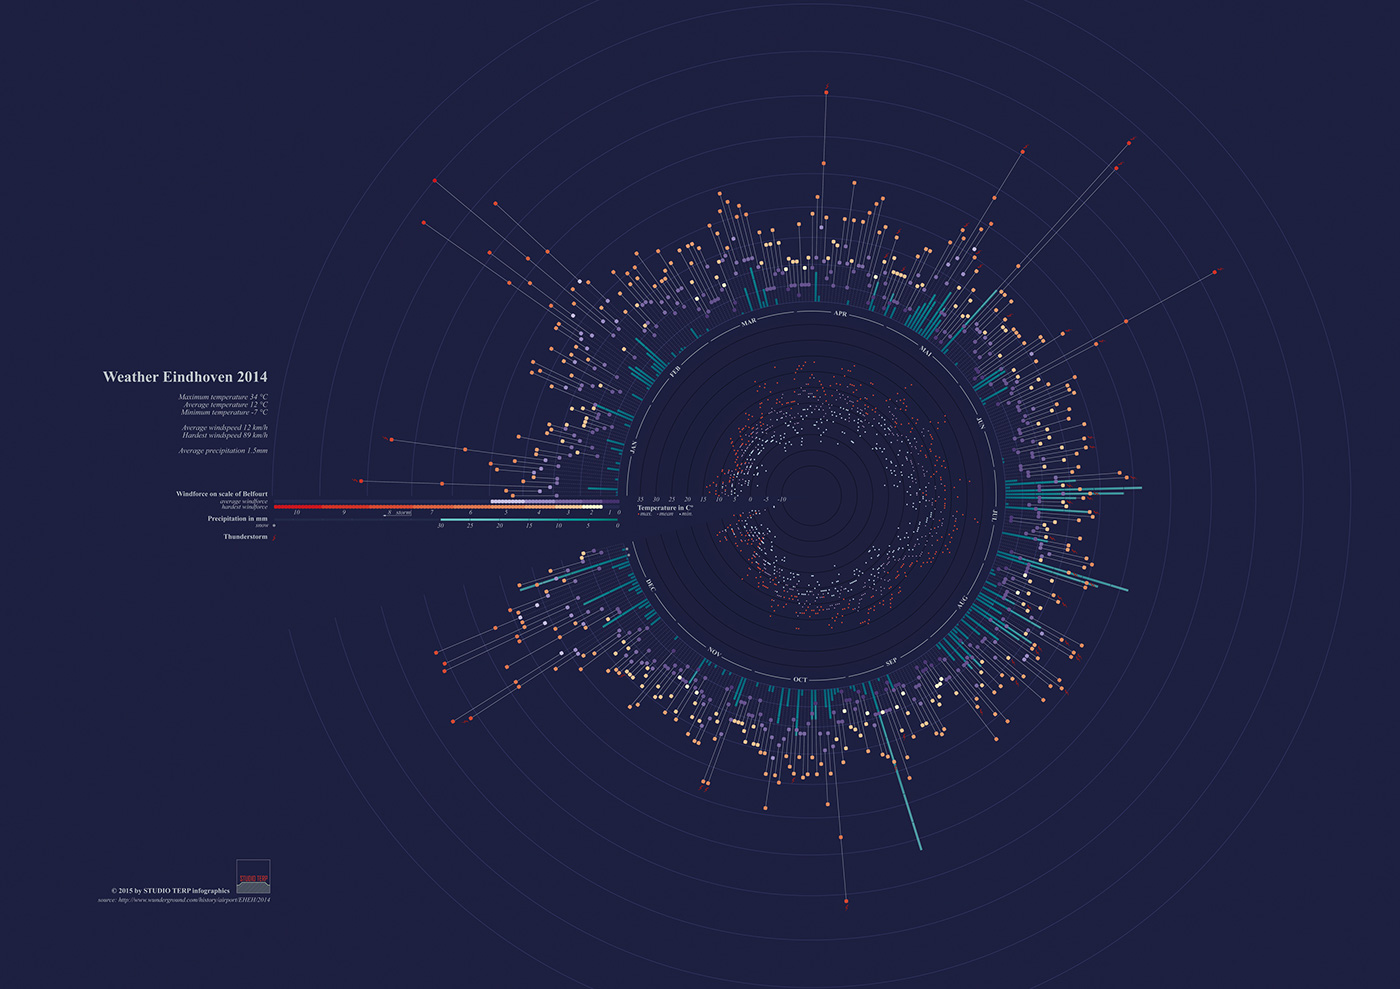
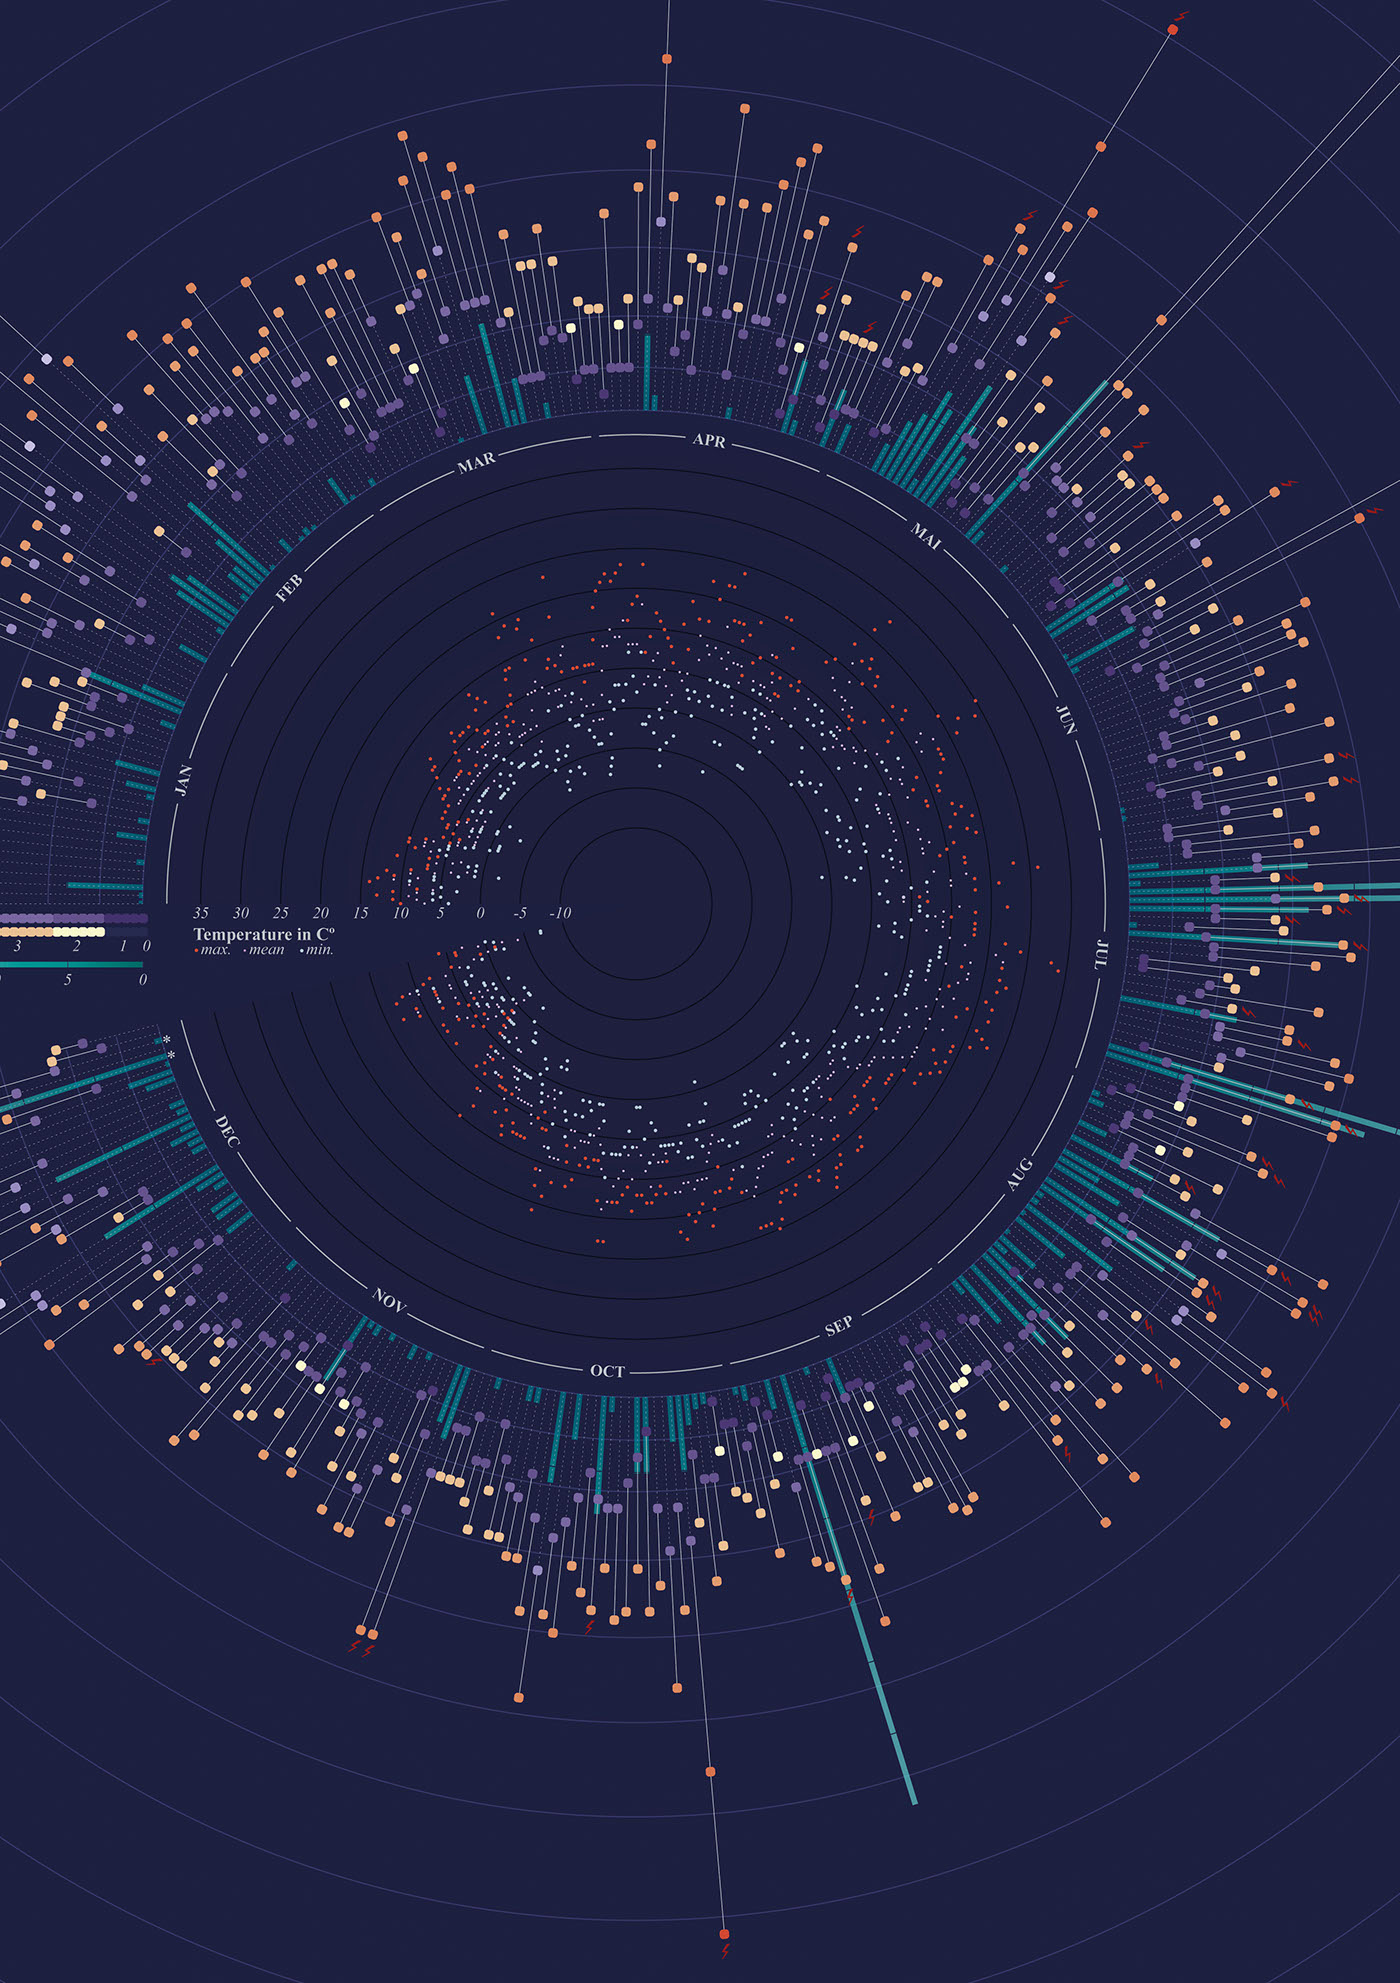
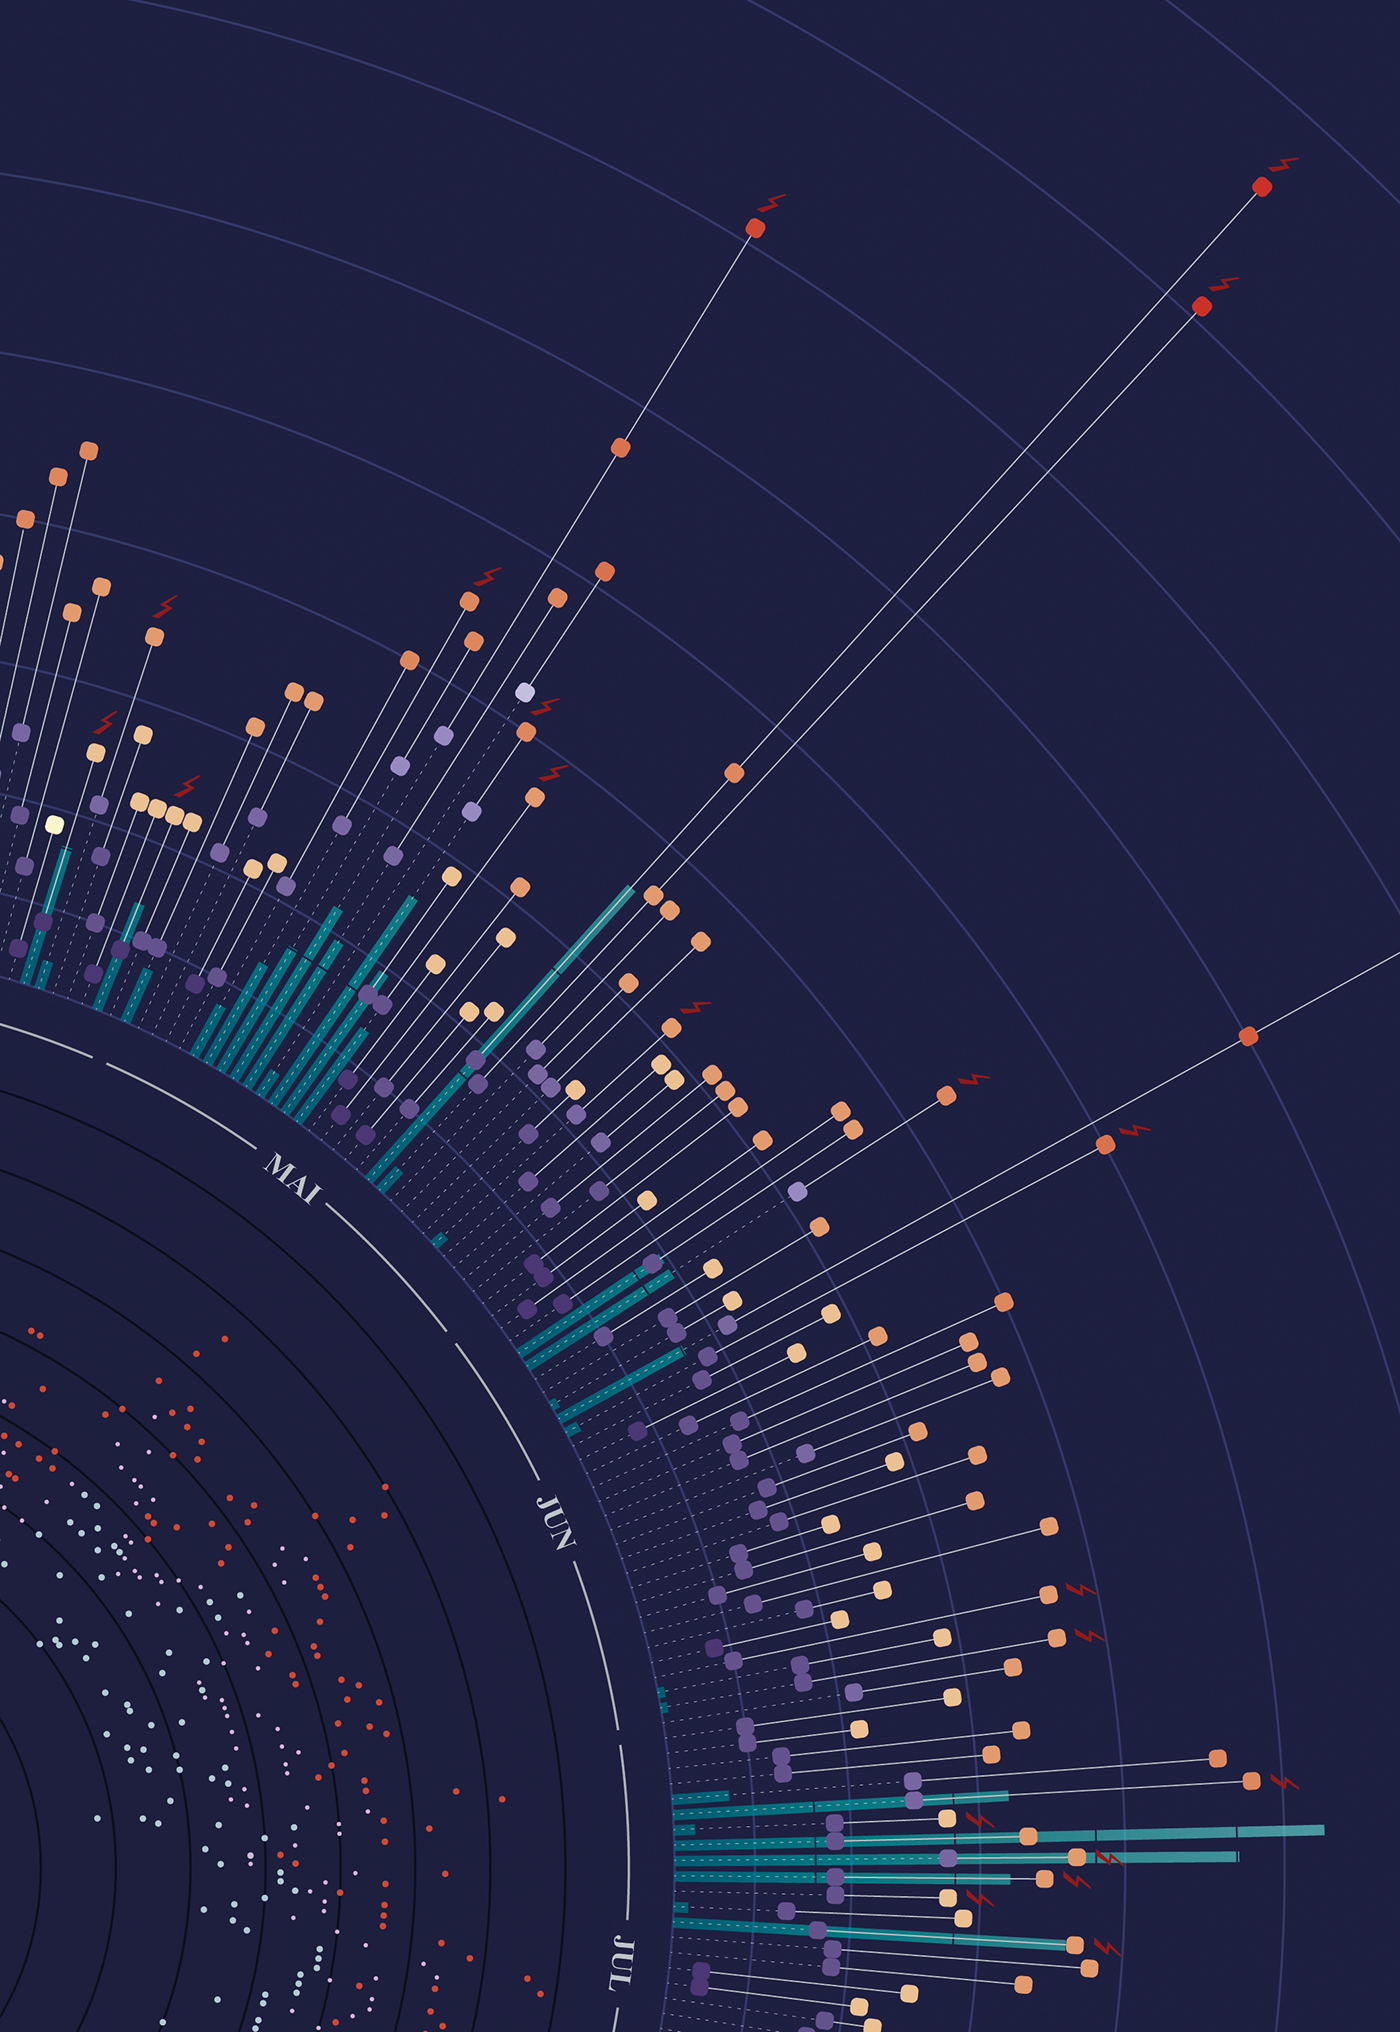
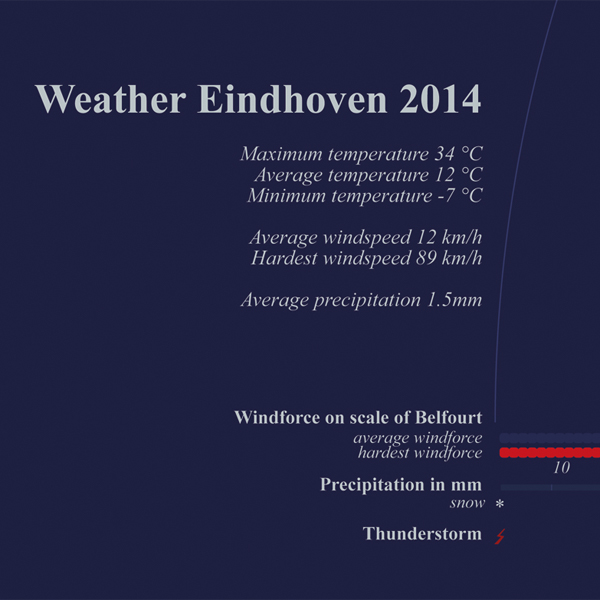
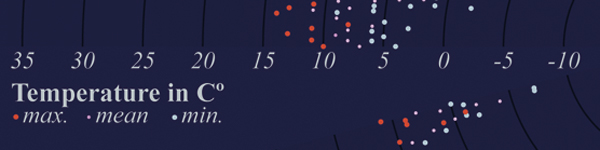
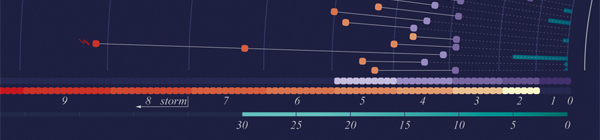
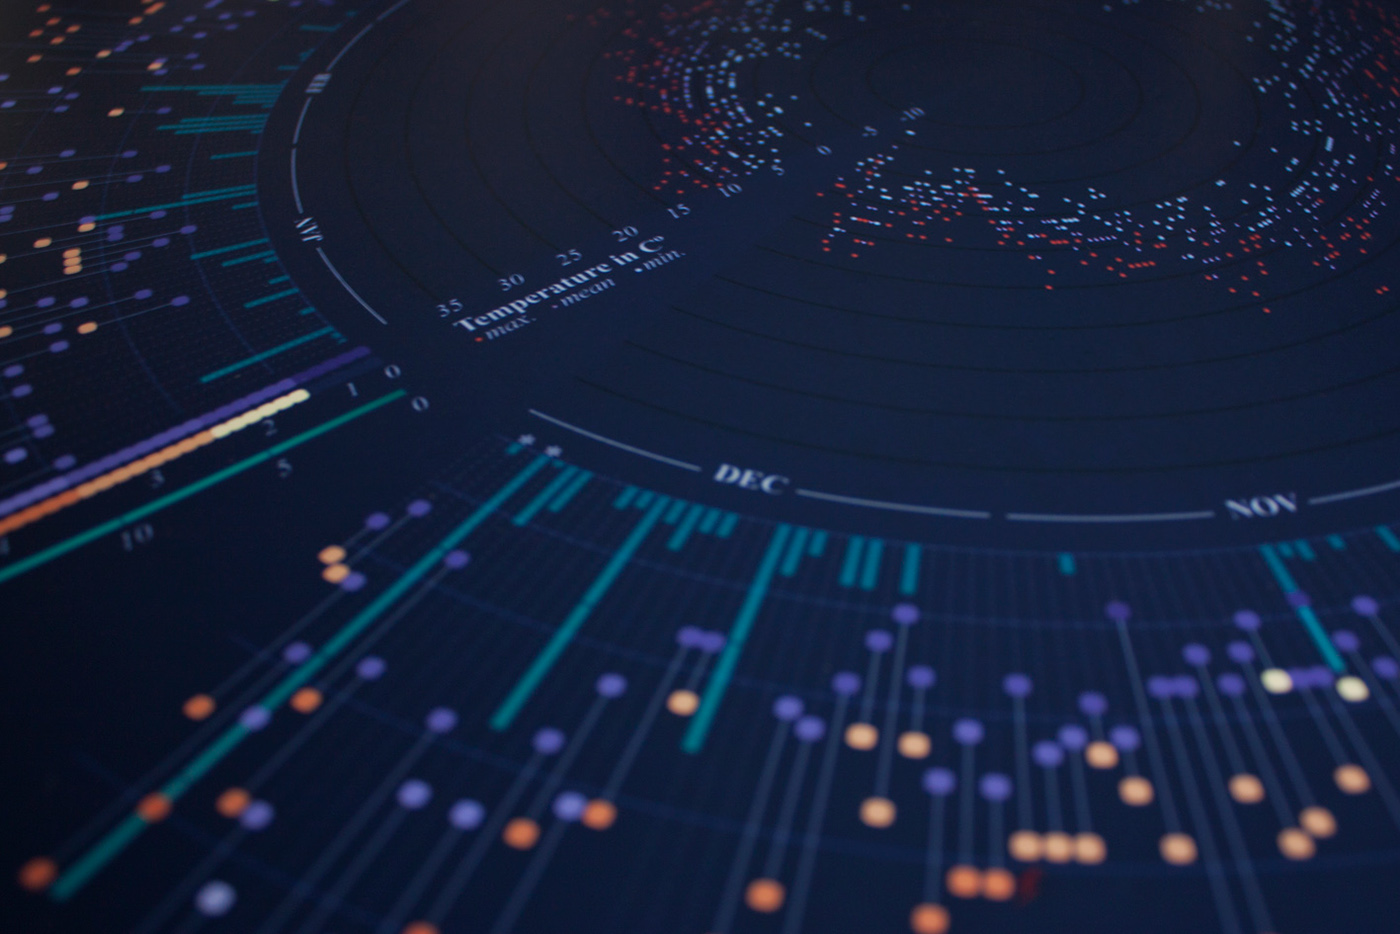
I visualized the data of 2014 of the weather (windforce, precipitation, temperature, thunderstorm) measured in my town Eindhoven.

While you're saving my project to one of your collections, you might as well give me some credit by appreciating, Thanks!
I wrote a short guest-blog on Visualoop on the design-process,
you can read it here
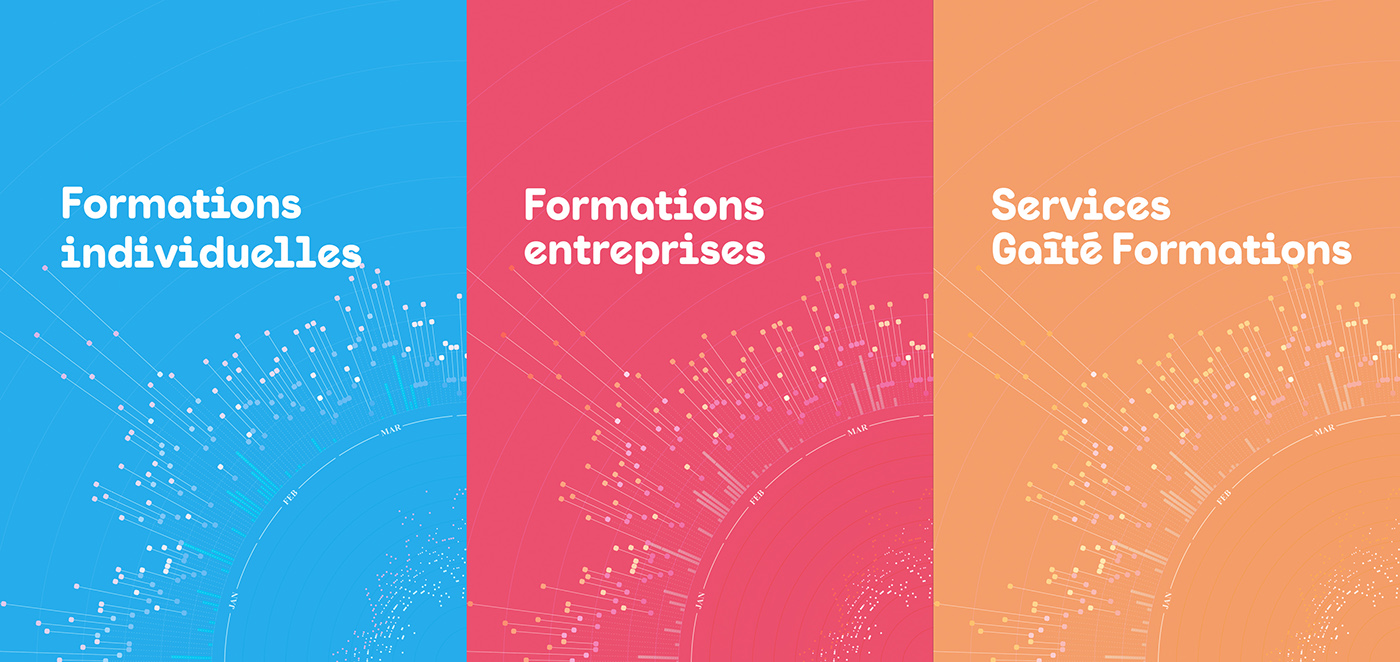
My design was recently used as a cover for the course catalog of La Gaîté Lyrique.
Other colorschemes were used to introduce new chapters:
freaky but cool :-) Which one do you prefer?