The Challenge
Helping Swiss Post to make the annually published study on key figures for the Swiss online market visually accessible on various channels through a microsite that is easy to understand and maintain.

The Outcome
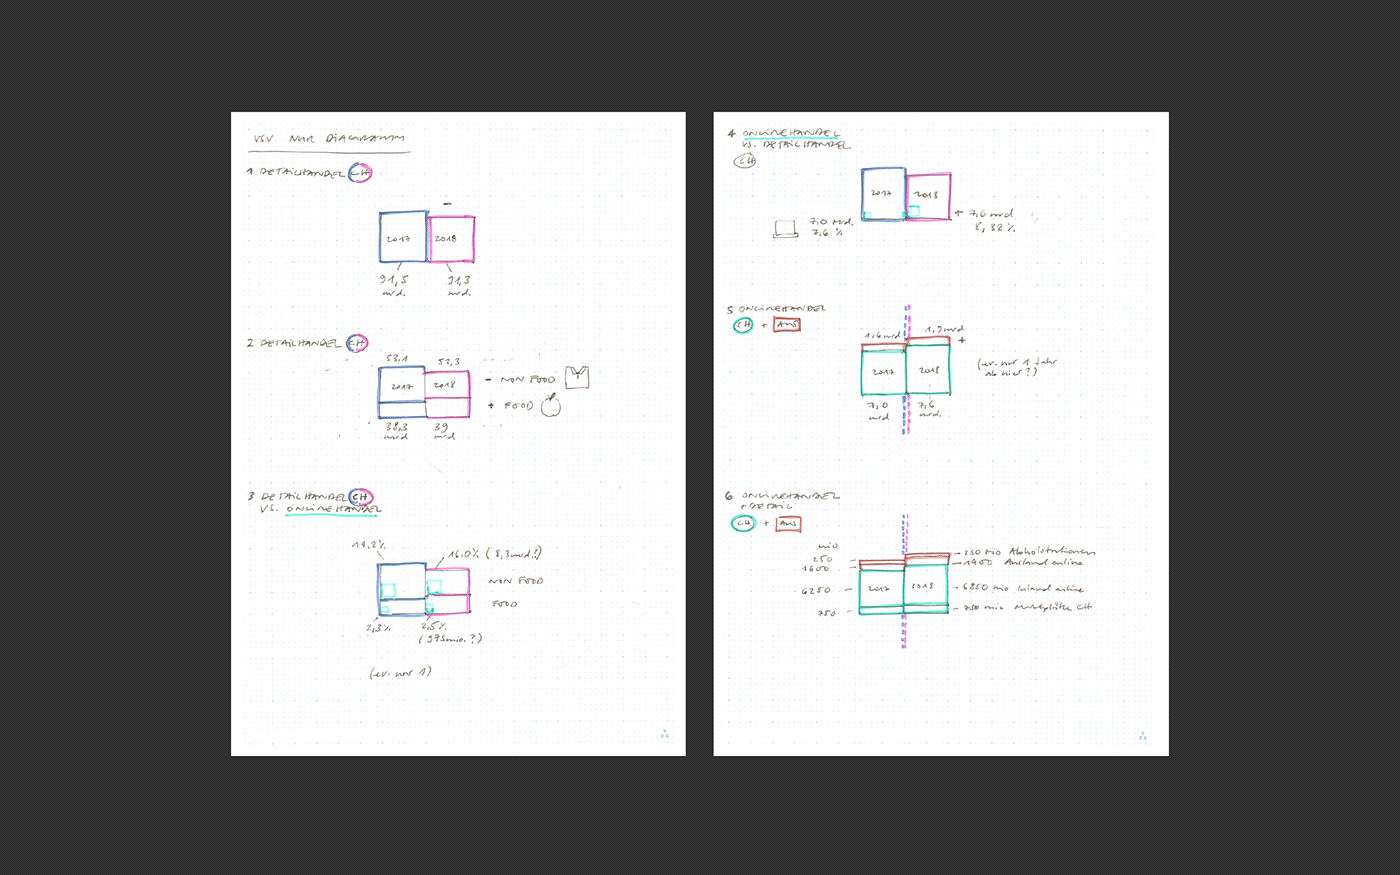
A cross-platform application that uses a single diagram type to tell all key figures with a common thread and enriches the user experience as a real scrollitelling. The content structure is constructed from a bird's eye view and delves more and more into the small details.

The Impact
This microsite shows that scrollitelling is not only a nice and refreshing element, but that it can also provide orientation when visitors are guided through the page in a strict way. A morphing diagram can keep the red thread alive and bring the content relationships closer, piece by piece, without overloading the graphics.