original content published on Superdot.studio
The Challenge
Communicate healthcare trends with data visualization in an annual report. What treatments are most needed by the population? Which hospitals are there and how many treatments do they do per year? What about the specialization of the different hospitals and how are they developing?

The Outcome
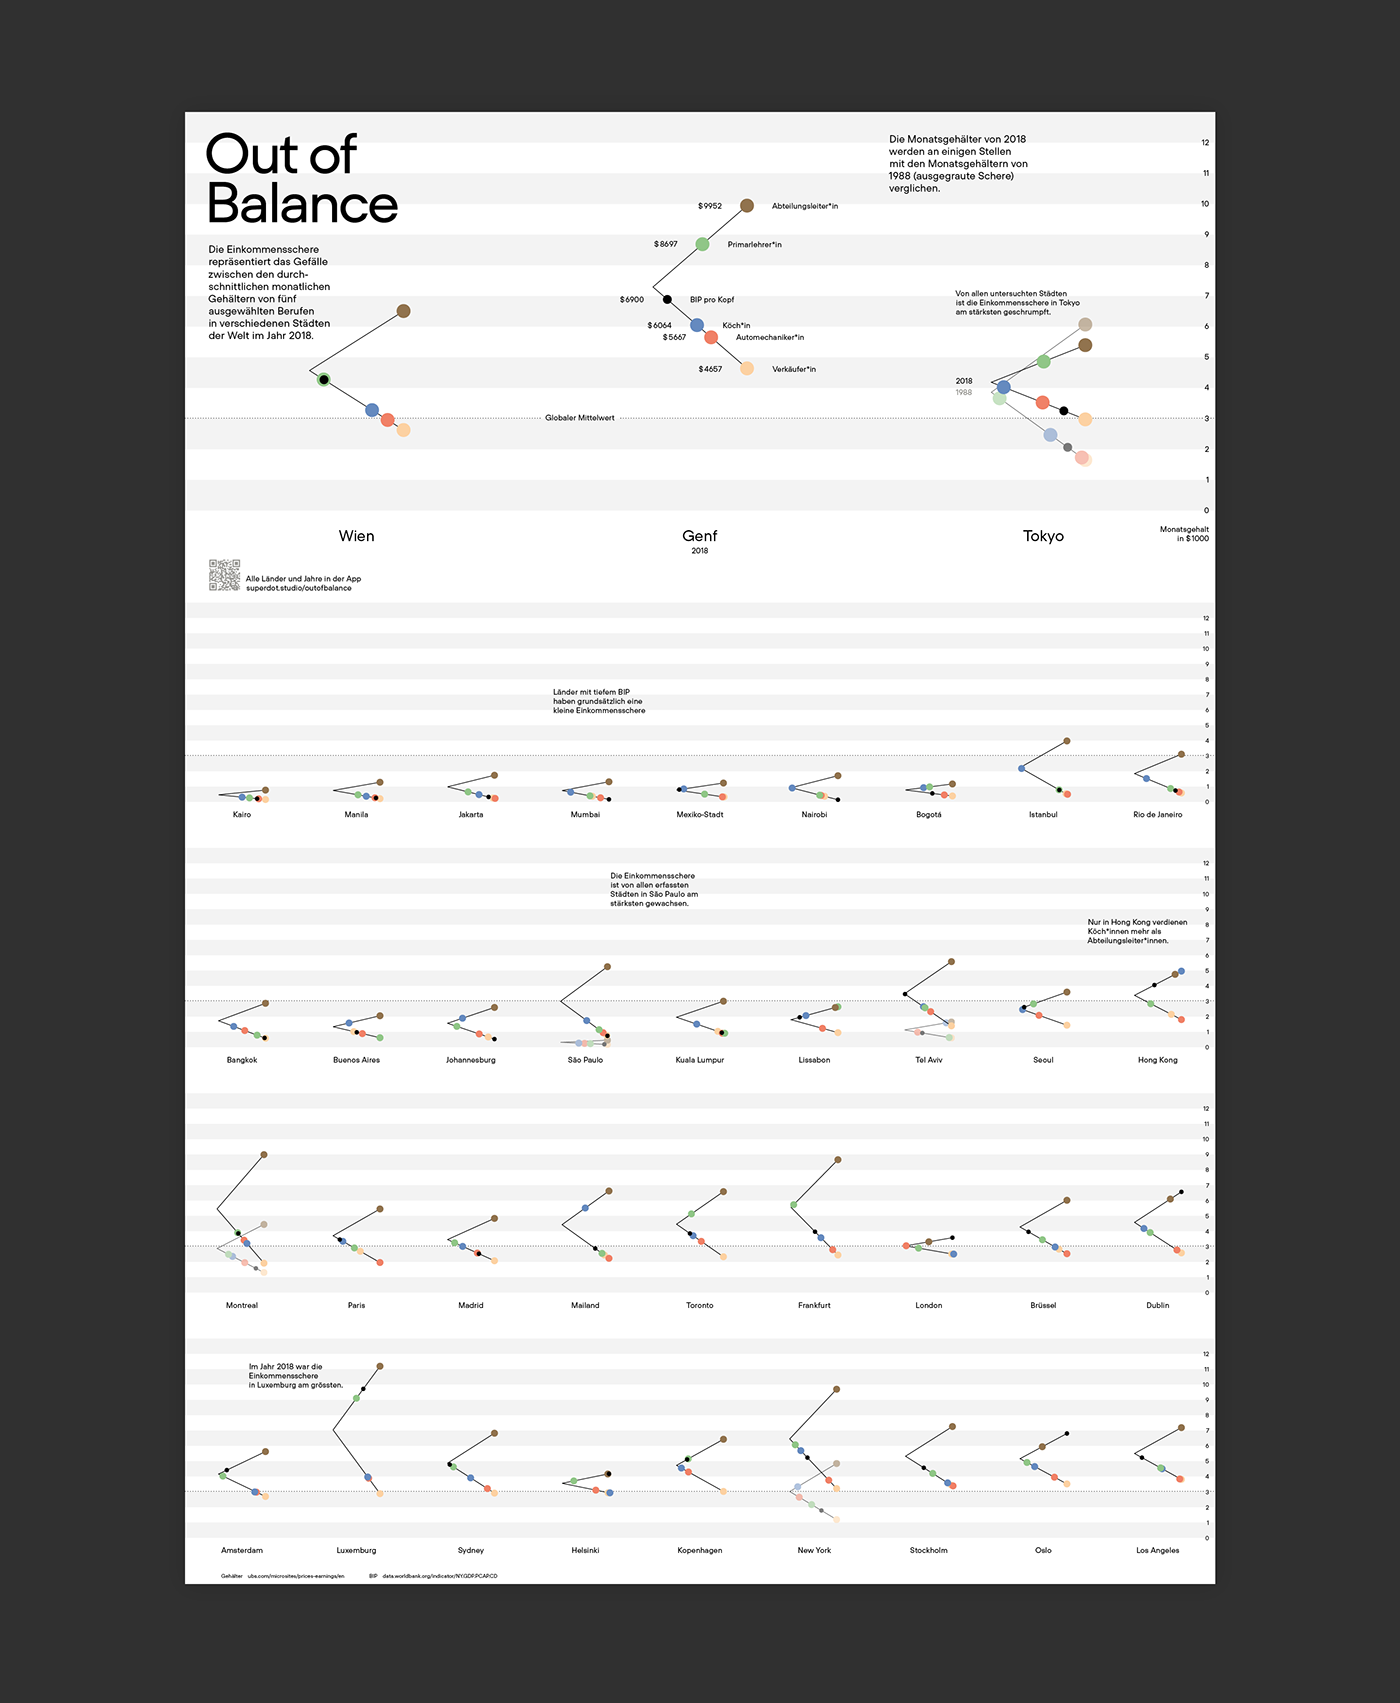
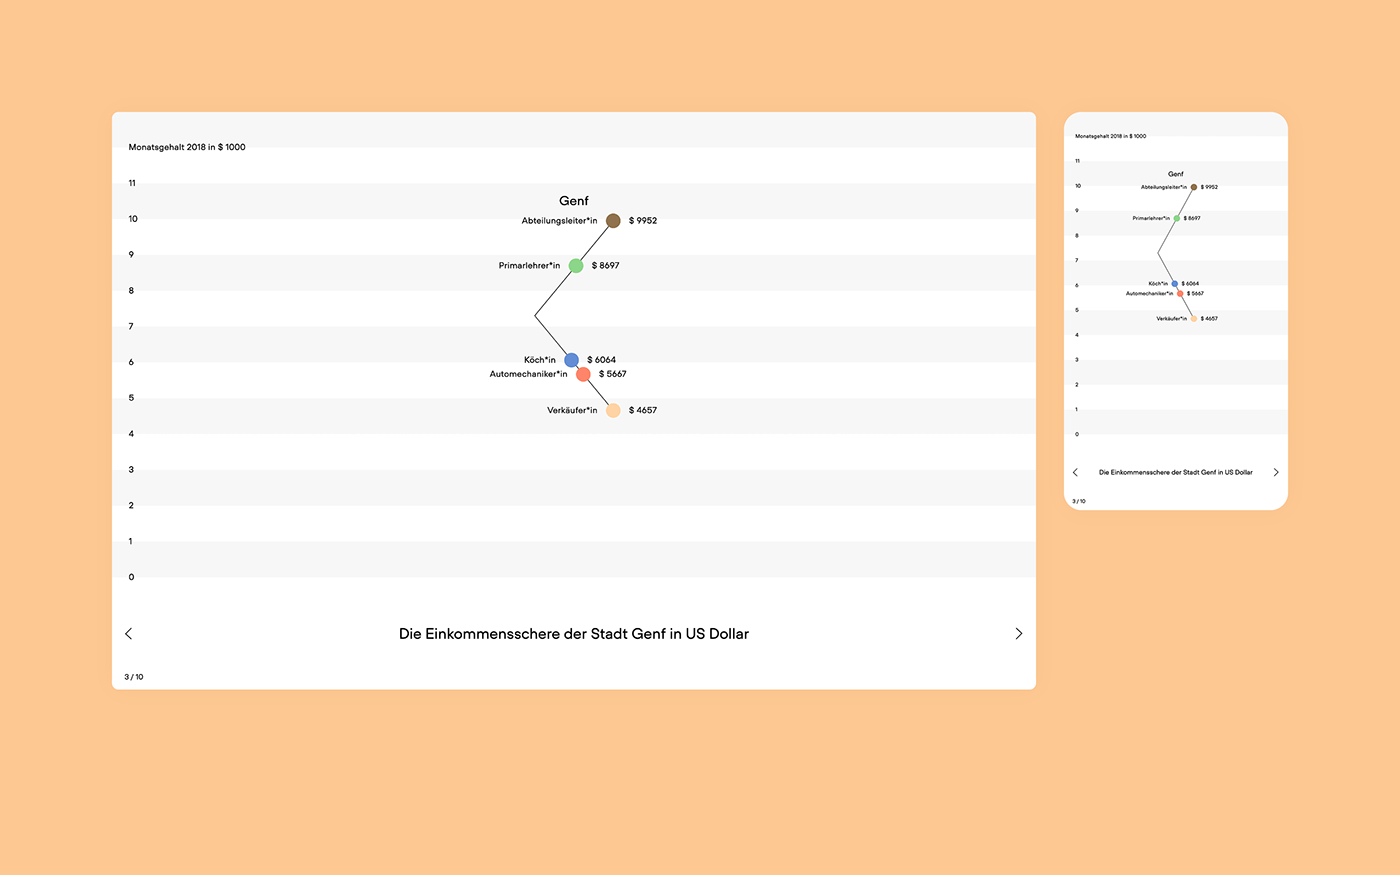
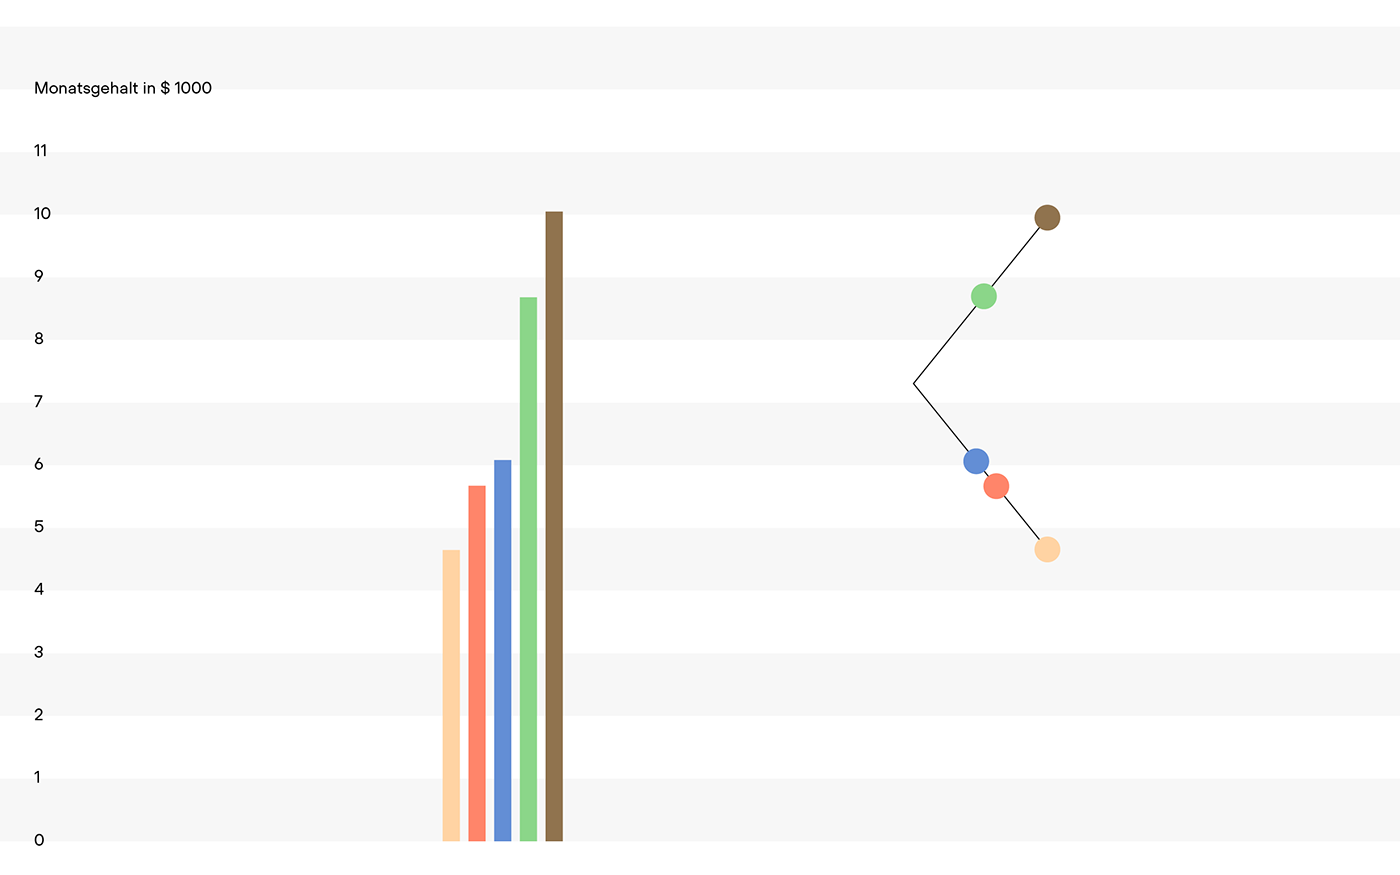
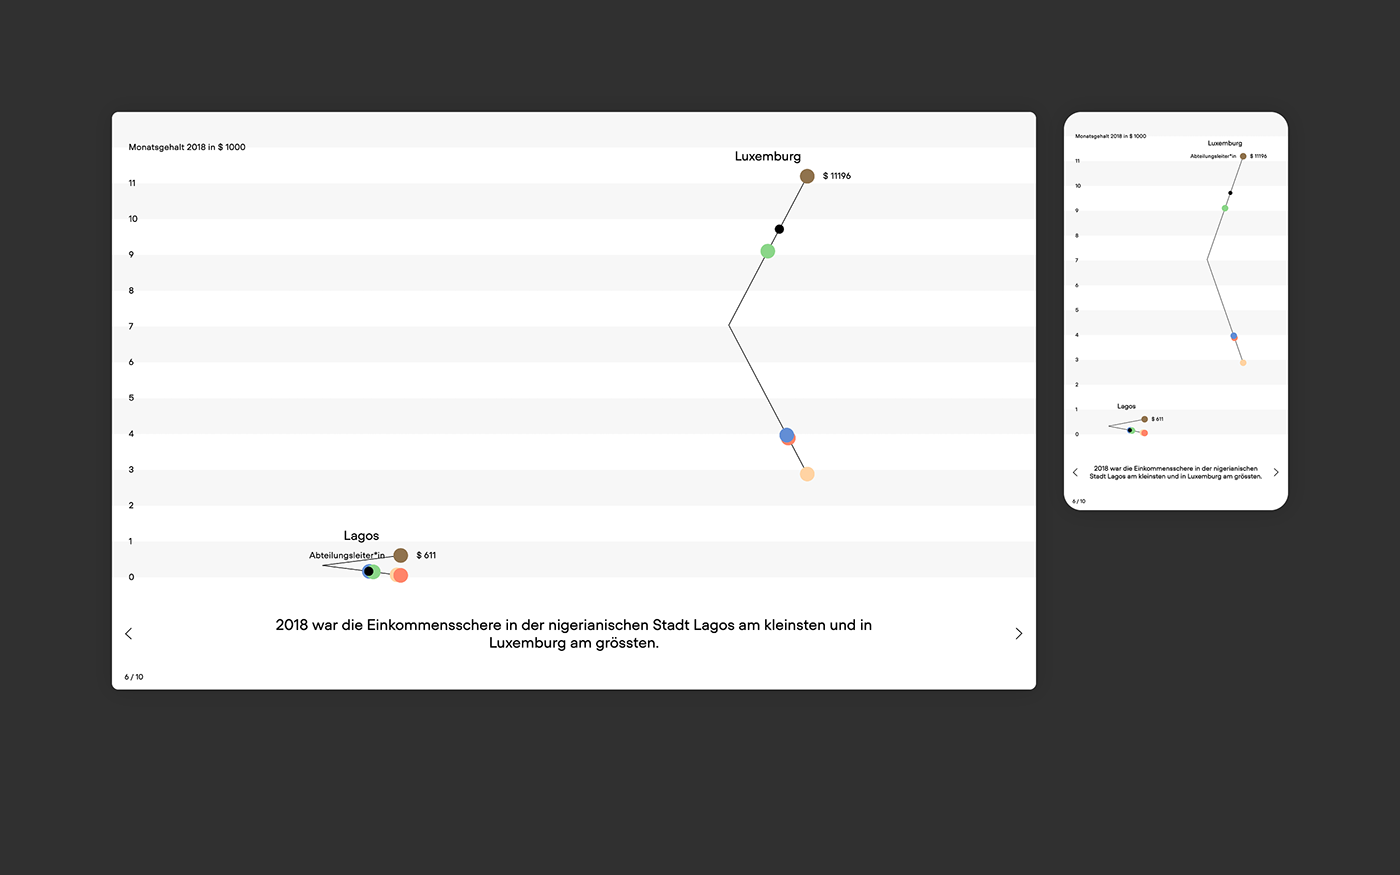
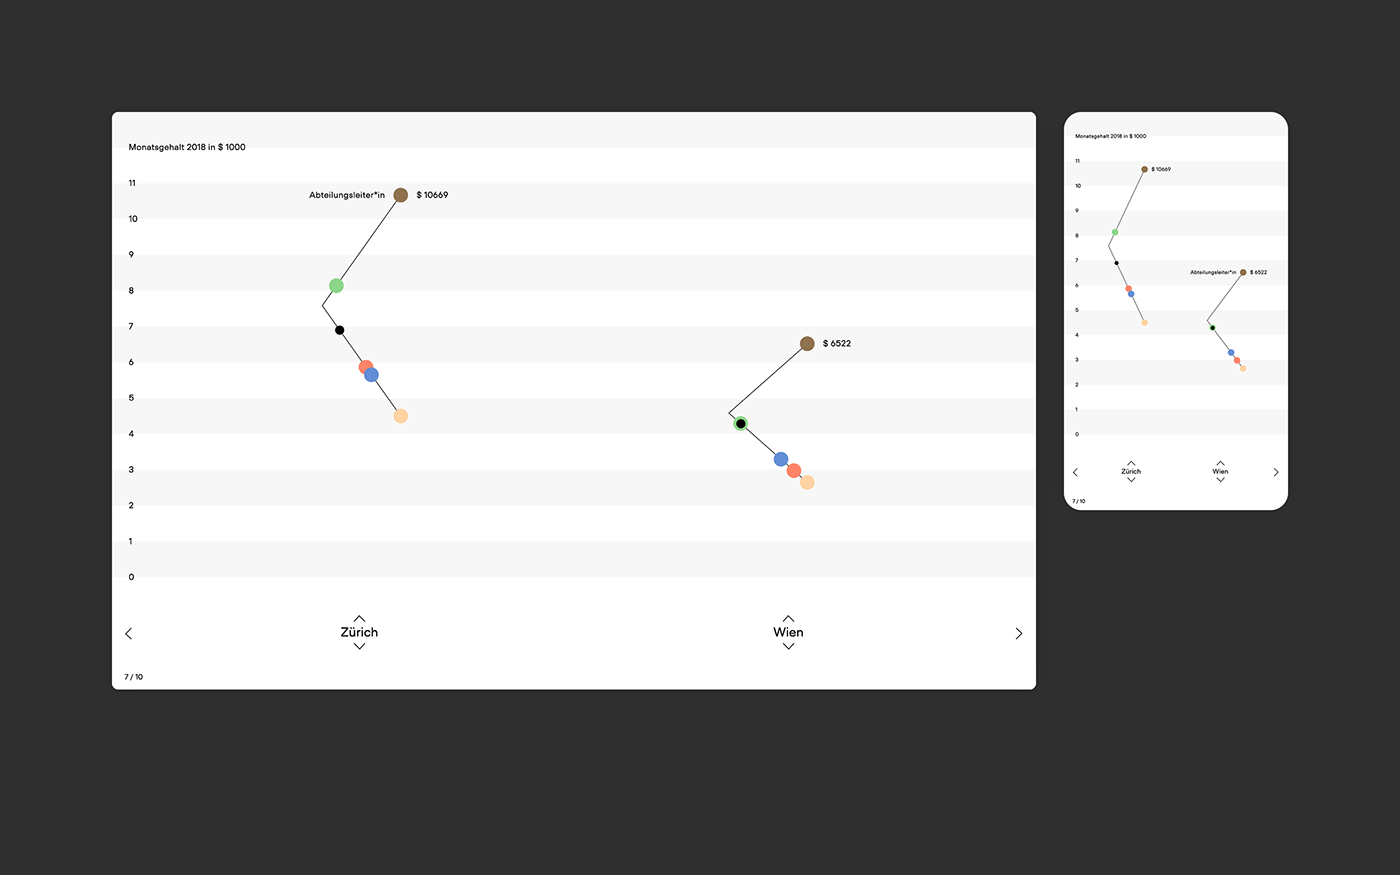
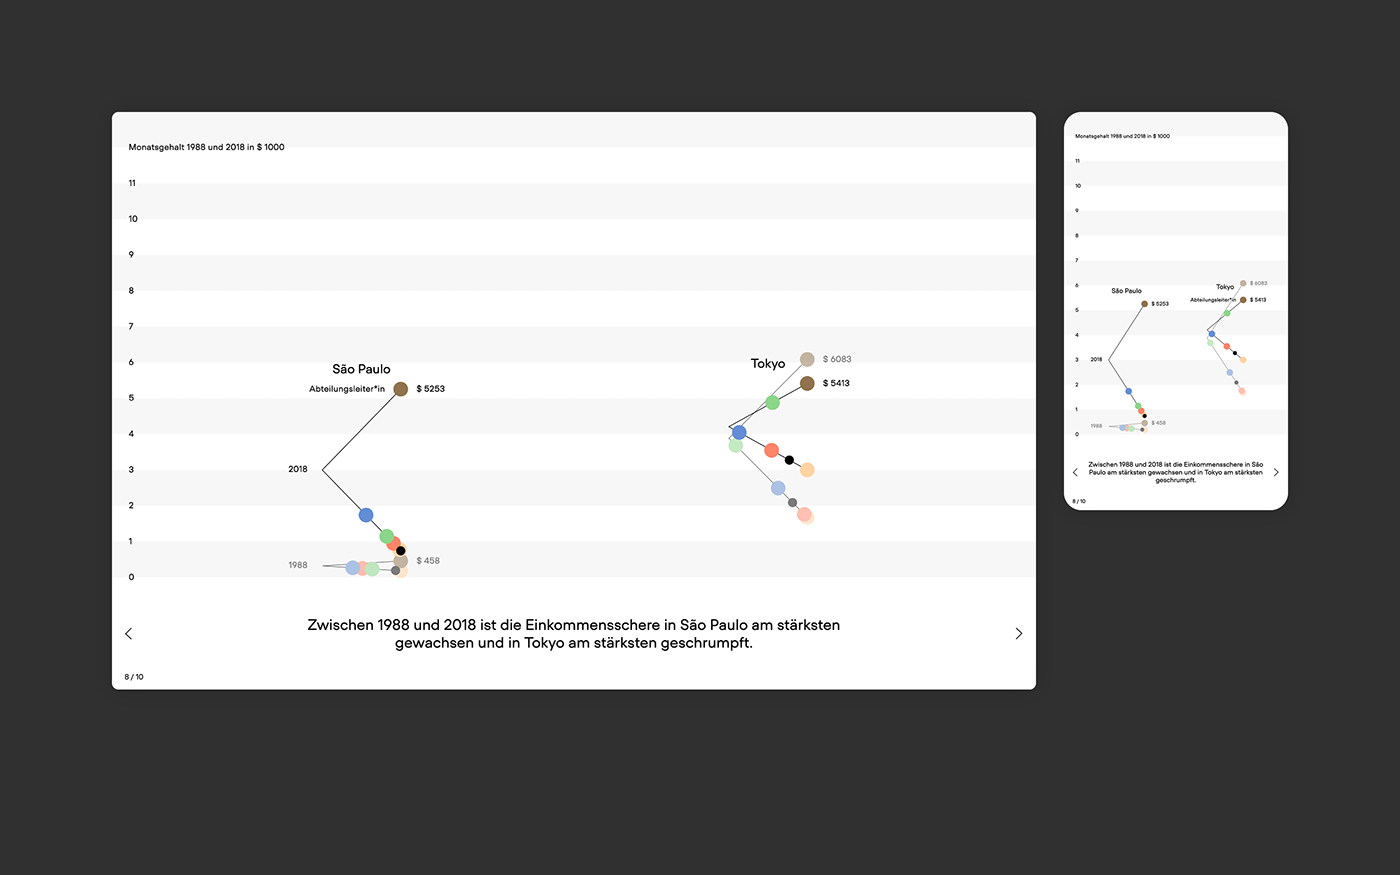
The starting point for the development of an innovative chart type was the German term «income scissors» which is similar to the English term «income gap». The so-called scissor chart now makes income differences in cities intuitively visible. With two poster series and an interactive Data Story, the results can be compared directly.

The Impact
The further development of a very technical and tool-like perception of data towards a narrative presentation method that automatically updates itself led to a change of perspective in scientific communication for all participants.