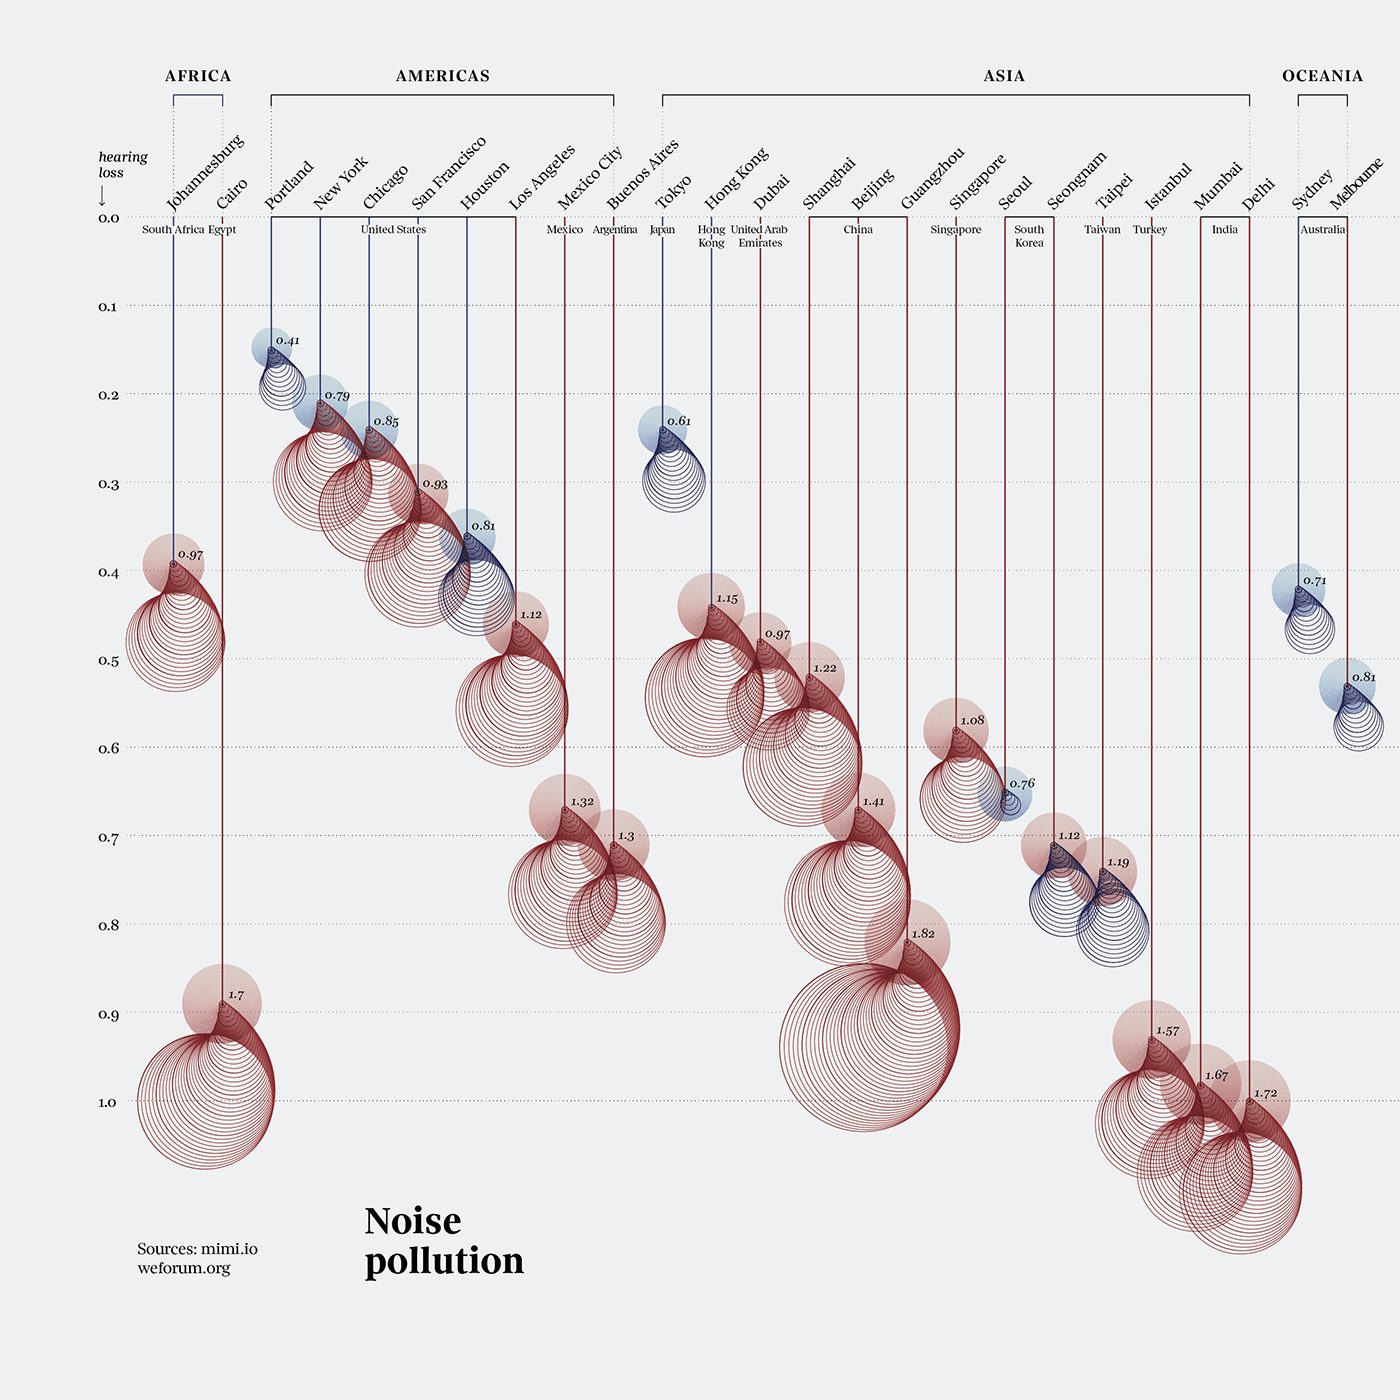
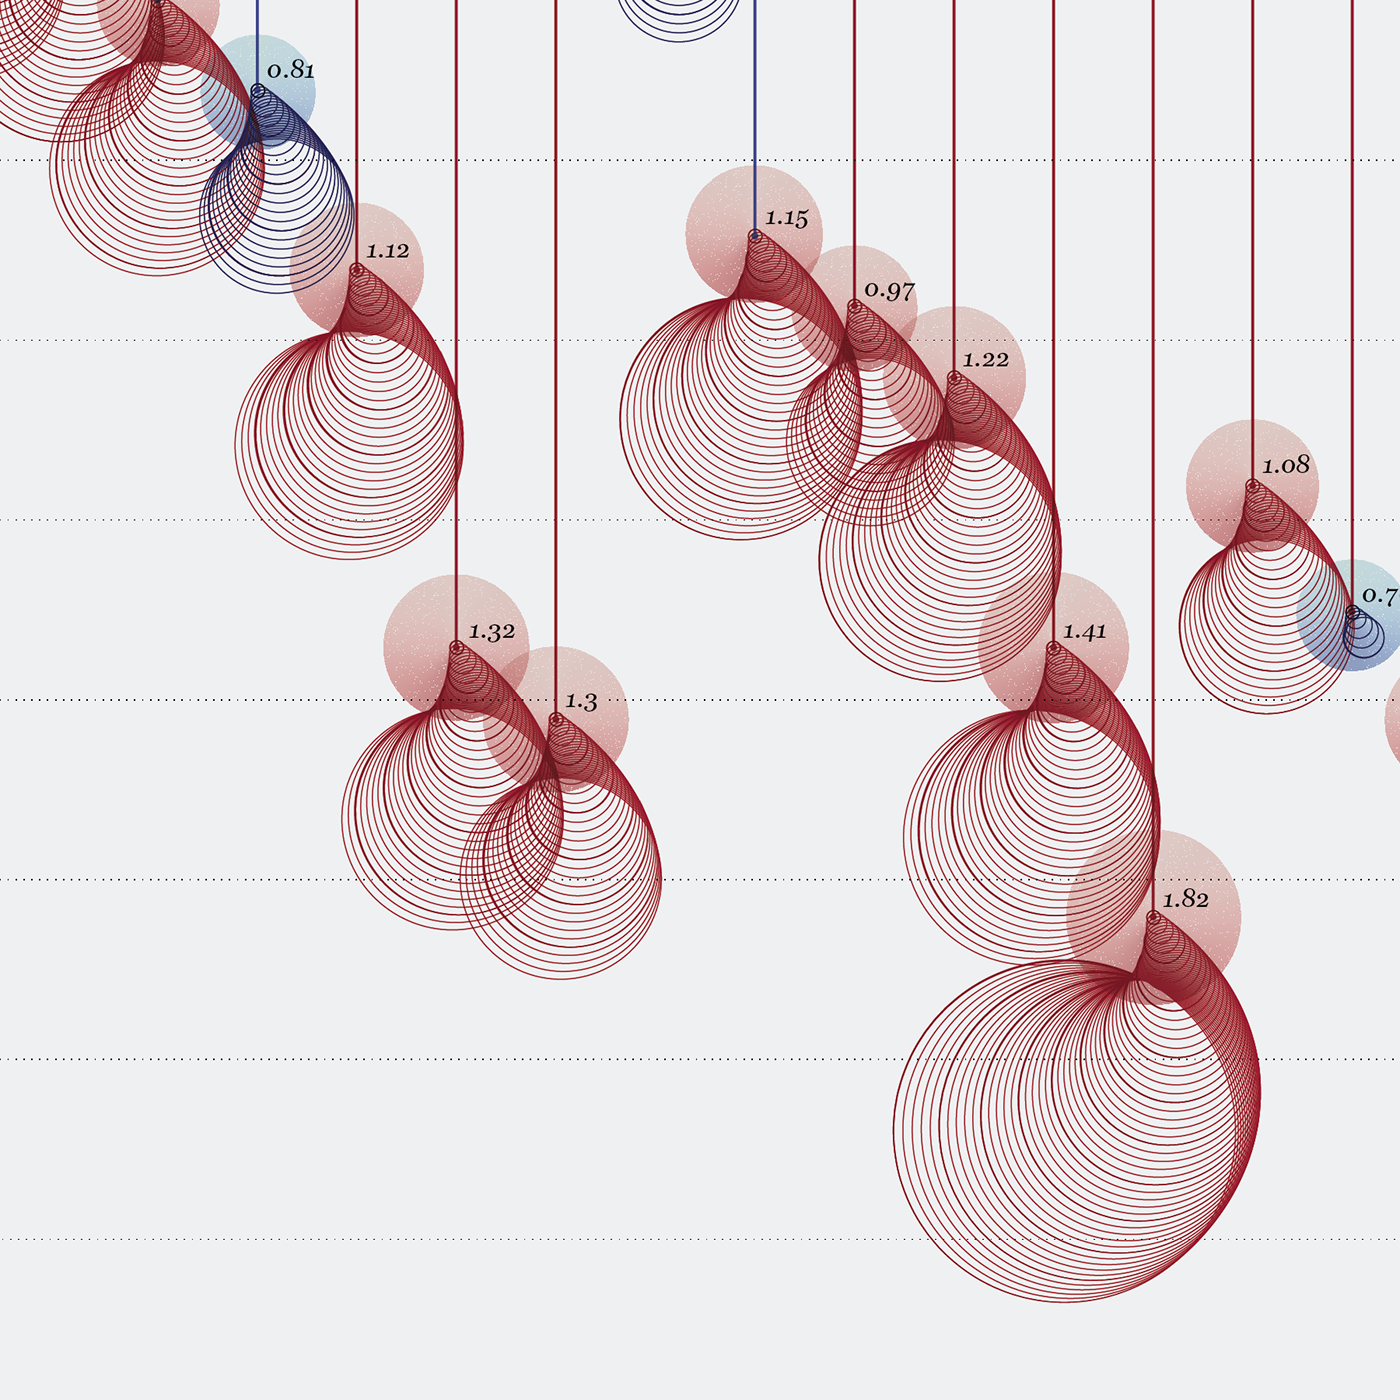
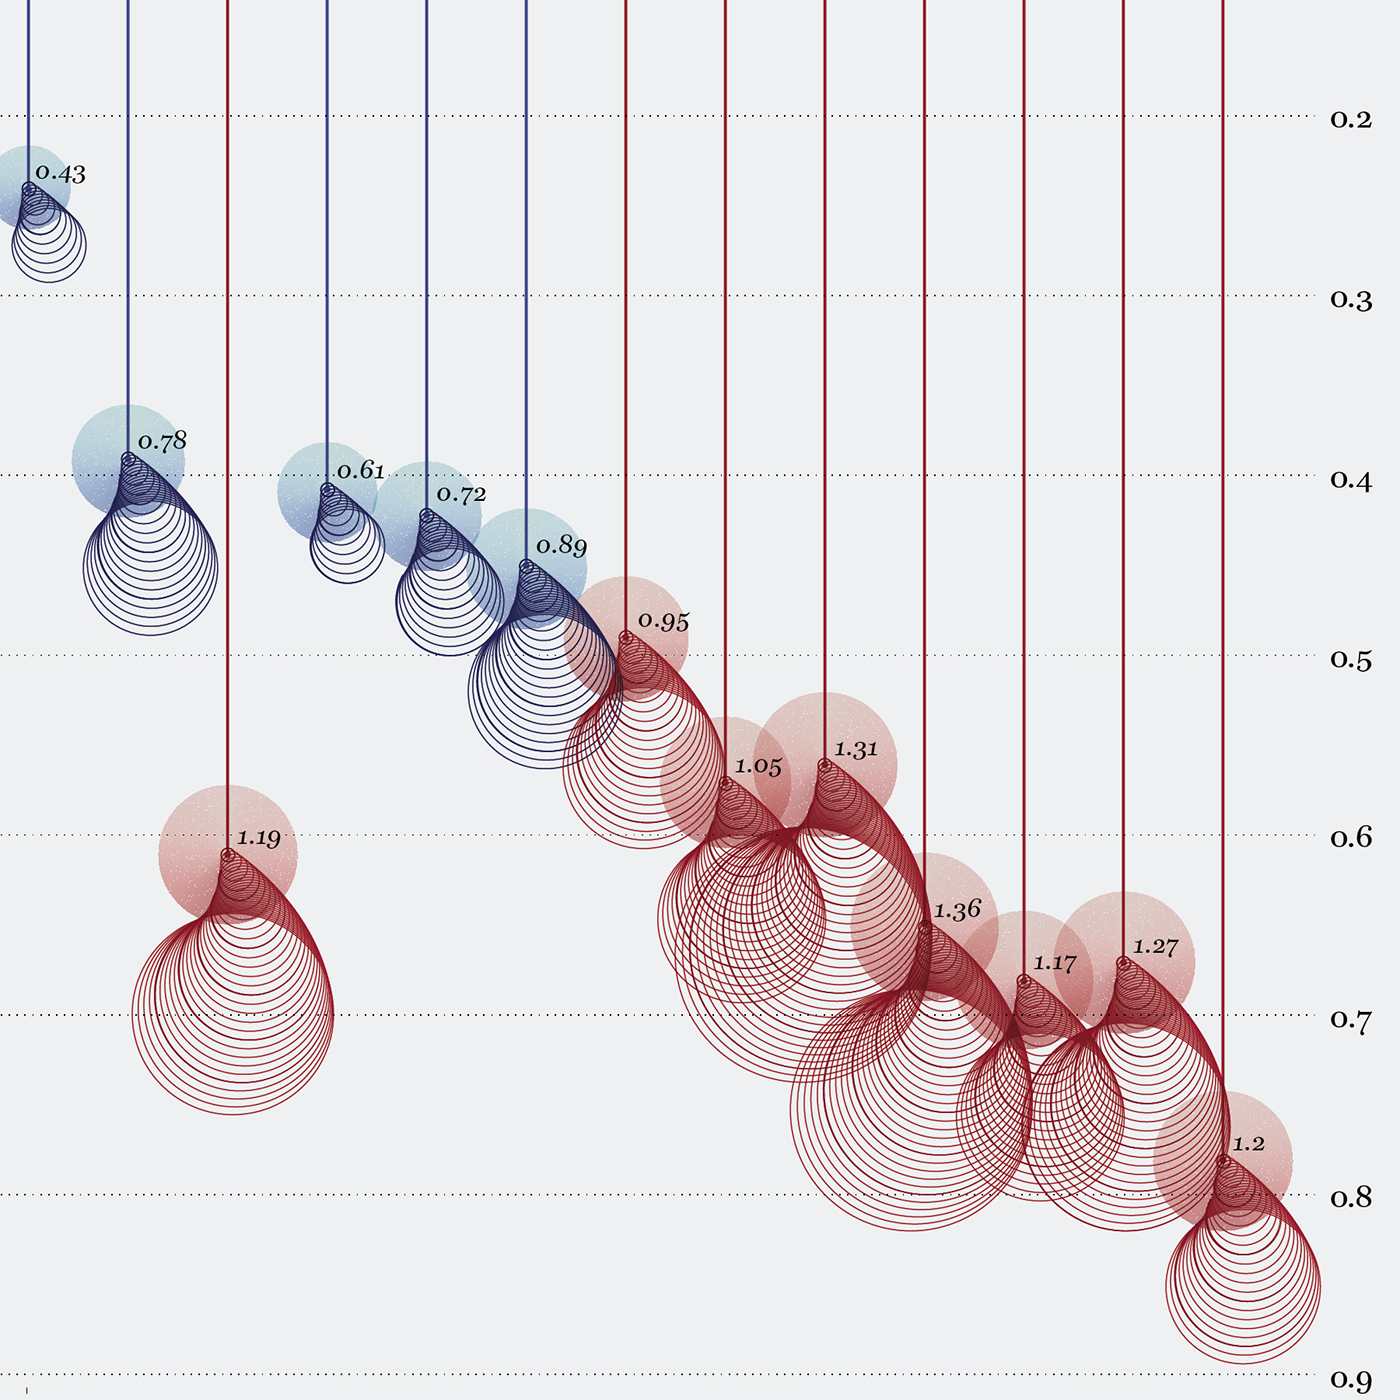
Noise pollution
Corriere della Sera – La Lettura
Artwork for Visual Data, the column on La Lettura, the cultural supplement of Corriere Della Sera.
The visualization shows data on noise pollution and hearing loss in 50 different cities.
A score from 0 (minimum noise pollution and hearing loss) to 1 (maximum noise pollution and hearing loss) is assigned to each city. The World Hearing Loss Index is the sum of these two scores.
Sources: mimi.io; weforum.org
A project by Federica Fragapane
🎐 Instagram: instagram.com/federicafragapane
🔖 Twitter: twitter.com/fedfragapane
T h e v i s u a l i z a t i o n

L e g e n d

D e t a i l s


T h e v i s u a l i z a t i o n

🎐 Instagram: instagram.com/federicafragapane
🔖 Twitter: twitter.com/fedfragapane


