A Walk in the Dark Data Visualization
Personal Work
--
A data visualization exploring six decades of spacewalks and moonwalks.
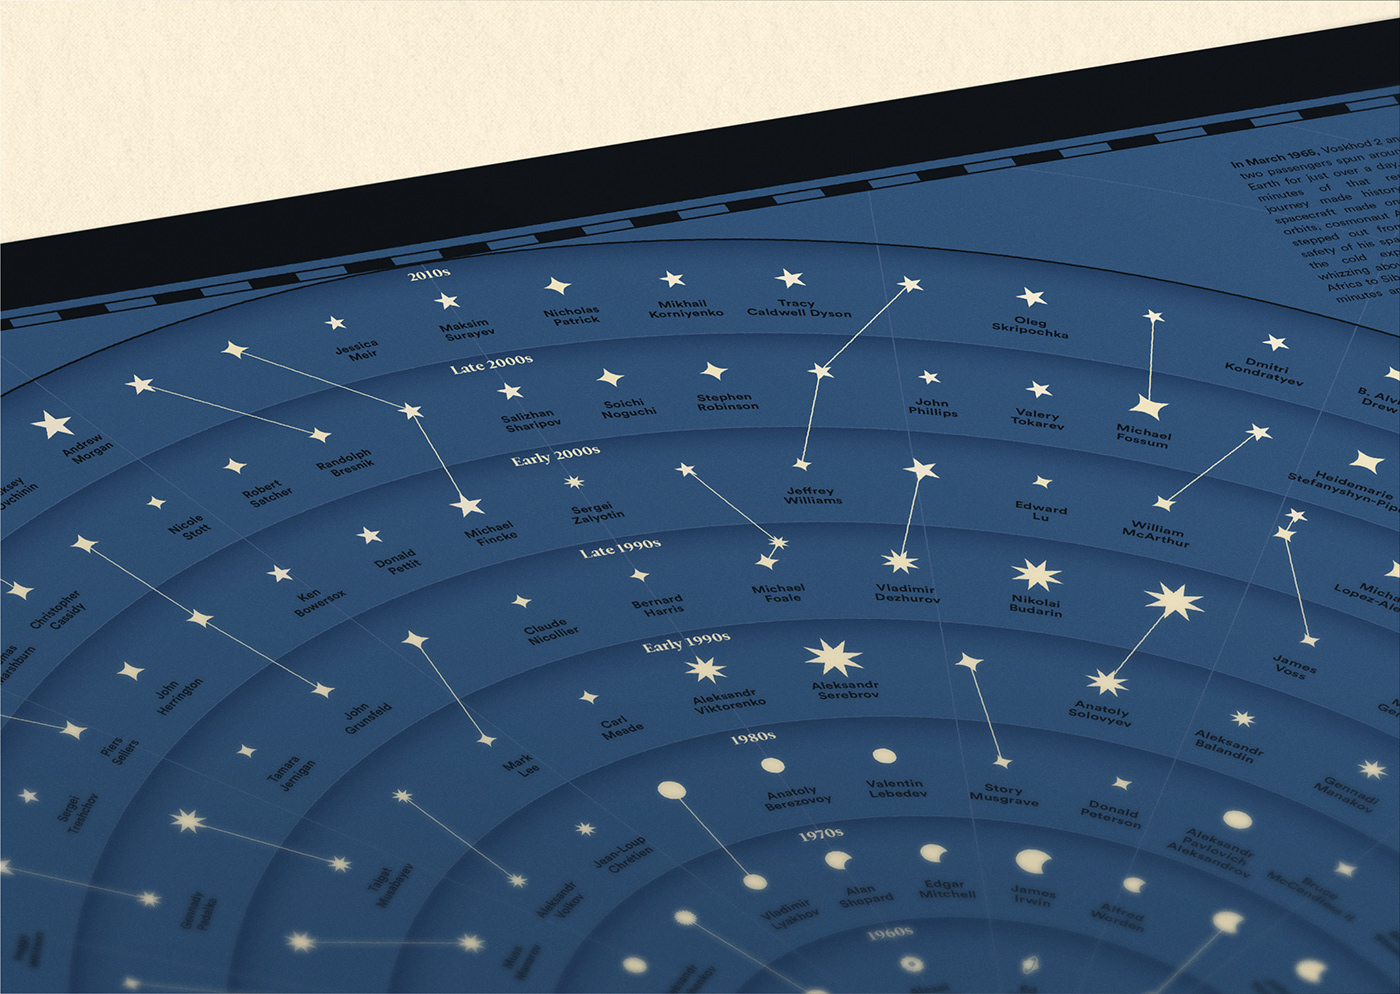
In March 1965, Voskhod 2 and its two passengers spun around the Earth for just over a day. A few minutes of that remarkable journey made history. As the spacecraft made one of its 17 orbits, cosmonaut Alexei Leonov stepped out from the relative safety of his spacecraft and into the cold expanse of space, whizzing above our planet from Africa to Siberia in a little over 12 minutes and becoming the first person to ever embark on an extravehicular activity (EVA).
Six decades later, EVAs are more commonplace but no less impressive. In October 2019, Jessica Meir became the 232nd person to brave open space – a pioneer in her own right as part of the first all female EVA, working alongside Christina Koch to repair batteries on the ISS, and preserve the future of humanity’s first permanent residence off Earth.
This data visualization, in a similar structure to a constellation chart, maps every person who has ever embarked on a spacewalk or moonwalk. I wanted the design to be in a vintage style, conjuring the timeless majesty of space, and conveying a sense of the ambition and enthusiasm around space travel that existed during the time of the moon landing and Apollo missions.
You can see a high res version of the data viz here.