This datavisualization illustrates the average income and outcome of a belgian citizen
The blue datavisualization shows the different types of revenues of a belgian citizen
The green datavisualization shows the different types of expenses of a belgian citizen.
The yellow figure shows the difference between revenues and expenses : the savings
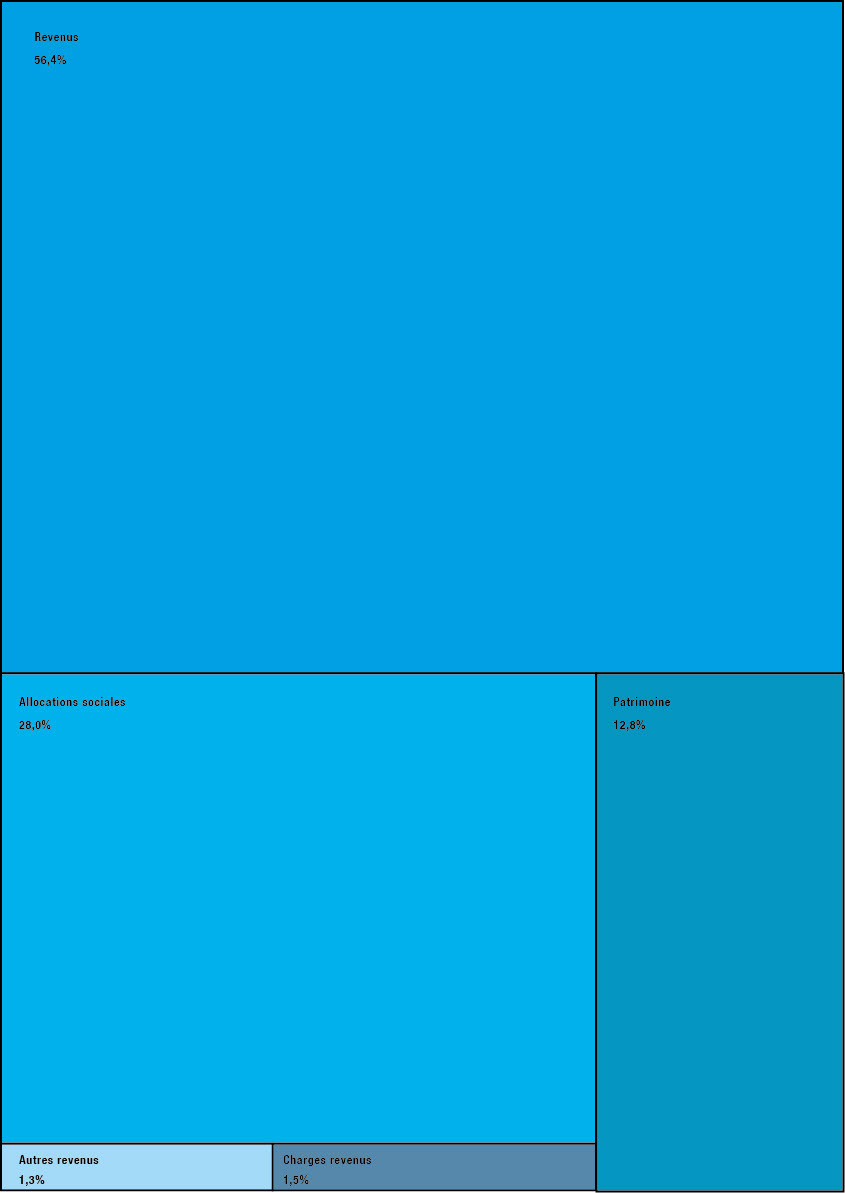
Revenus moyens d'un citoyen belge
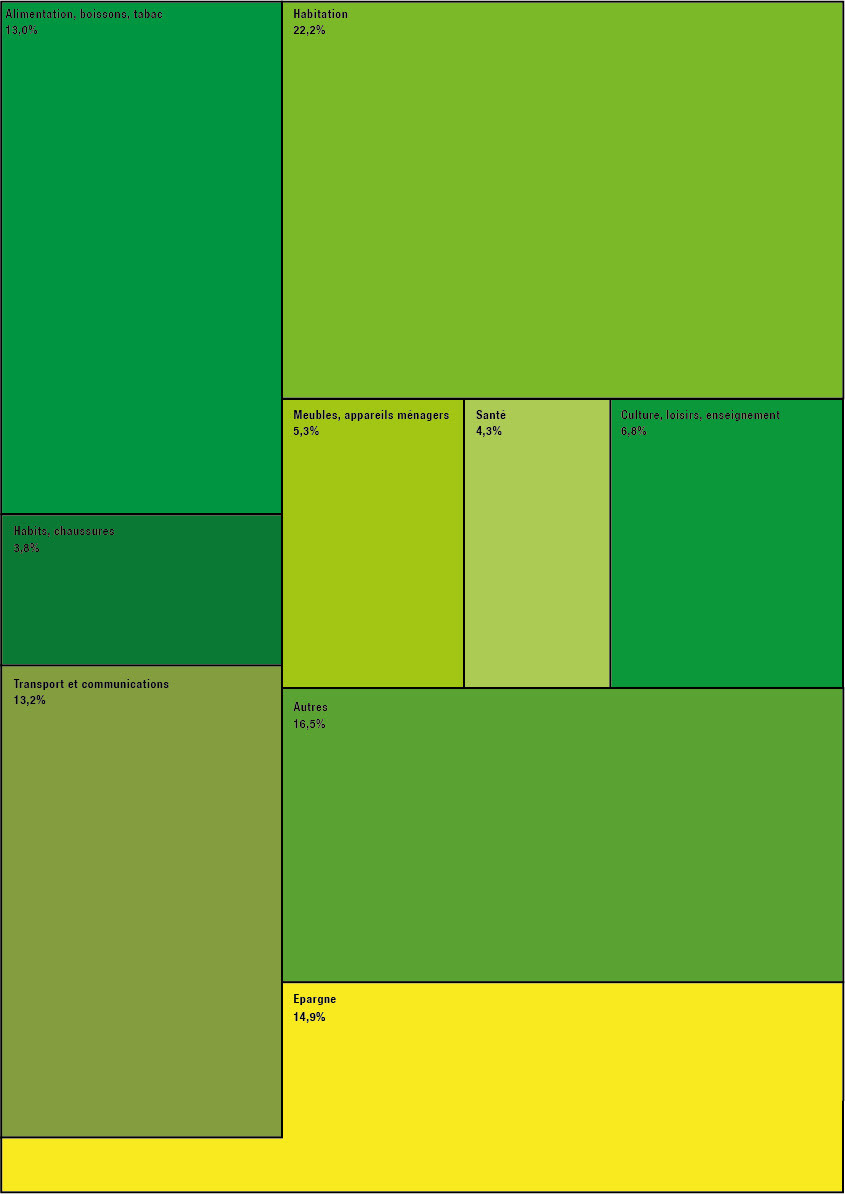
Dépenses moyennes d'un citoyen belge

