Reconstructing the News: Drunk Drive
Brief:
For this brief I was asked to create a feature article that fills a large double page spread, for a publication that focuses on communicating a specific news back-story to a readership. Data visualisation and diagrammatic display need to play a key role in explaining, clarifying complex matters to a reader. The visualisations need to be integrated in an editorial design context.

Concept:
When choosing my topic I wanted to focus on something that has always been argued within the media. Since I have been driving I have had to think about the precautions of drink driving but also had to worry about others drink driving. I wanted my data and article to show how many accidents there were in the UK.
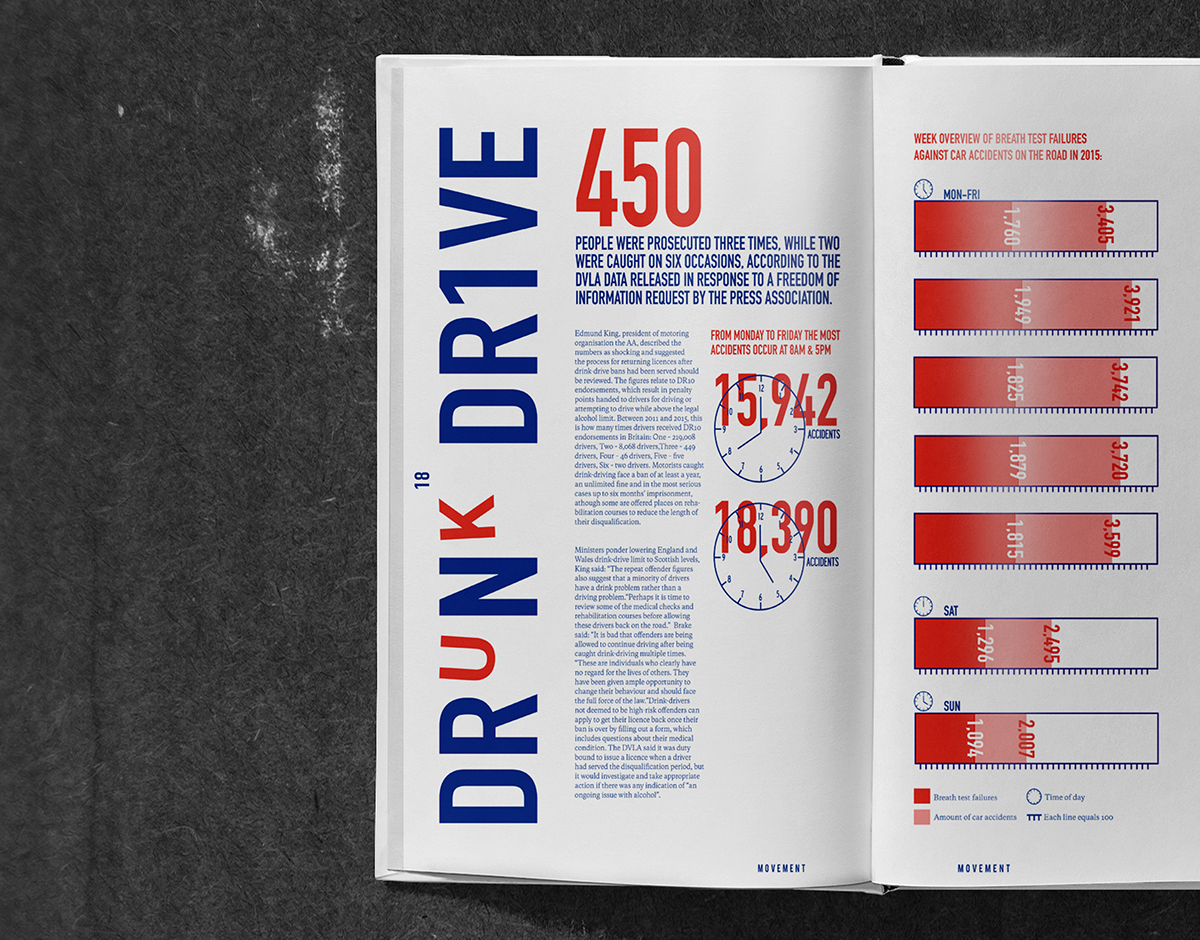
Simplistic ways of visualising data throughout the spread to provide a larger target audience. My data shows how many accidents happen within the days of the week against the secondary data providing evidence of when the most accidents occur and how many breath test failures there were against the car accidents in 2015.
Designed to be printed on a riso printer.

