A study on the usage of Barcelona's Bicing service, a network of stations spread through thecity where users can pick and park bicycles.
Data source:
Bicing's official website provides a JavaScript map with information of the current status of the network in real time.Available information includes each station's geoposition, name, available parkings and parked bicycles.
First, a parsing script was left being run for some hours, scrapping data every minute.
Afterwards, another script reads the whole set of data and represents it interactively.
Project description:
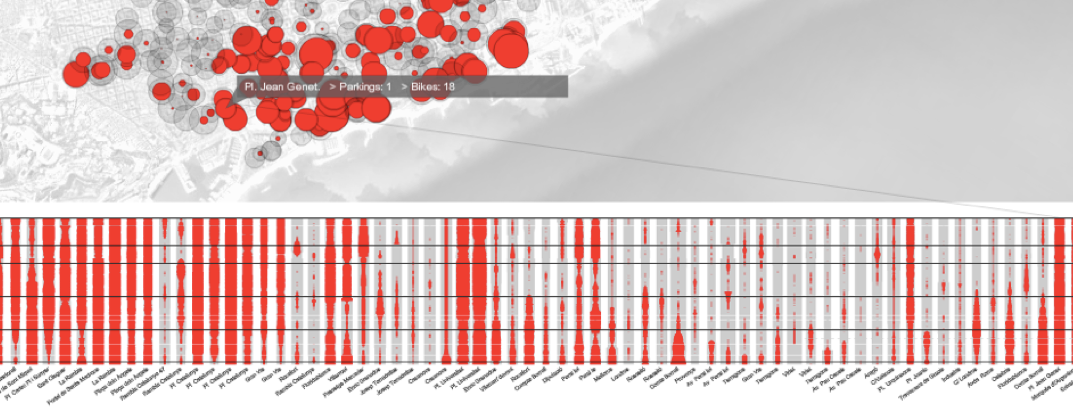
Stations are represented as dots on a map. A grey area shows the available parking slots, the red one the parked bicycles.Underneath, stations are also represented by vertical histograms, showing the evolution of parking/bike-availabilty through time.Using the keyboard's UP and DOWN keys, users can refresh the map plotting for different times.
Data source:
Bicing's official website provides a JavaScript map with information of the current status of the network in real time.Available information includes each station's geoposition, name, available parkings and parked bicycles.
First, a parsing script was left being run for some hours, scrapping data every minute.
Afterwards, another script reads the whole set of data and represents it interactively.
Project description:
Stations are represented as dots on a map. A grey area shows the available parking slots, the red one the parked bicycles.Underneath, stations are also represented by vertical histograms, showing the evolution of parking/bike-availabilty through time.Using the keyboard's UP and DOWN keys, users can refresh the map plotting for different times.
A different visualization shows each station represented as overlapping rings, where radial position represents time evolution, and ring thickness represents volume of bikes and parking slots.