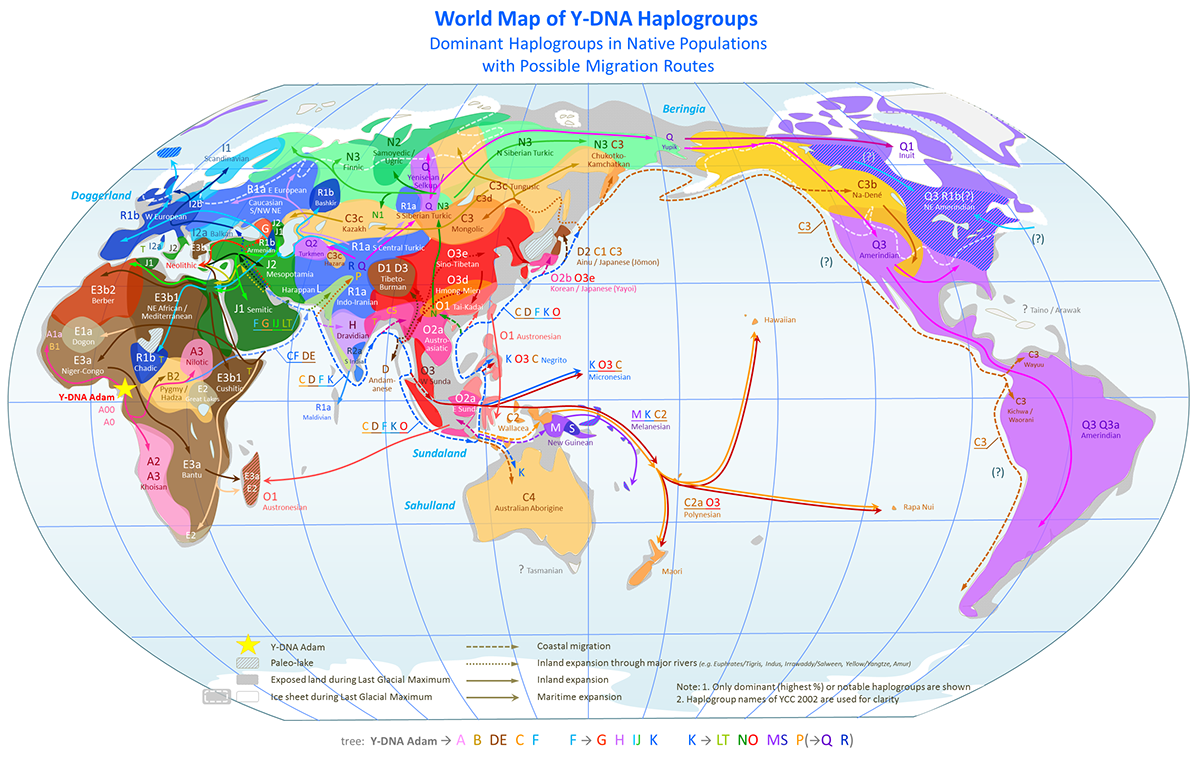
Here is a world map showing our current understandings of how males of the world genetically relate to each others, and how our great-great-great-...-grandfathers would have been migrated across the world. In risk of oversimplification, and sparking controversy on how data is represented or even how such a map could possibly exist, I tried my best to keep it accurate and clear.
Y-chromosomes are what defines males, a unique asset to guys. Inside the chromosome, there are regions of DNA that change slowly over time. By studying the changes among different populations in the world, scientists are able to group males into various haplogroups and trace their ancestral relationships (e.g. about 35% of Icelandic males are haplogroup I1, 40% are R1b, 25% are R1a, where R1b and R1a males are more closely related than I1).
Using those data, we can even speculate how our (male) ancestors migrated across the world, from our Africa homeland (the yellow star in map) all to the tip of South America. That's how the Coastal Migration theory became popular -- genetic signals show a group of people with males of haplogroup C/D/F/K have been migrated rapidly along Indo-Pacific coastlines, and subsequently moved inland through rivers.
Discussion at Dienekes blog