The Background:
One of the challenges of designing for RJMetrics was this: working with data can be such an abstract concept for potential customers. And the data challenges of a typical ecommerce company can feel daunting. How could we make harnessing the power of data seem more approachable -- and even fun?
The Design:
Wherever possible, our team wrote about real life examples, used metaphors, and employed lots of visual aides to help explain tough concepts and keep our audience feeling upbeat about their data challenges. Here are a few illustrations I created to help make our connect connect:

Whitepaper covers.
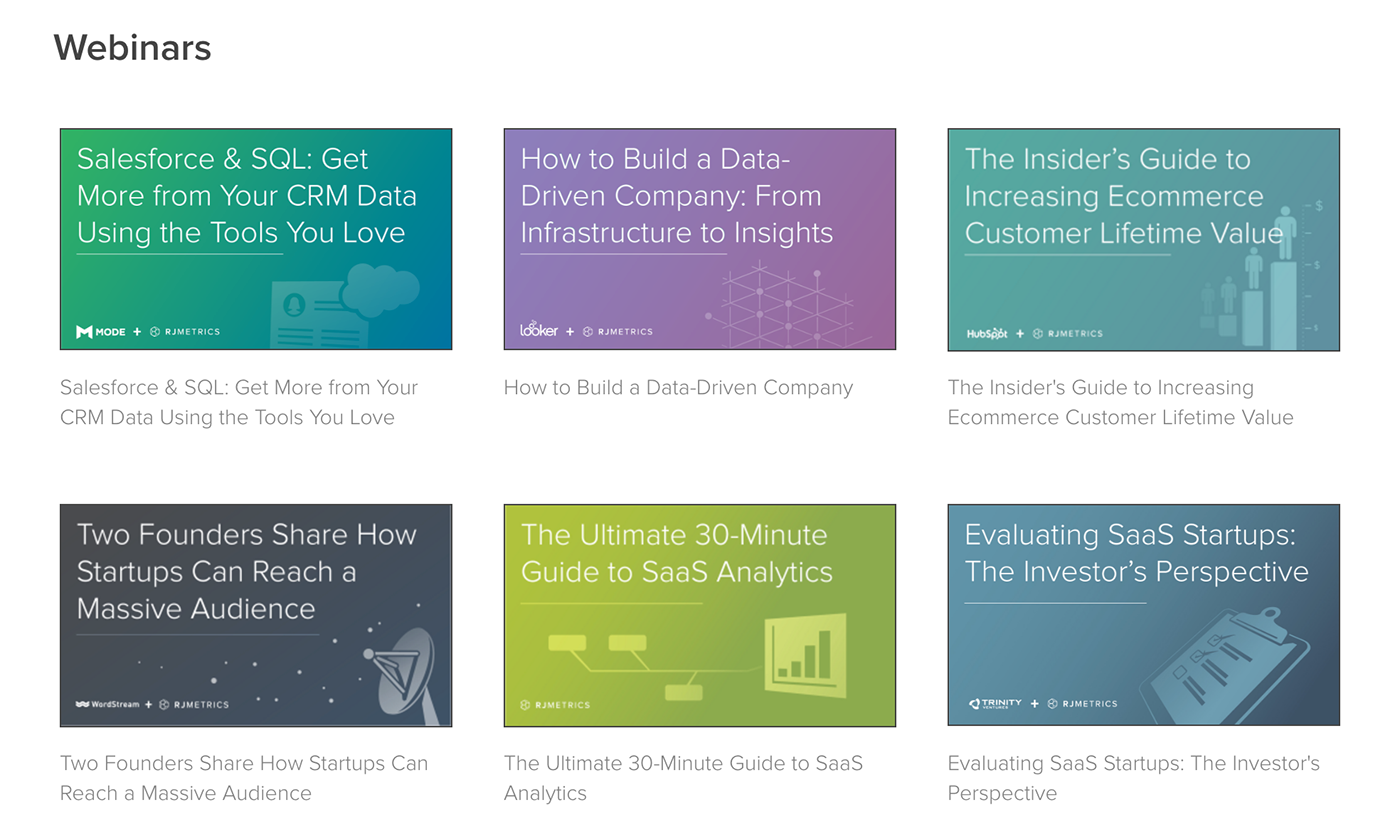
Webinar cover slides.
These illustrations played a big role in our brand's visual identity. I needed to produce a wide variety of pieces but also make sure that collectively, our visual assets supported a consistent RJMetrics style and voice.
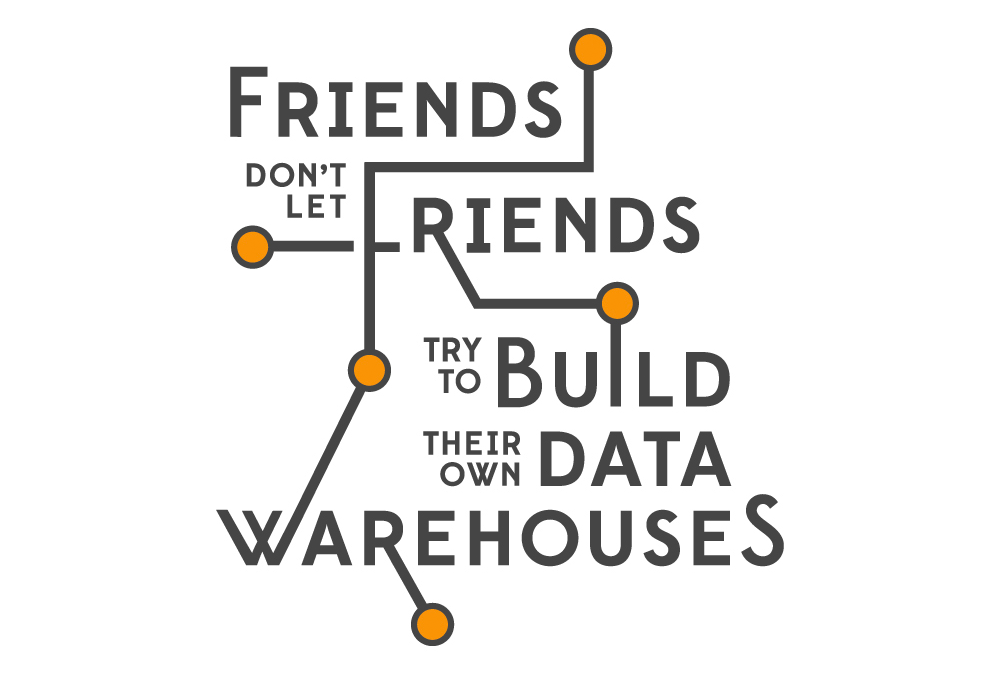
A type piece for a blog post. Don't do this yourself -- let us help you!

Illustrations for a piece on the psychology of setting goals.
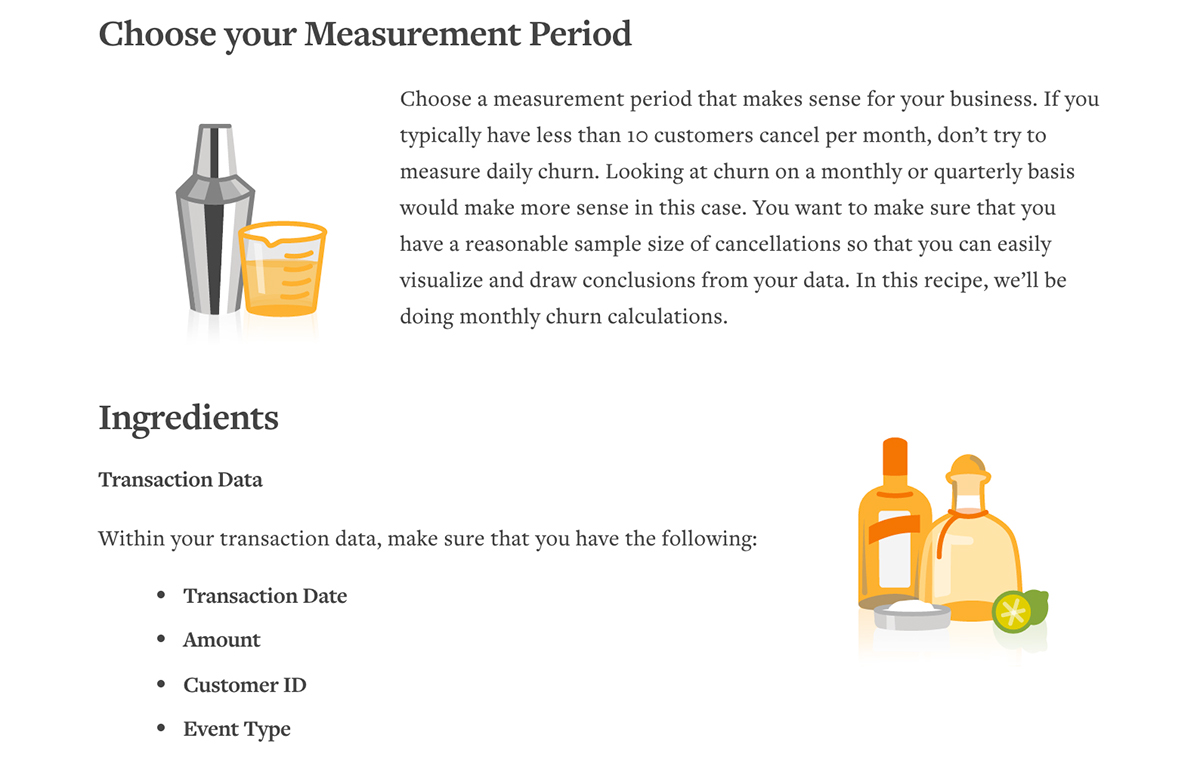
Calculating your churn rate can be scary, but it's no harder than mixing a drink.

Newsletter signup modal.

Evidence-based tips to help get your ecommerce store ready for the holidays.


