
I spend a lot of time looking at bus data at my job so wanted to create a set of visualisations that looked at interesting narrative threads. I decided to produce a trilogy of visualisations, episodic in nature, all looking at various elements of bus travel in the UK.
The data was sourced from The Bus Open Data Service (BODS) which is an open data service the company I work for developed for the Department for Transport. Each iteration involved analysing a lot of data so in some cases the time period was concatenated to a few hours.
Episode 1: The Loneliest Bus
This was a really fun project to start on and involved a lot of data processing to figure out. The idea behind it was to analyses the closest bus in proximity to any other bus throughout its journey. The journey that has the least amount of interaction with other busses could therefore be deemed the loneliest! So how did I do it...

So the grab was taken from a 3-hour window (10:00 - 13:00) from https://data.bus-data.dft.gov.uk/avl/download/ pretty much every 5 seconds, notwithstanding the time to download the relatively big SIRI-VM packets. '3 hours window' - because of time to process the next step...
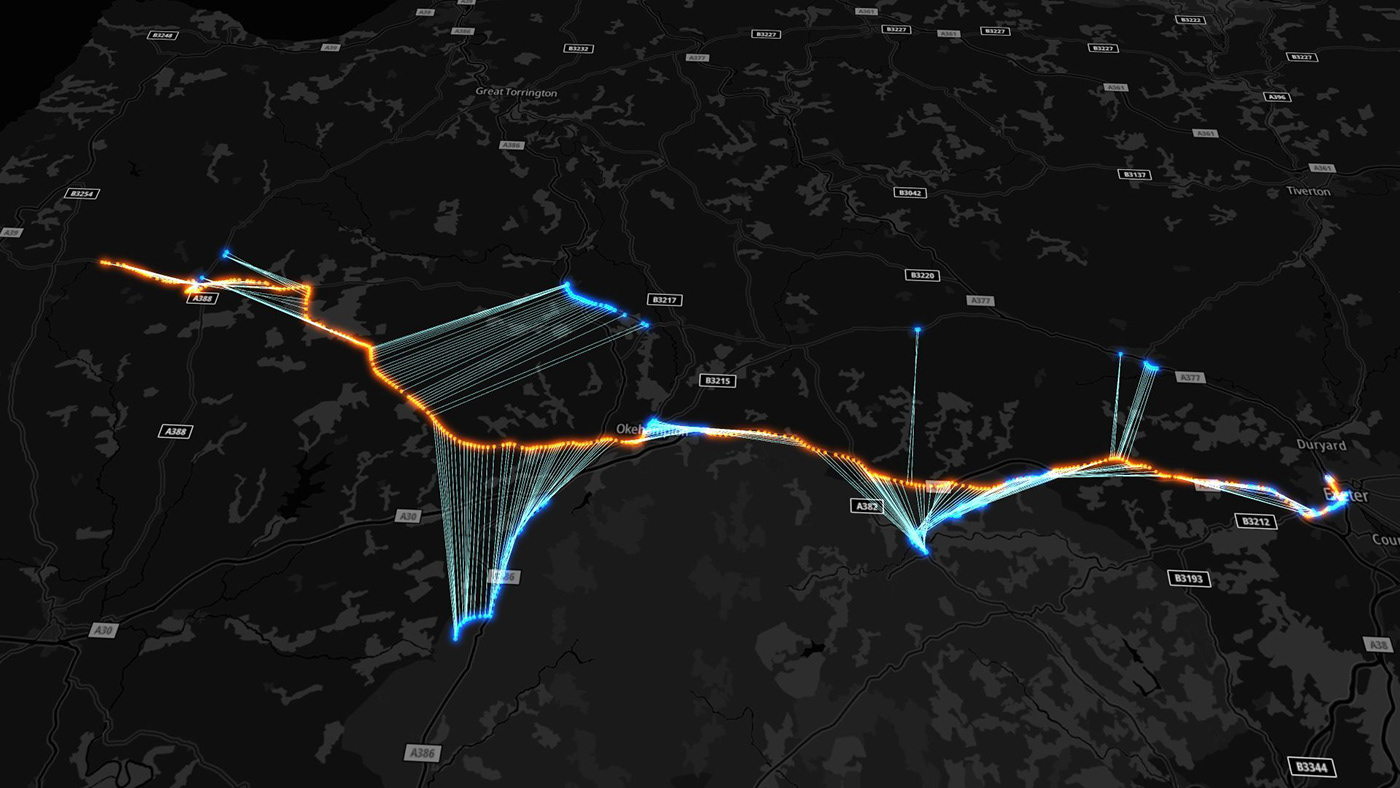
Each route was isolated and for every x interval, a calculation was made to find the 'nearest' bus at that time. If orange dots are the bus routes in question blue dots and lines indicate the proximity to the nearest. This took a while to process for the thousands of routes.
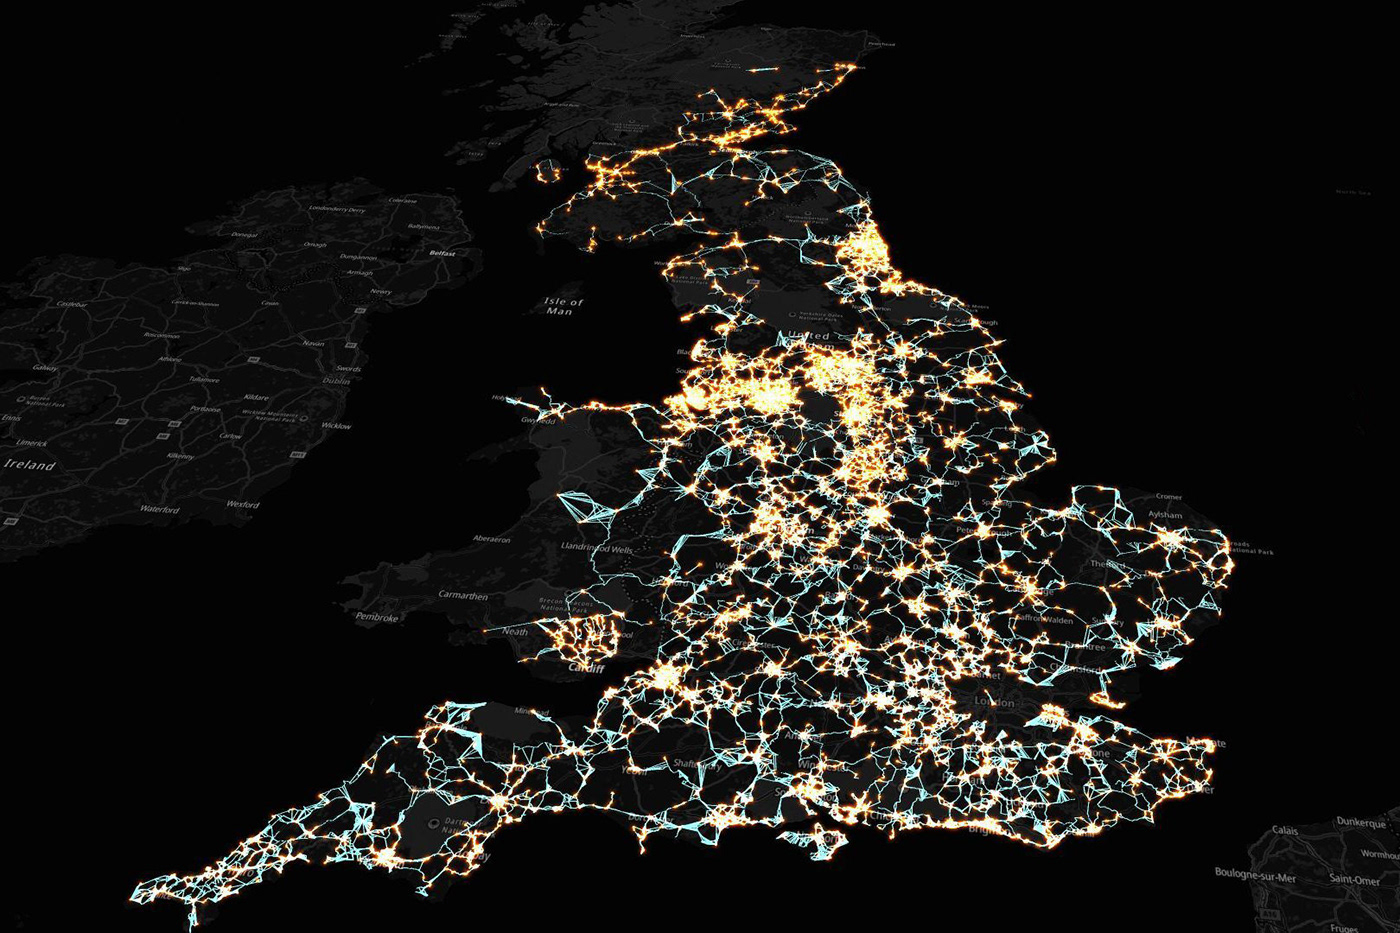
So at scale that gave me a lot of data to sift through, the average 'distance to nearest bus' was taken for each route but I also factored in route length, so the data table was sorted by '(length * 0.5) + (av dist * 0.5)' giving each metric an equal weighting in importance.
So the SDVN route came high on that list and therefore is 'One of the... Longest and Loneliest Busses' (in BODS, in England)!
Episode 2 - The Hardest Working Bus
The second in the trilogy was under construction for quite some time, the analysis that went into trying to figure out how hard a bus was working in terms of 'climbing hills' was pretty intense. The idea behind this was to use distance and average ascent as a proxy to determine how hard a bus was working. So here is how I did it...

So by 'hard-working' I wanted to look at buses that traverse a lot of terrain, i.e. the delta between min and max is high for ascent and descent, plus they also travel over large distances, 50% weighting on each. This small multiple shows some of the outputs from the analysis.
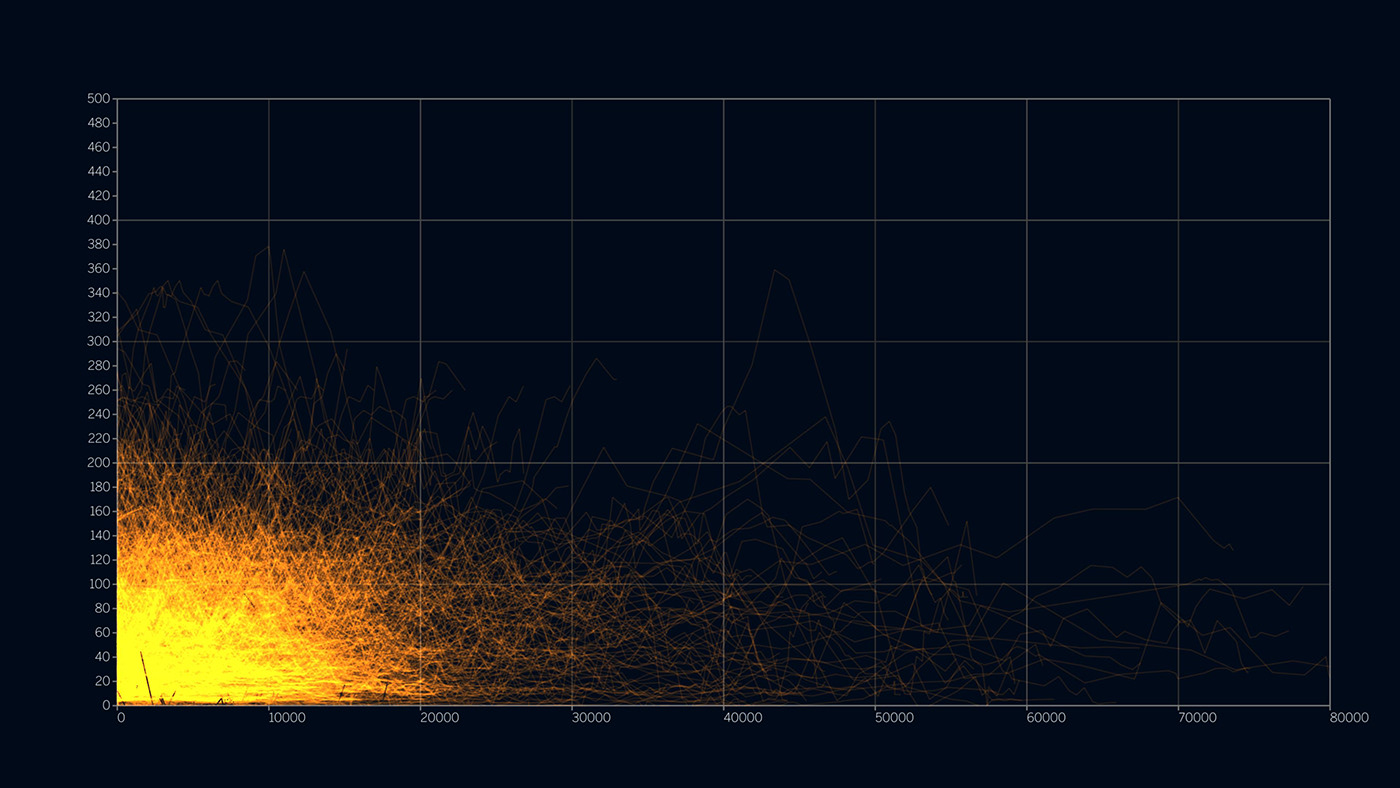
Another way of looking at it is to composite a height profile for all journeys and filter them out visually. Journeys between 07 am-Midday were analysed as the volume for one whole day was too much for a mini-project.

I ended up using Ordnance Survey 50m terrain, due to coverage, each GPS point was linked to it's nearest terrain point to create a height profile. From here I calculated the delta between min + max elevation, total elevation gain & distance and used these to sift out 'hardest working buses'
And there we have it busses on Borders Buses Line LI8335 is are amongst the hardest working busses in the UK
Episode 3 - The Longest Journey
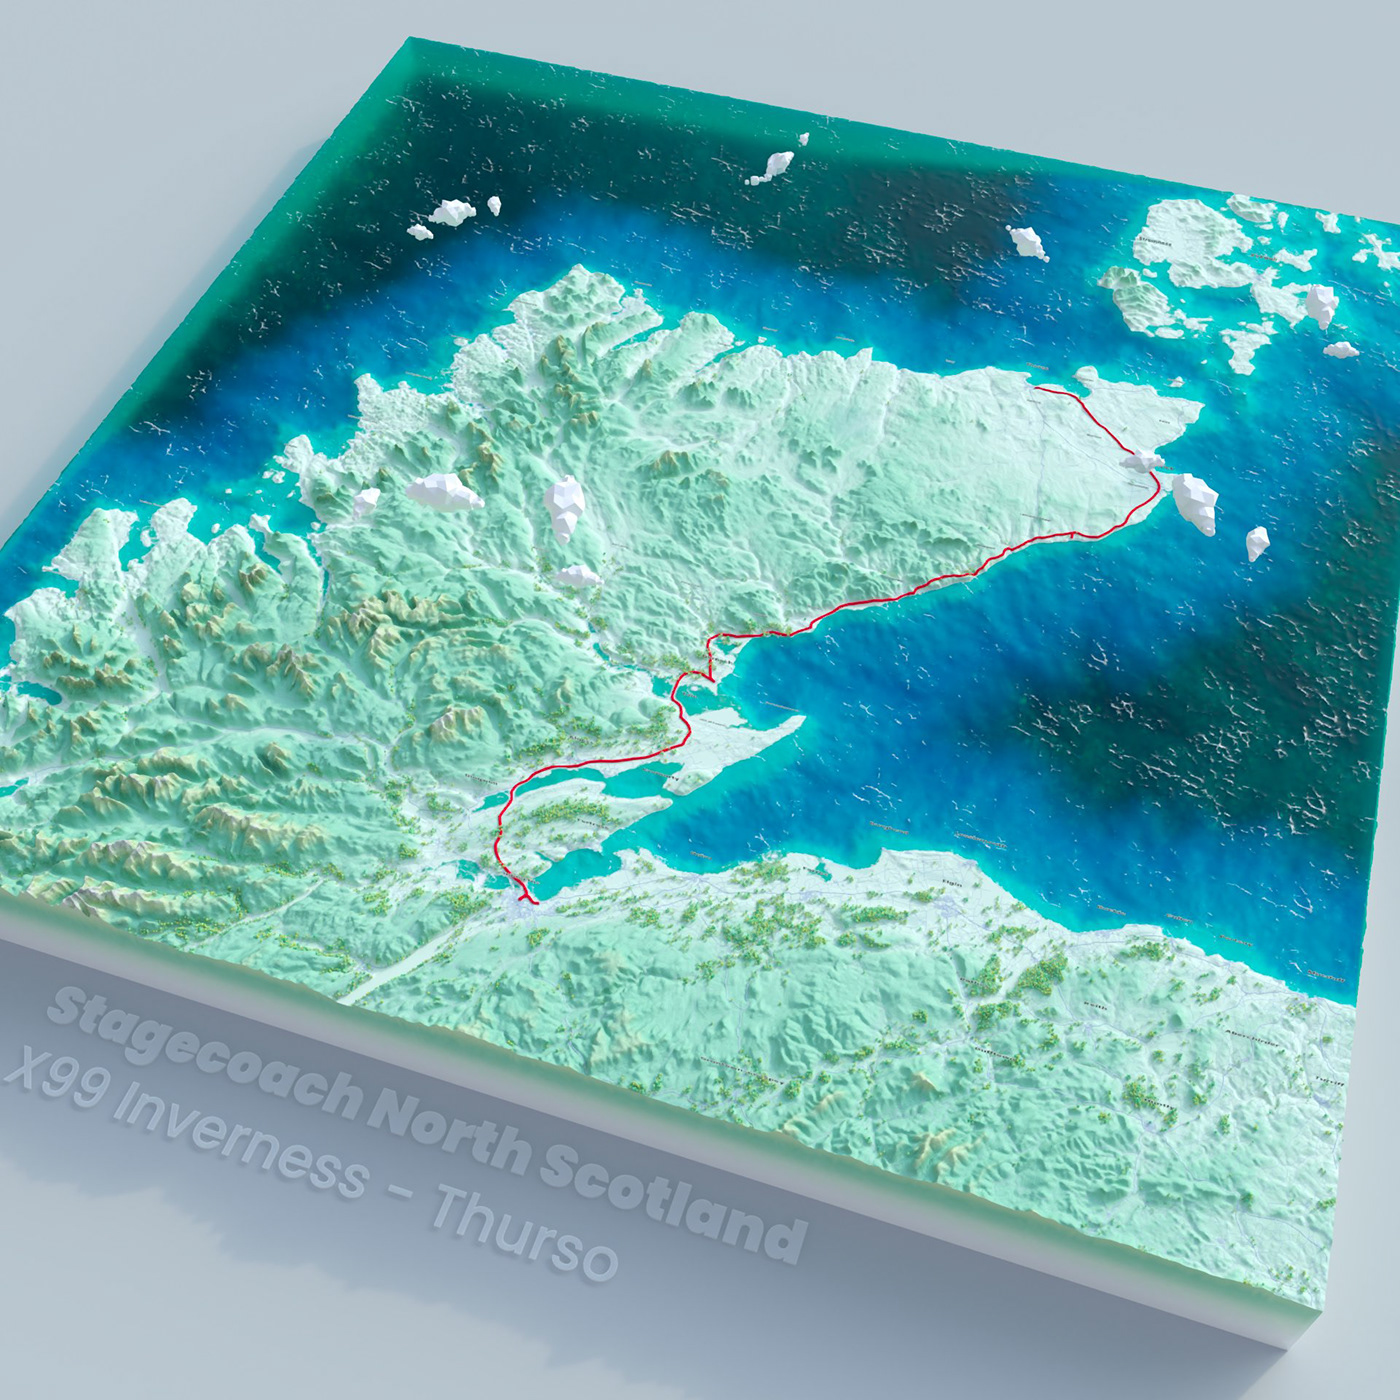
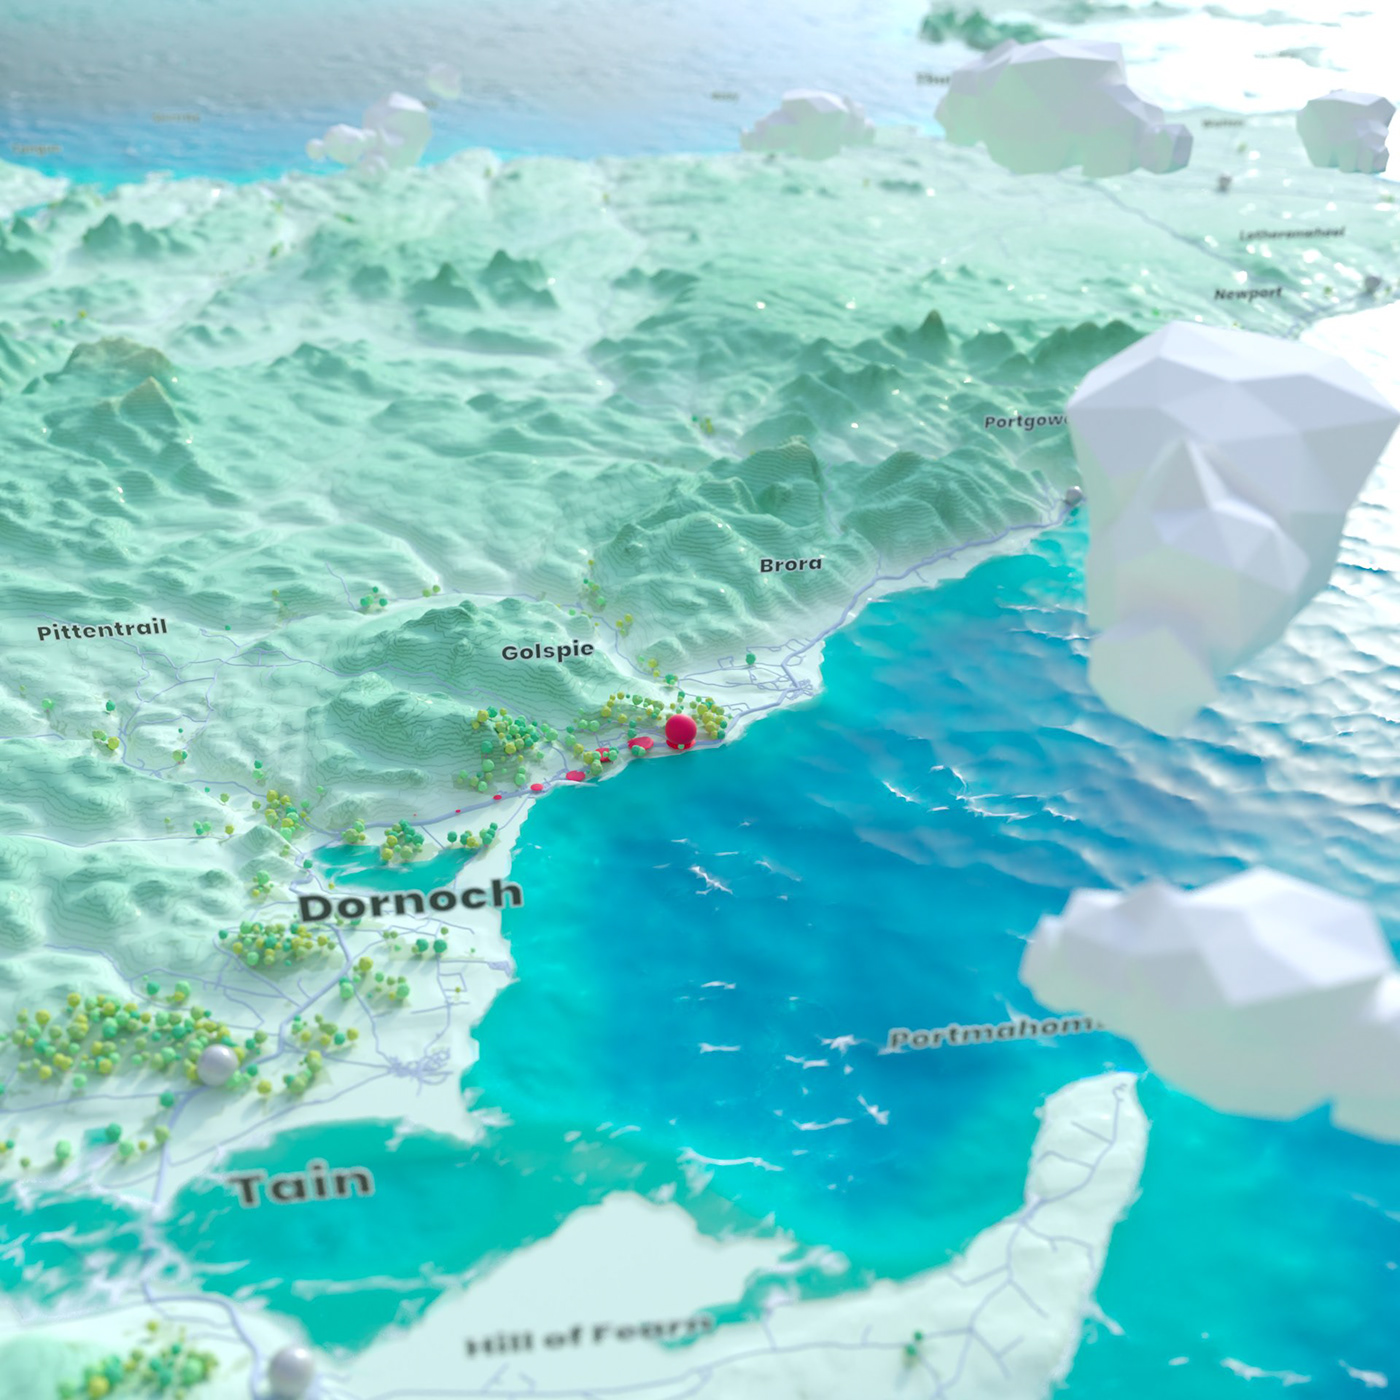
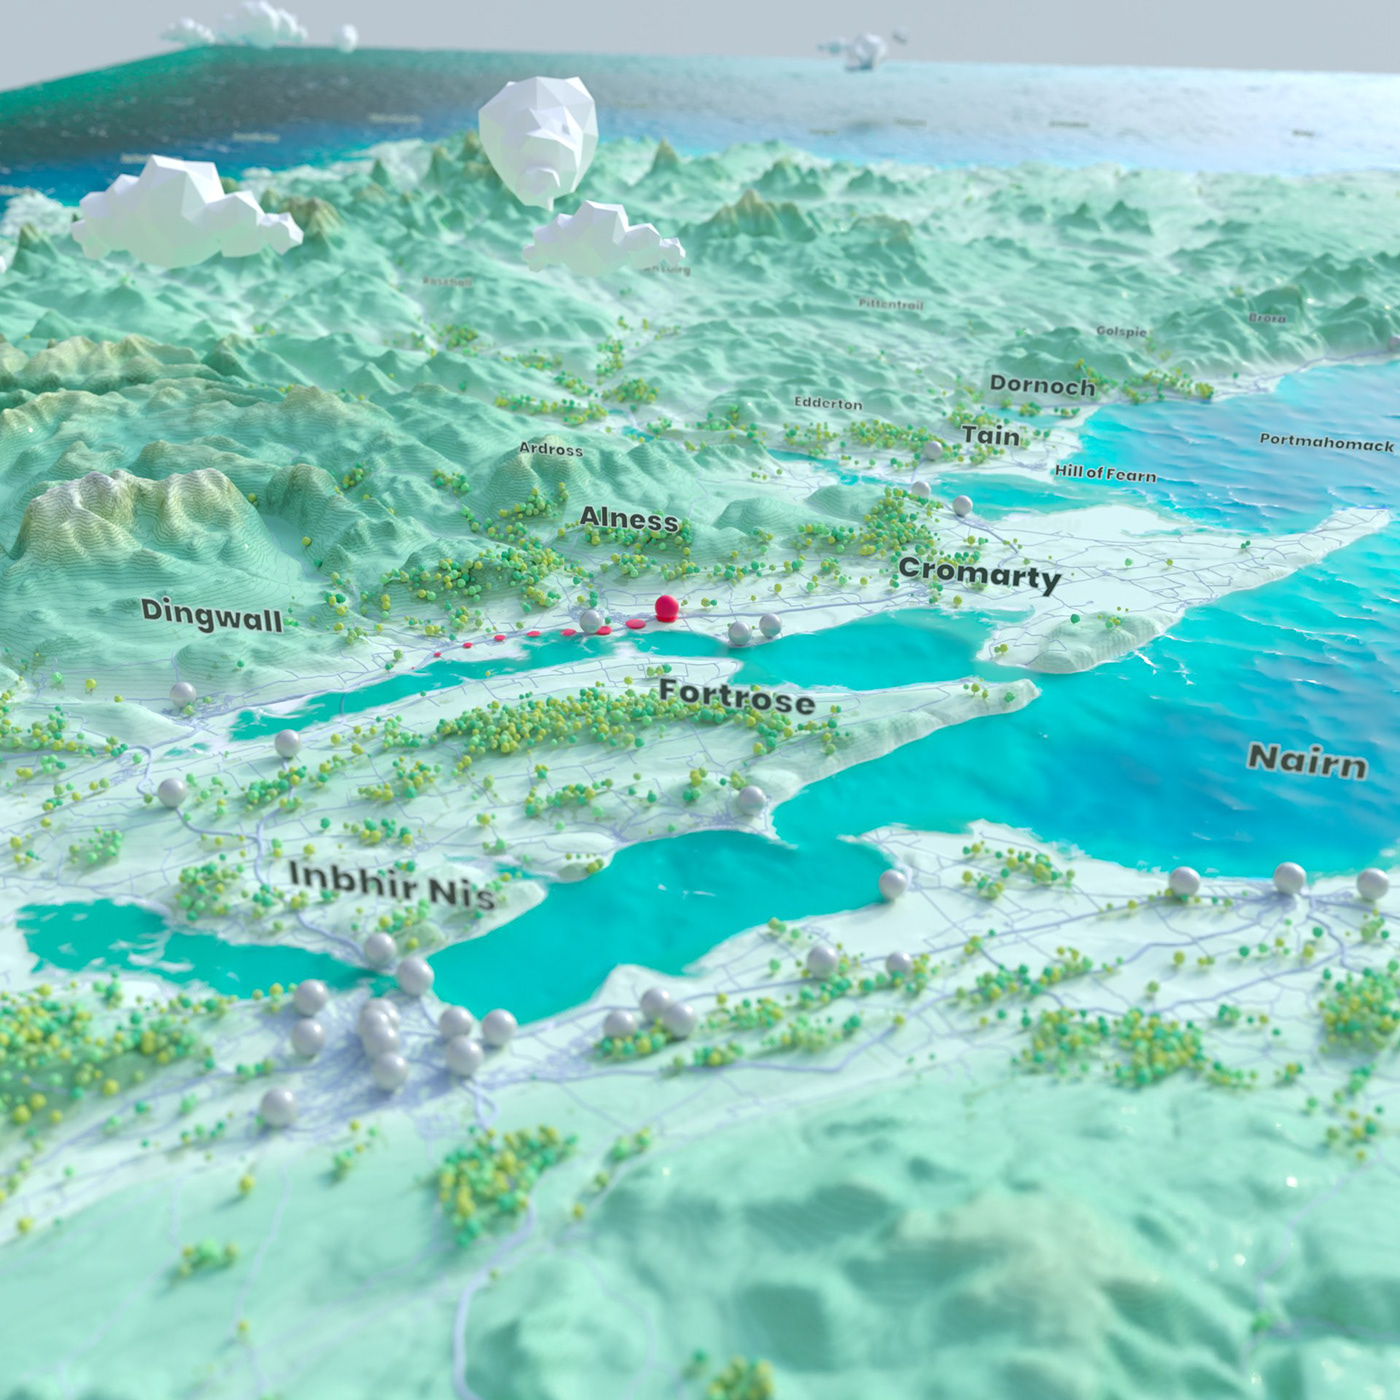
This visualisation was perhaps a little simpler in the analytics that went into it. For the last visualisation I just wanted to visualise one of the UK's longest journeys in BODS. A fairly simple metric calcualted by calculating the length of the line at the end of the journey. I spent more time on the aesthetic in this visual, building up the mini diorama to create a sense of place and scale.
So after scouring a day's worth of bus open data I discovered the X99 line Inverness to Thurso is 'one of' the longest bus journeys in BODS, ~71 stops over ~218 minutes - this is one big old journey!


