
Inspiring a Movement: The Warming Stripes
Written for Nightingale. Article by Claire Santoro, Data Visualisation by Chesca Kirkland.
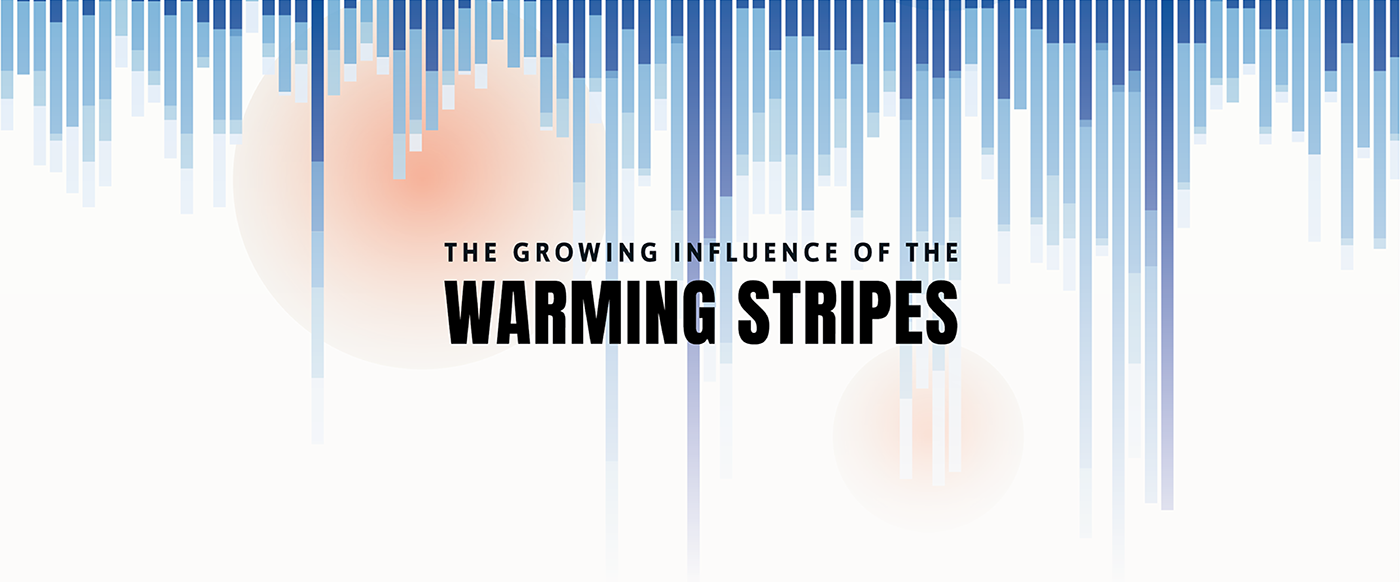
The Warming Stripes, created by climate scientist Ed Hawkins, show blue-to-red stripes that illustrate the sharp increase in global average annual temperatures over the last century. ShowYourStripes.info is a site that allows people can generate and download a Warming Stripes graphic for any location around the world. Over time, The Warming Stripes have grown into a global visual symbol of the climate movement, with stripes appearing on a vast collection of items. From coats at London Fashion week to Greta Thunberg's new book cover, to Reading FC's uniform to COP events.
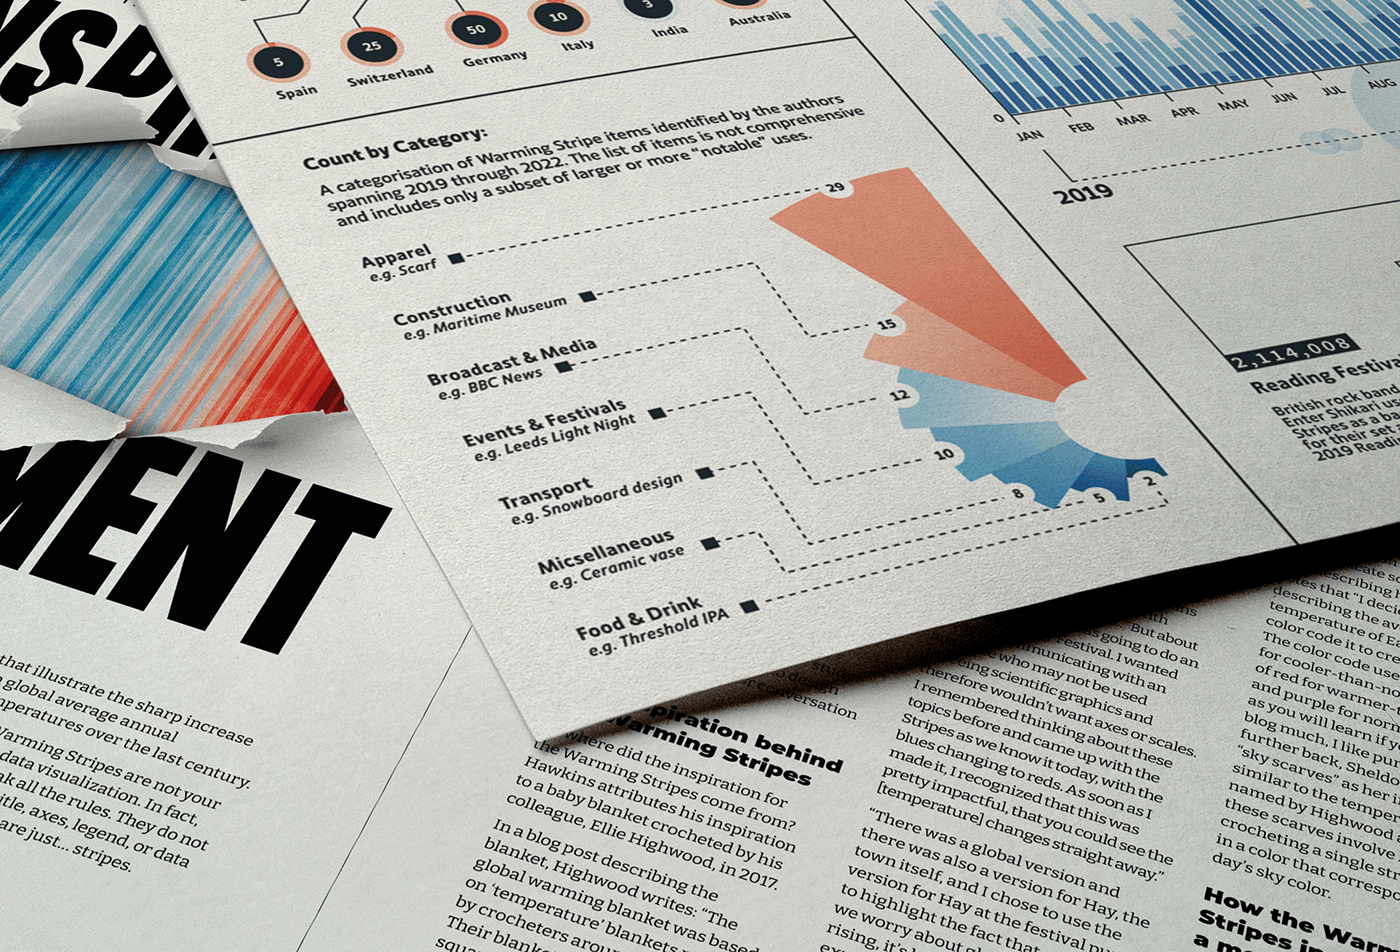
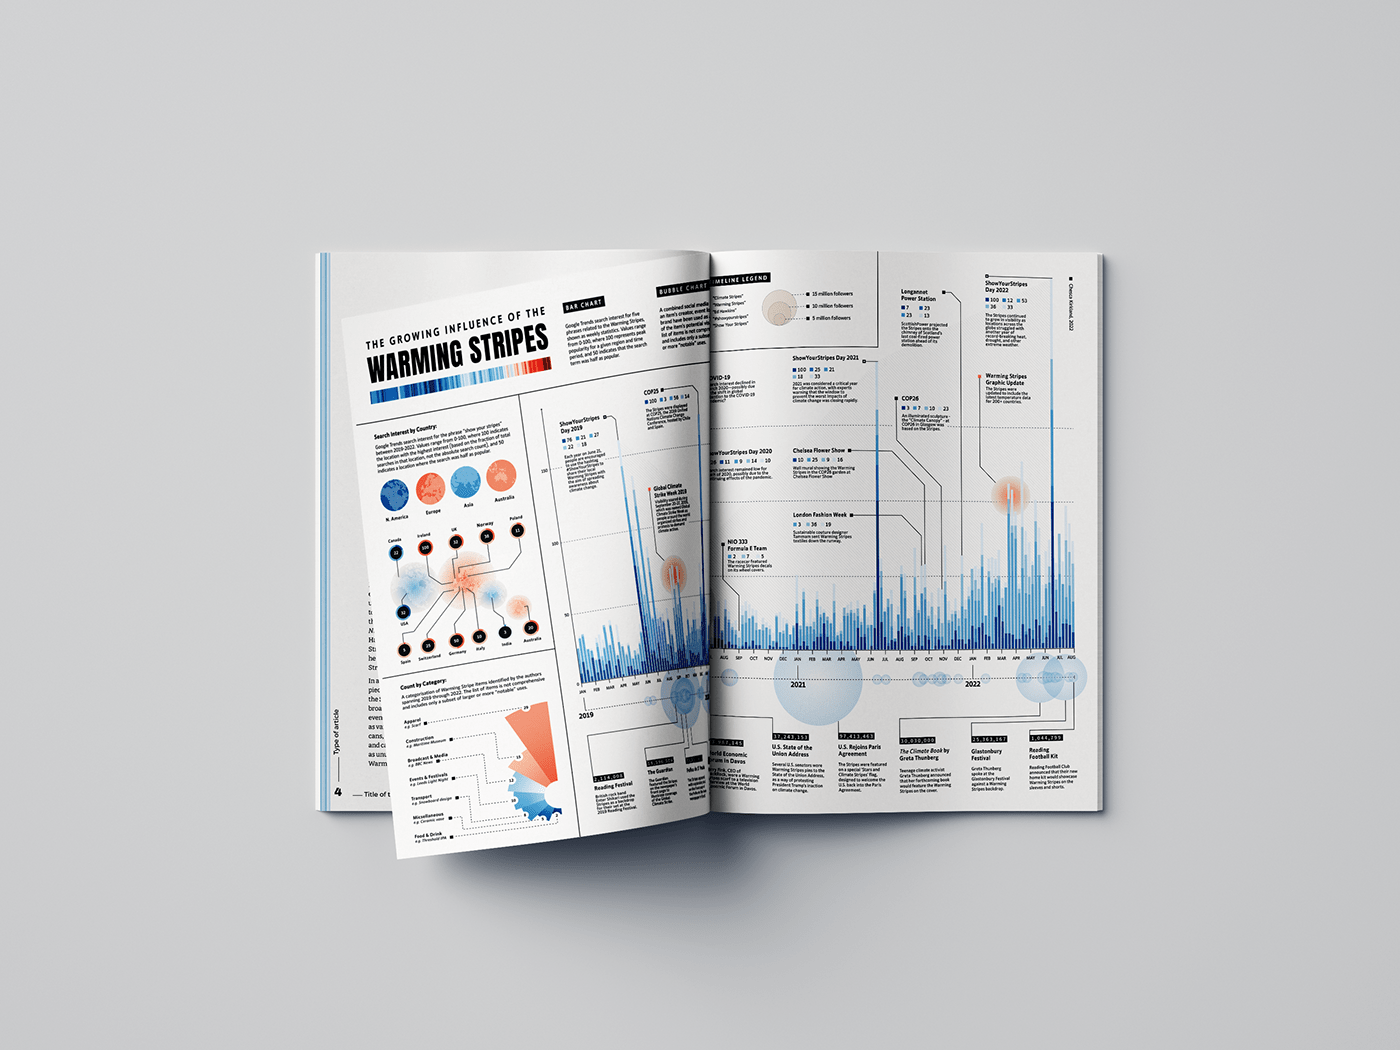
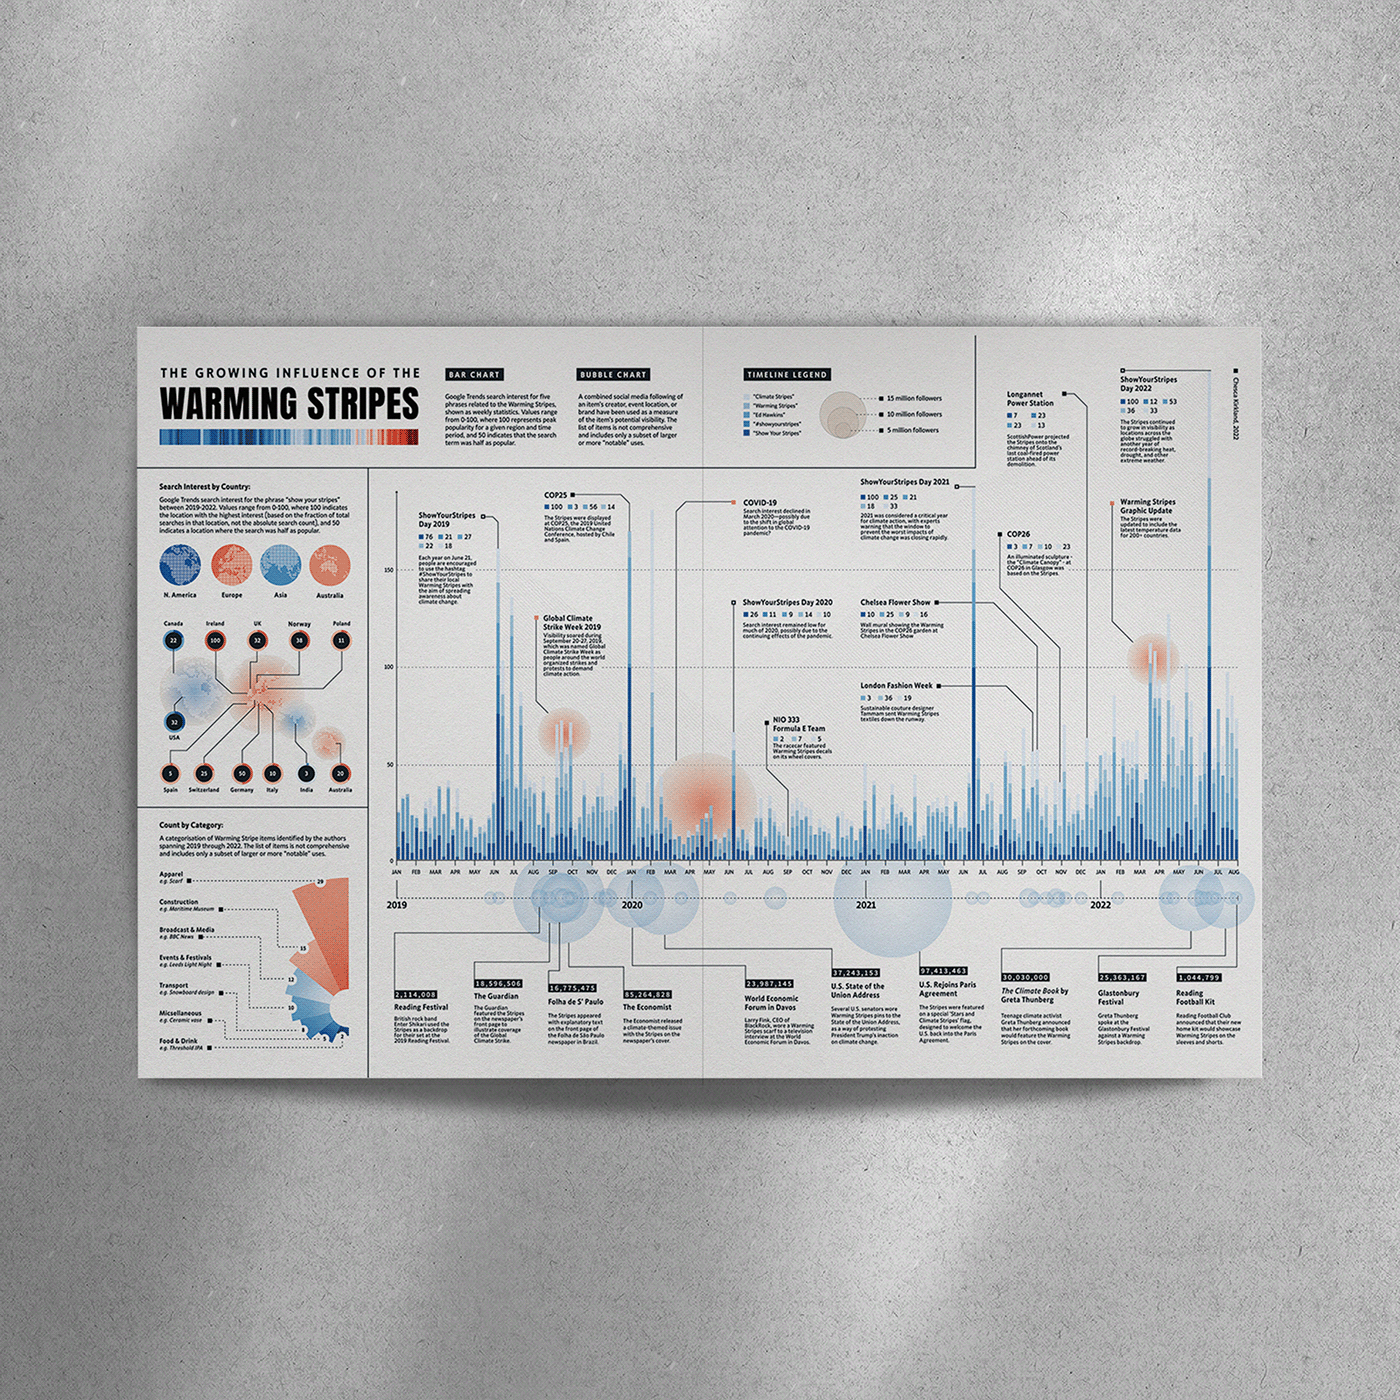
The goal of the visualisation is to show and evaluate how the Warming Stripes’ influence has grown over time. Using Google Trends data to track search interest for terms related to the Warming Stripes from 2018 onward, more than 80 “notable” uses of the Warming Stripes were identified (a subjective categorisation that excludes countless representations by individuals on protest signs, clothing, and accessories, as well as most media coverage). These uses were quantified by the size of their social media “bubble” (i.e., followers of the person or platform that displayed the Stripes).
The process of creating the data visualisation included a variety of steps. As part of the initial research, Ed Hawkins was interviewed alongside scraping the internet and recording data in Google Sheets. Once the data was cleaned, it was inputted into Flourish, an online dataviz tool that allows SVG downloads. After sketching out ideas, these SVGs were edited and designed in Adobe Illustrator and then art-worked in InDesign for the Nightingale Magazine print.
The process of creating the data visualisation included a variety of steps. As part of the initial research, Ed Hawkins was interviewed alongside scraping the internet and recording data in Google Sheets. Once the data was cleaned, it was inputted into Flourish, an online dataviz tool that allows SVG downloads. After sketching out ideas, these SVGs were edited and designed in Adobe Illustrator and then art-worked in InDesign for the Nightingale Magazine print.
Unsurprisingly, the data visualisation shows that interest and visibility have significantly grown over time, with obvious peaks around Show Your Stripes Day and the UN Climate Change Conferences. It's interesting to see how other timely events, like COVID-19, affected the search terms popularity at the time.


Chesca Kirkland is London based information designer, working at Signal Noise - the data design studio for Economist Impact. If you want to hear more about the project, please email chescakirkland@gmail.com, or to see more of her work follow her instagram for behind the scenes data visualisations @chescakirkland

