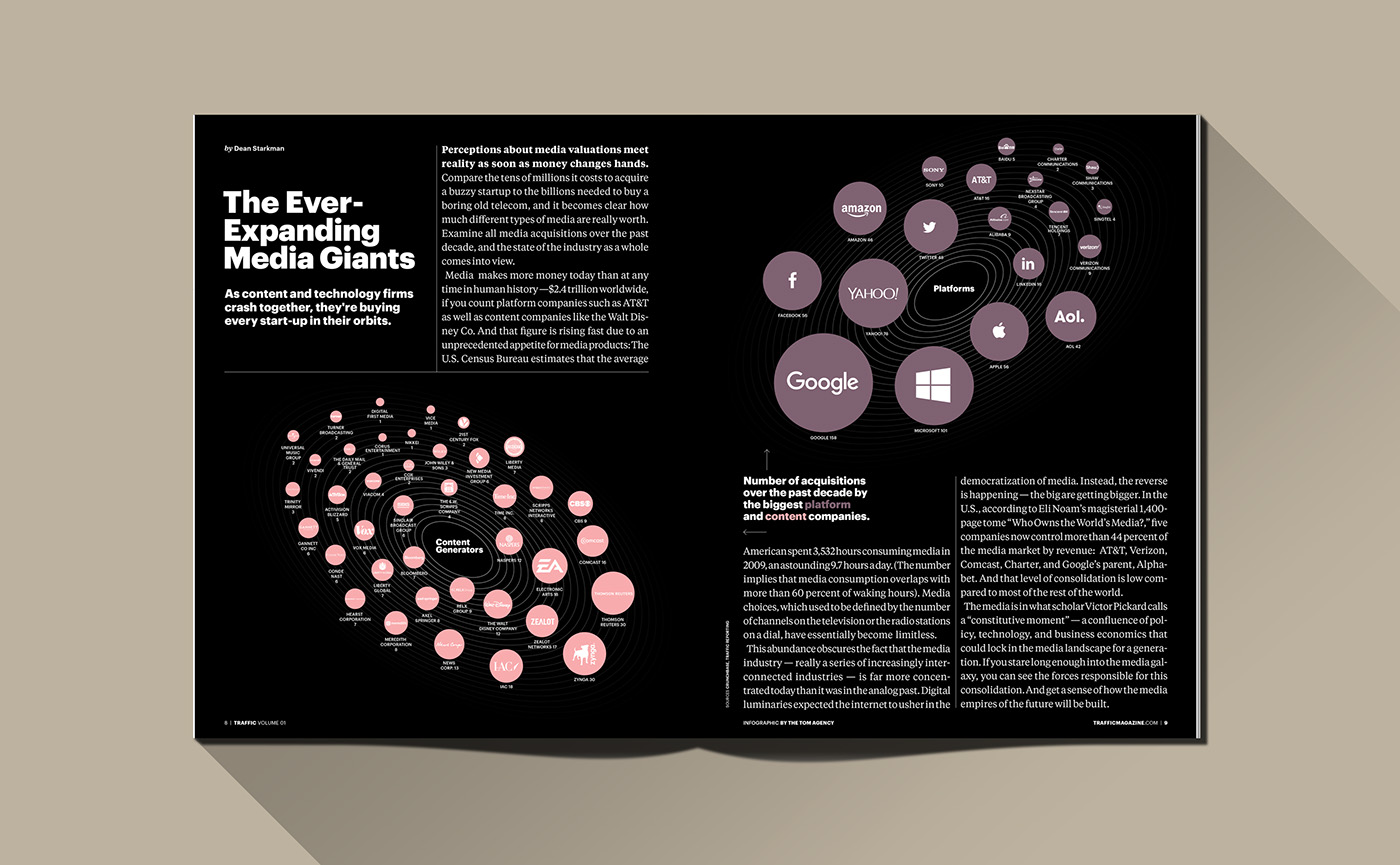
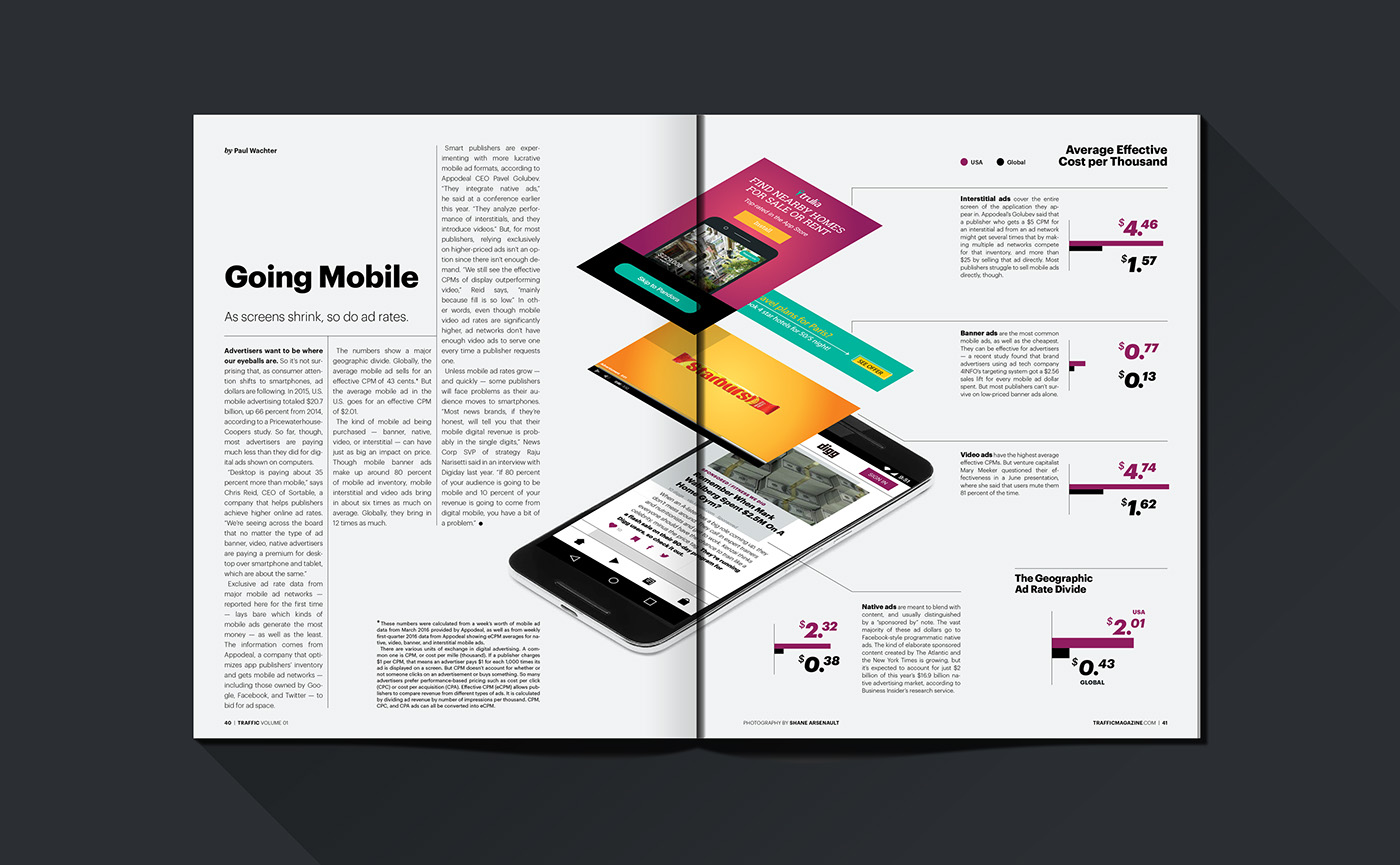
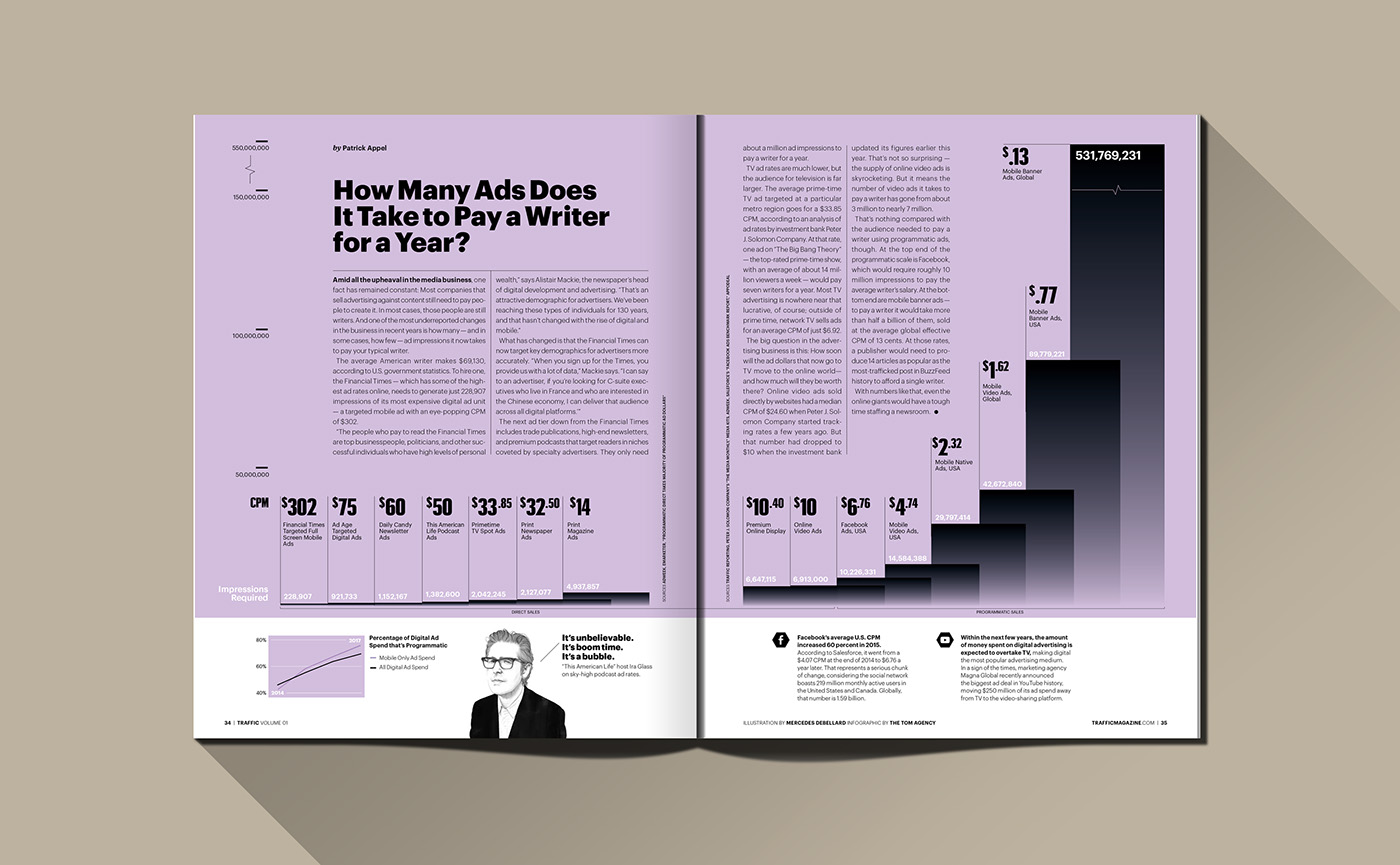
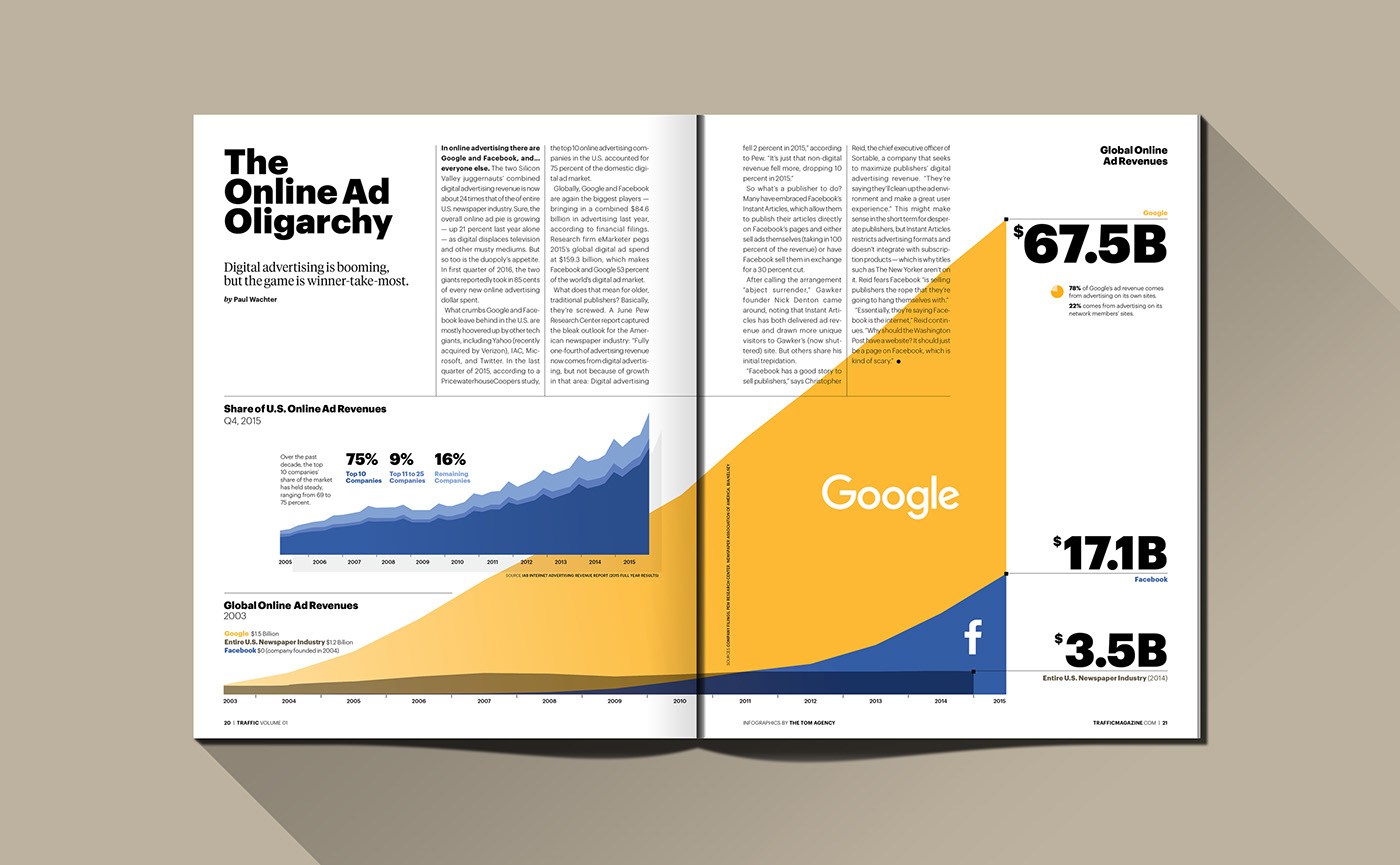
Traffic Magazine Infographics
Along with the full editorial design of Traffic Magazine, we created a detailed, cohesive selection of infographics and data visualizations.
Along with the full editorial design of Traffic Magazine, we created a detailed, cohesive selection of infographics and data visualizations.

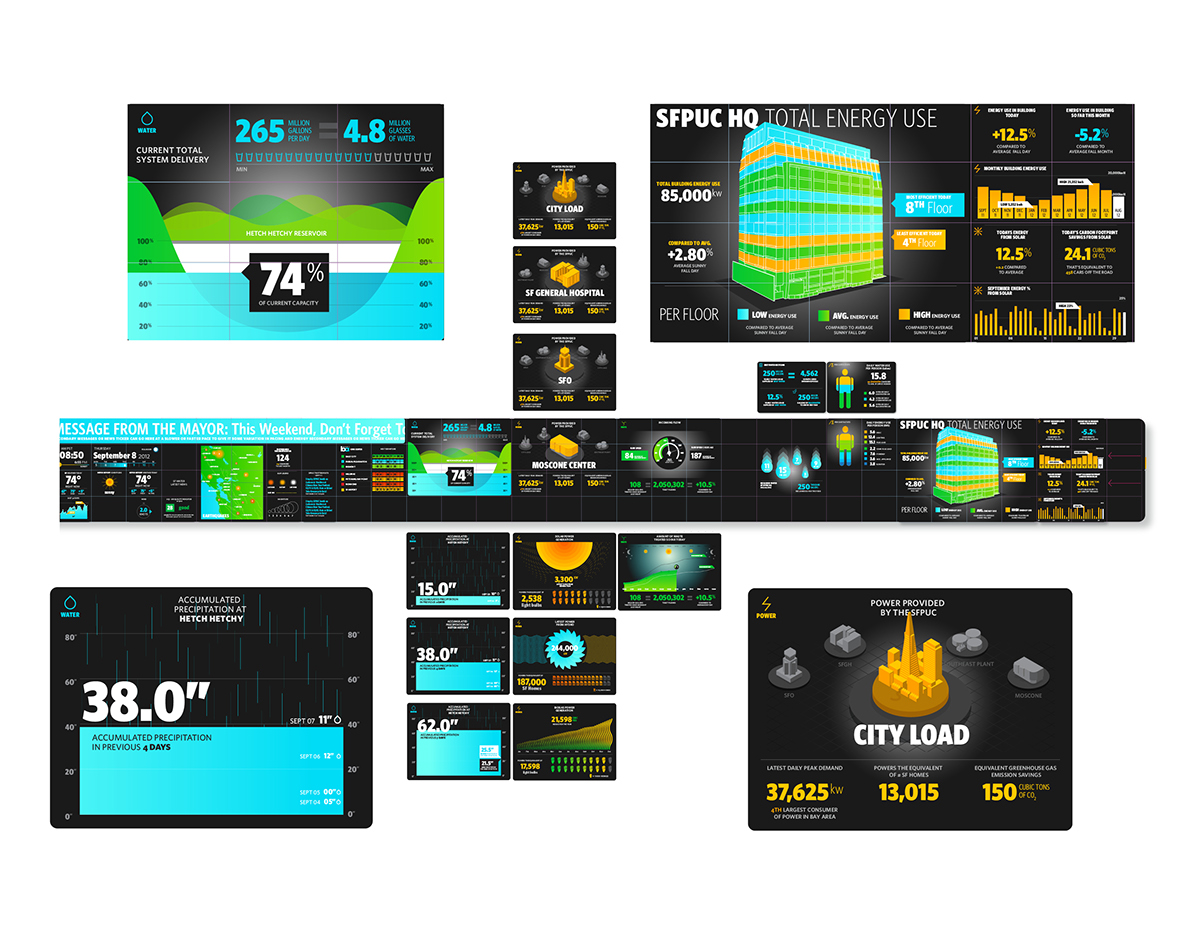
San Francisco Public Utilities HQ - Interactive Media Wall
In collaboration with Obsuca, we designed and illustrated a digital media wall for the new San Francisco Public Utlities Comission HQ lobby. People can see adaptive statistics and data about how Bay-area citizens are using energy, and where it's going to.

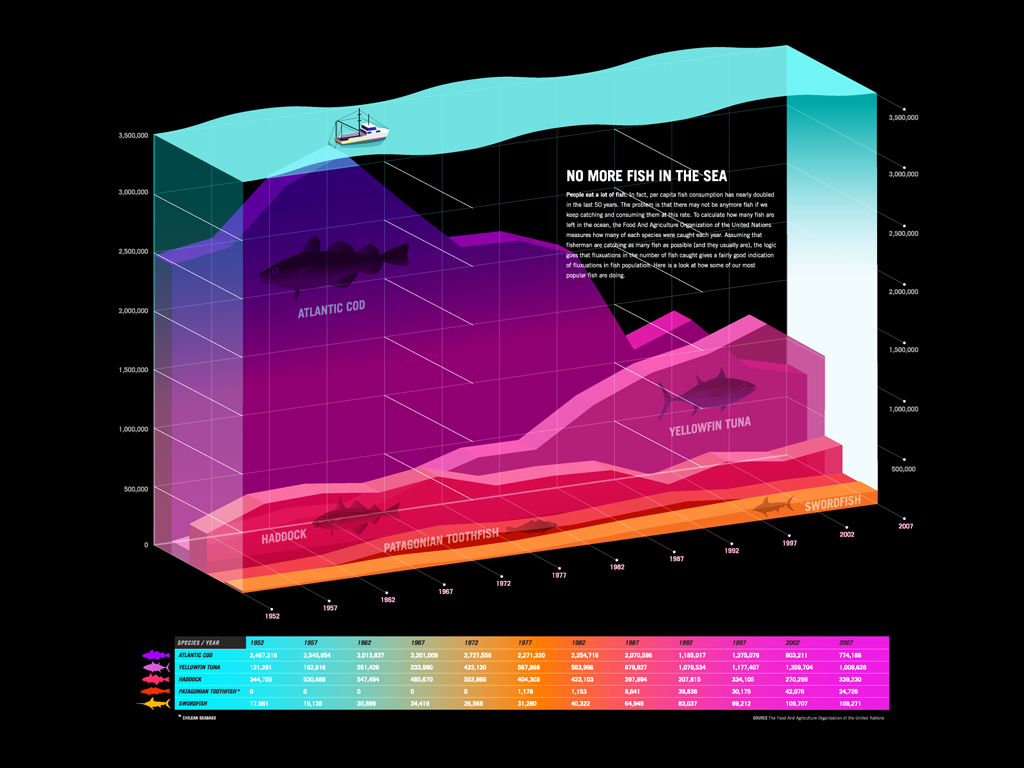
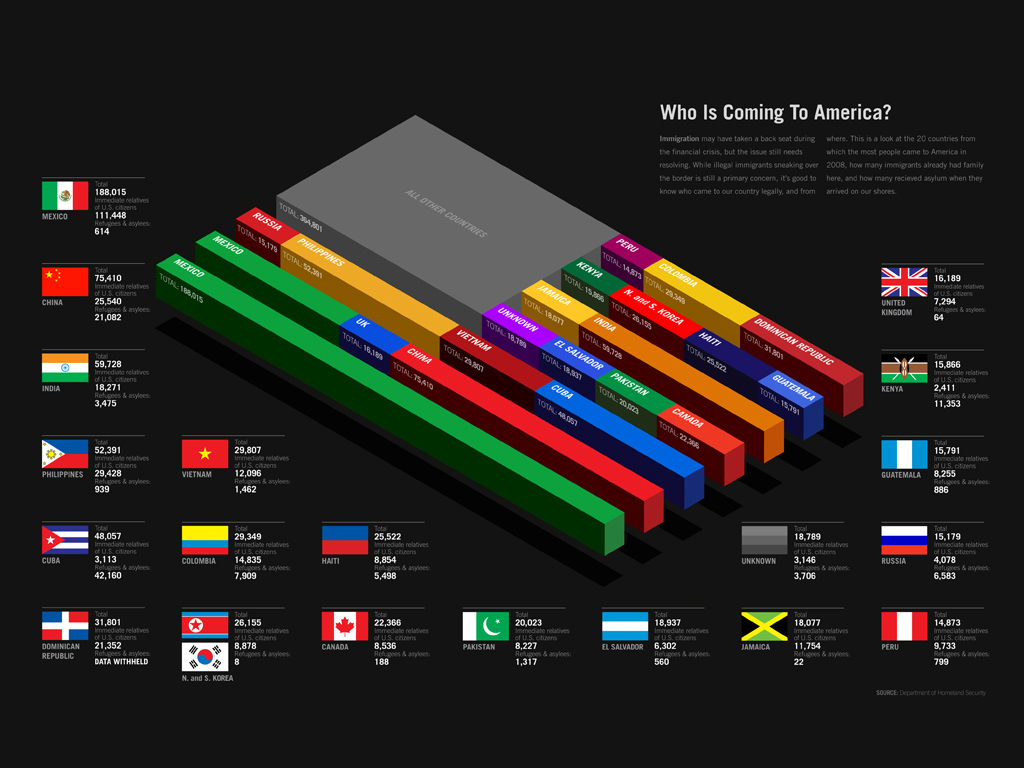
GOOD Magazine Transparencies
Created for the Transparency series, these graphical explorations of data surround various social and topical issues such as fish-stocks and immigration.
GOOD Magazine
Wired Infographics
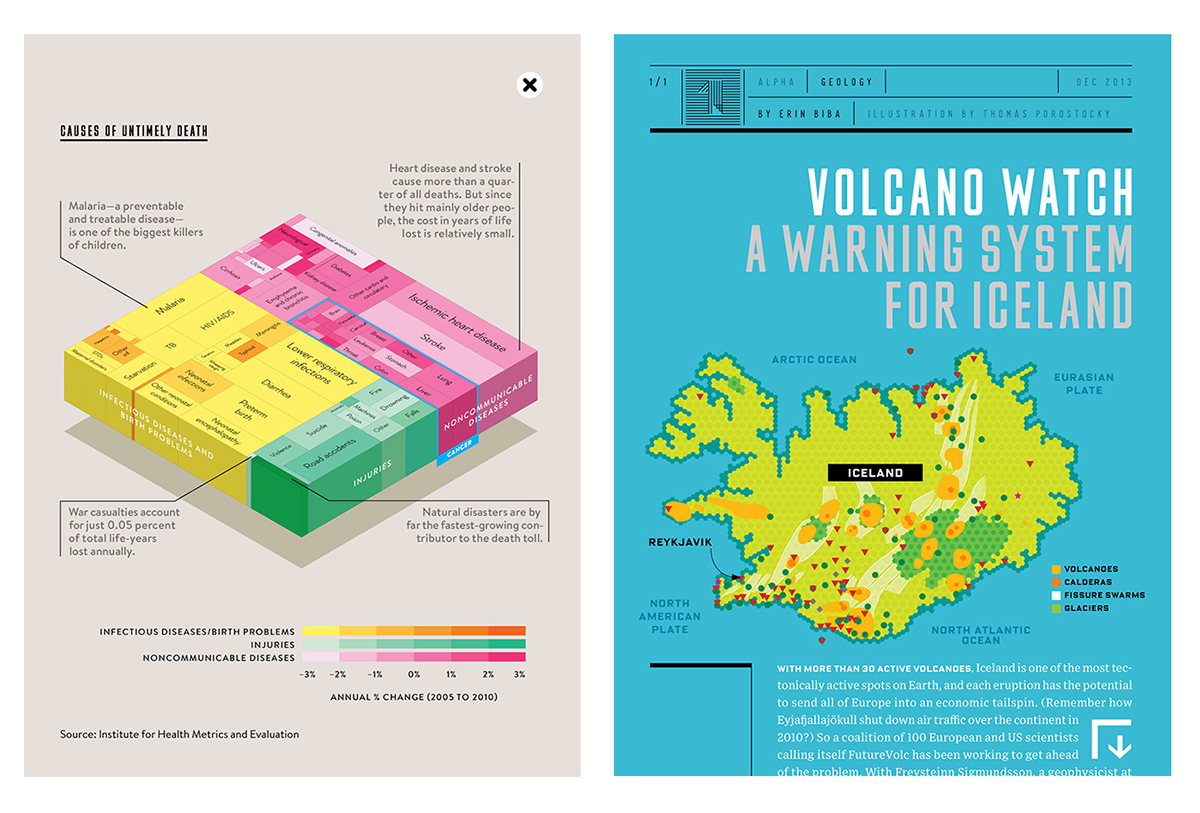
Select Infographics from the Bill Gates Guest Editor Print and Interactive.
Select Infographics from the Bill Gates Guest Editor Print and Interactive.
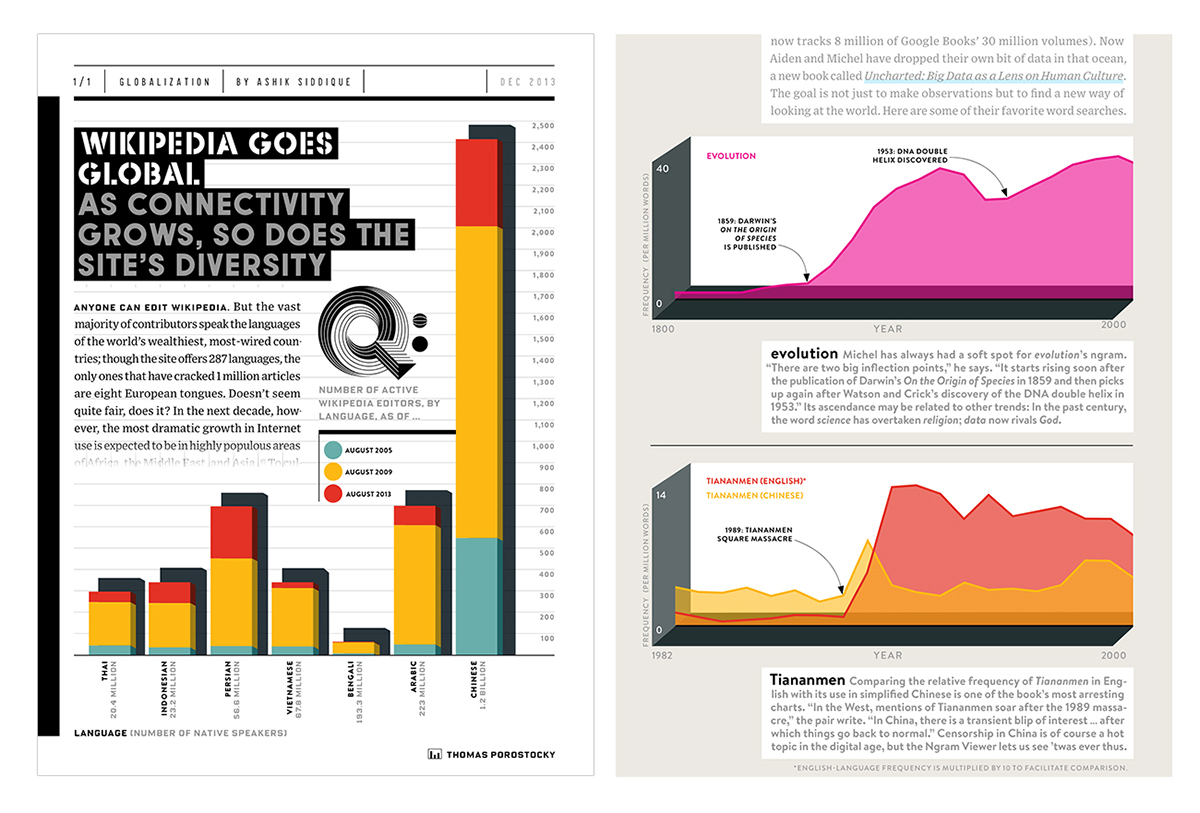

Kinky & Co
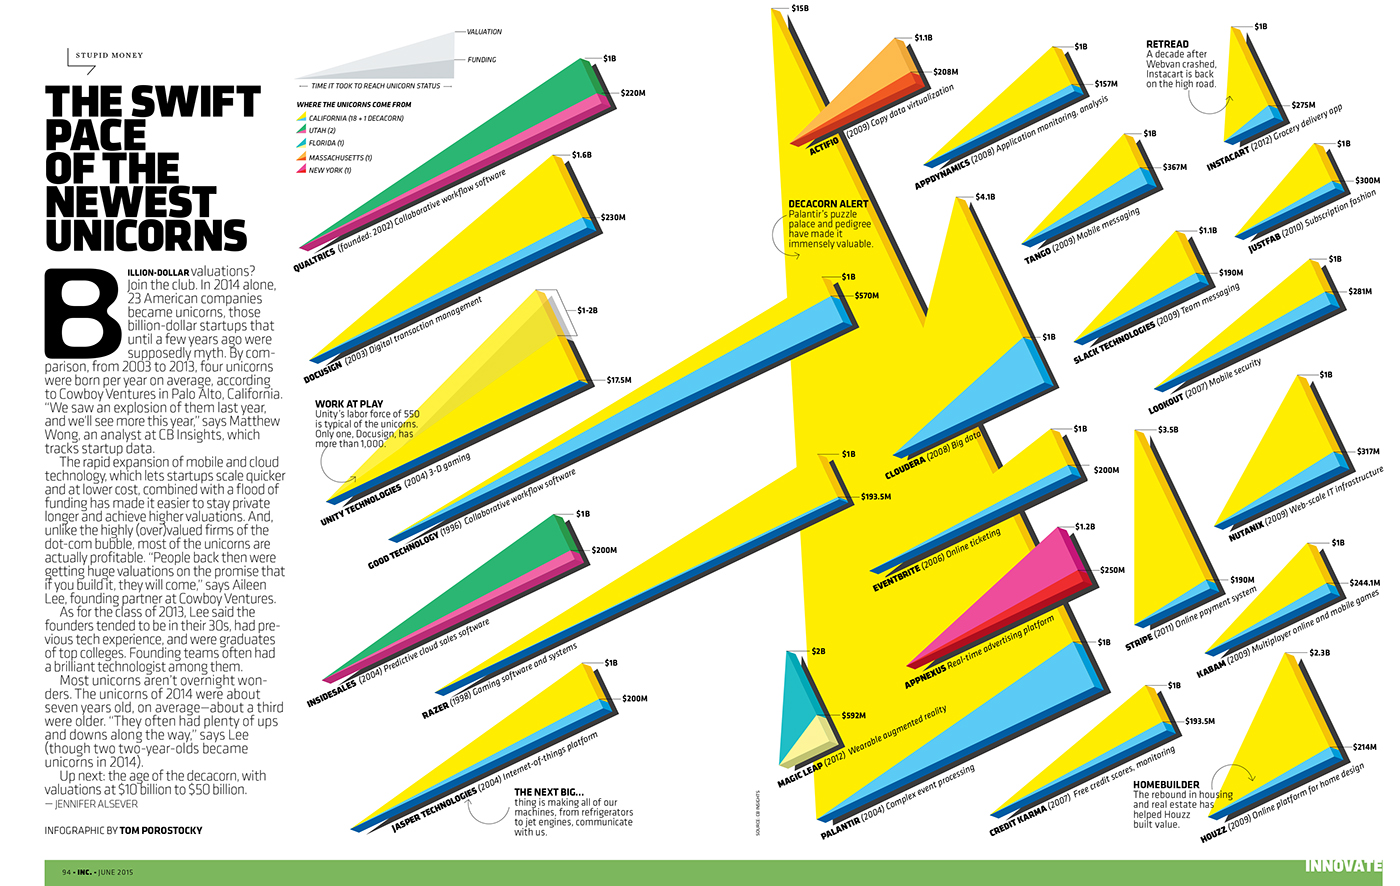
Nike+ Calendar
Working with the fine team at R/GA, a calendar for Nike+ was developed.
Working with the fine team at R/GA, a calendar for Nike+ was developed.


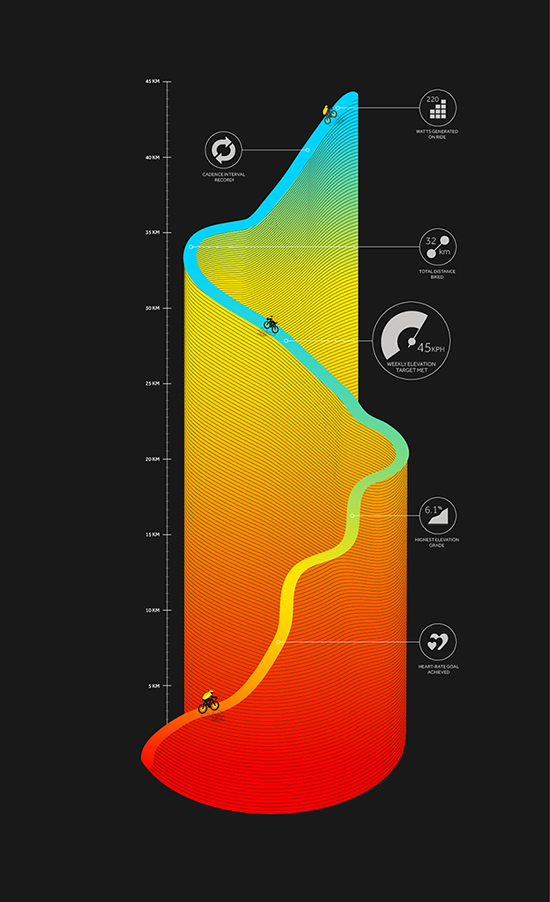
Bloomberg
IBM: Smarter Planet
a complete illustrated visual system was created for IBM's Smarter Planet series.
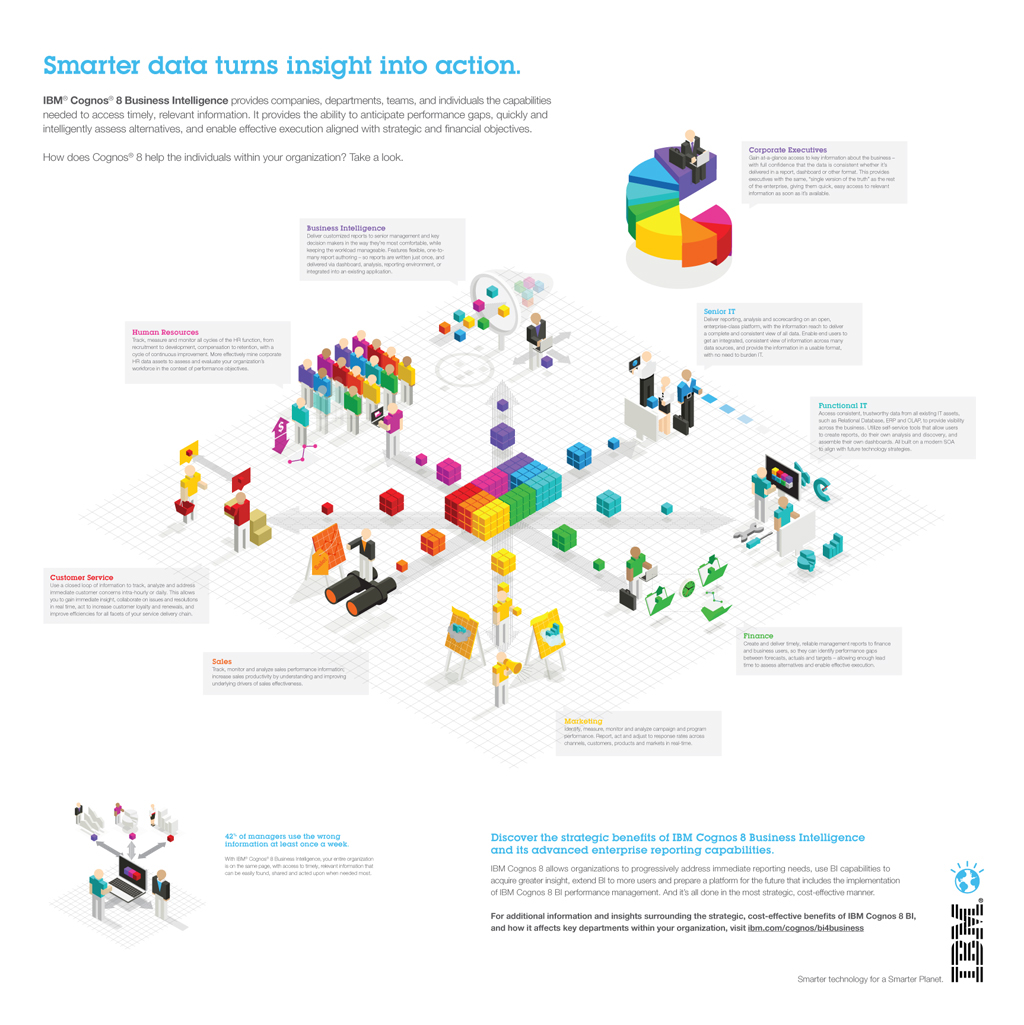

Ogilvy - IBM

Fast Company - NPR
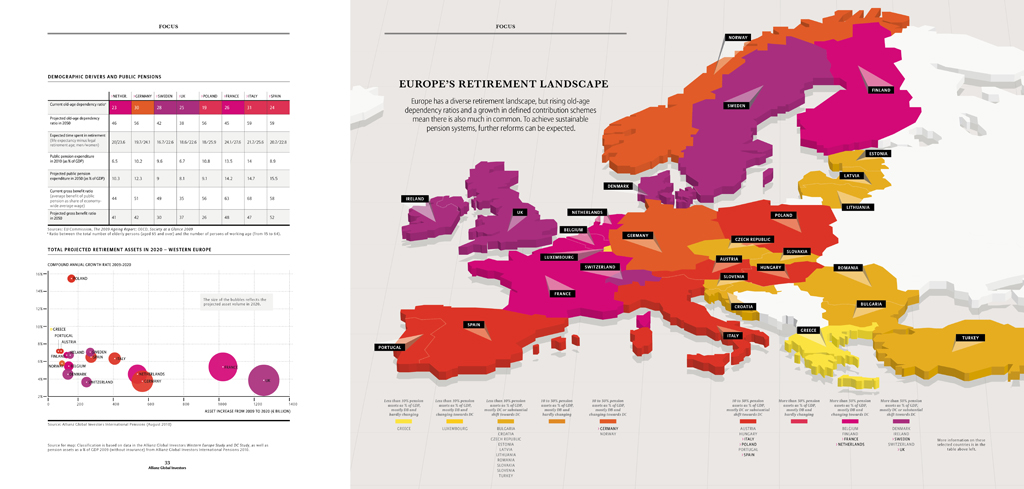

M Mag - Allianz
National Geographic
Infographics created for National Geographic. iPad editions were animated, done with help from our friends at GoGo Project.
Infographics created for National Geographic. iPad editions were animated, done with help from our friends at GoGo Project.

Undercurrent - Ford

SEED Magazine - Religion issue
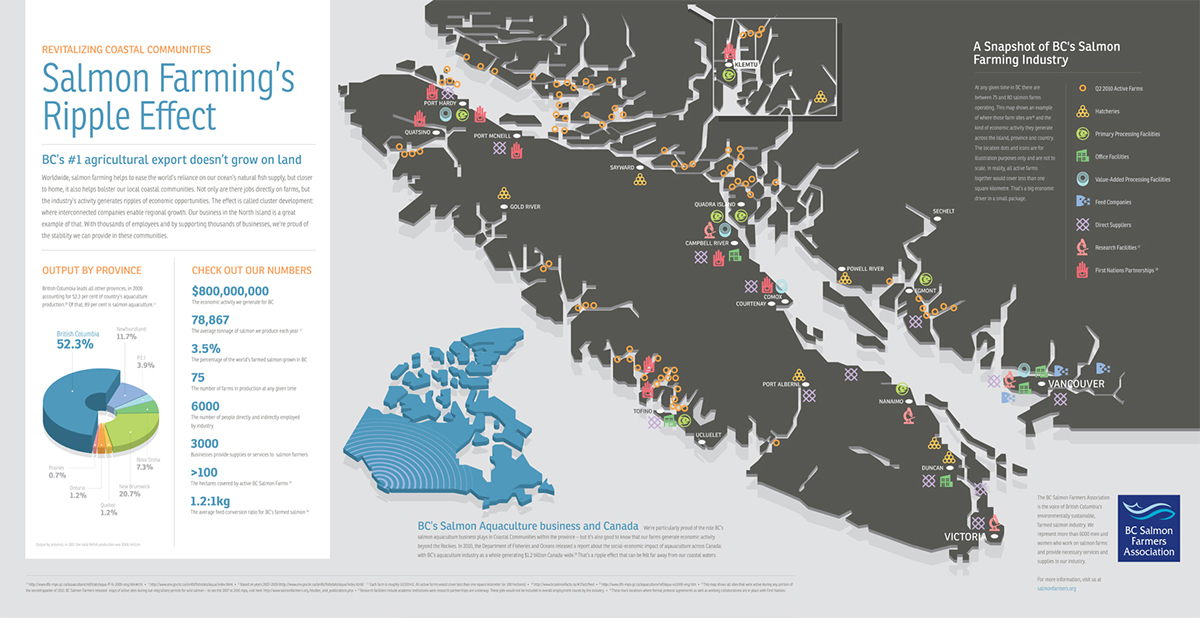
BC Salmon Farmer's Association


New York Times - Ideas Issue
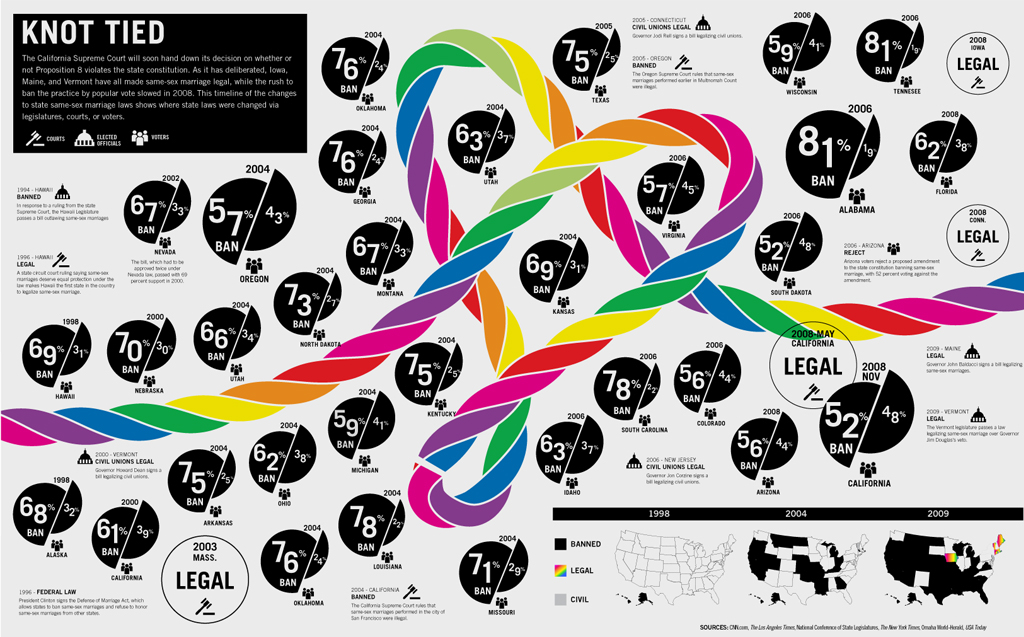
GOOD magazine - Gay Marriage statistics of US States.
