MATLAB | Simulink
Robot Configuration Space and Minkowski's sum
Computation of Robot's Configuration space by Using Minkowski's Sum algorithm. First the Robot vertices and Obstacle Vertices are given and stored in a *.csv file. The robot vertices and obstacle space are read from the *.csv file. A user then gives a value of orientation. The new transformation of robot's vertices is computed. The robot is oriented at 45 and 180 degrees to be used for Minkowski's Sum. Minkowski's Sum computes the Configuration space which is illustrated via a graphical representation within Matlab.

Robot's Orientation at 0 Degrees.

Robot's Orientation at 45 Degrees.

Robot's Orientation at 180 Degrees.
Laser Scanner
Laser Scanner graphical representation via Matlab. This simulates a point laser that begins at its source and collides with the wall generating hitpoints. The wall dimensions are given by the user, however the wall is not generated randomly rather its just the variation of lengths for the specific shape of the wall. The user inputs Wall vertices. Later transformation matrices are used for representing laser frame into global frame and vice-verca. The hit points are transformed from laser frame to global frame.

{G} represents global frame where as {L} represents laser frame. The z axis points normal to the monitor screen. The {L} has been rotated 45 degrees about z-axis w.r.t {G} frame.

Liquid Level Sensor
Using Matlab GUI
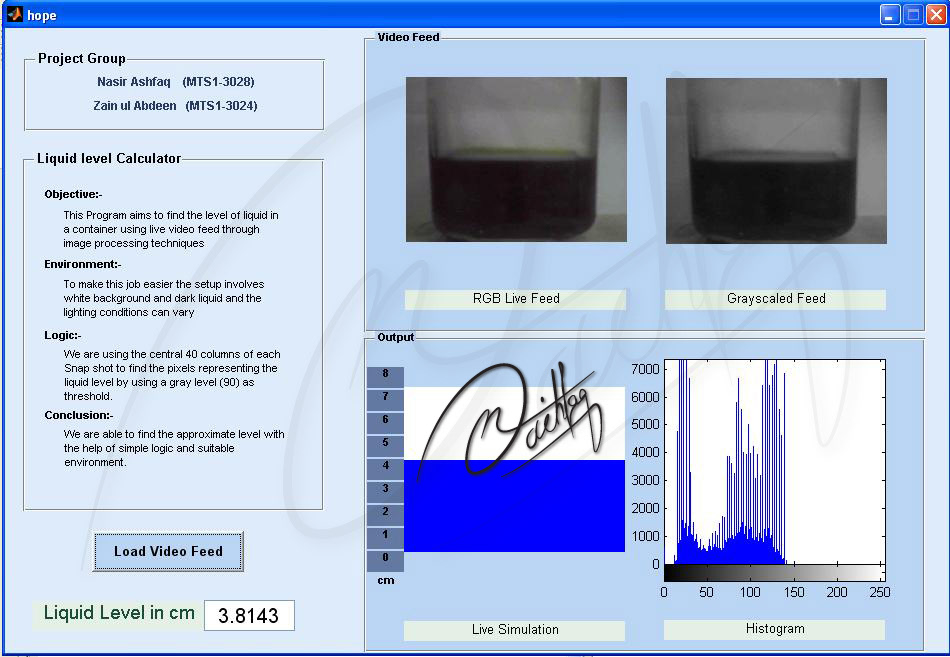
Image Processing Semester Project. The project was to measure the liquid level in a container.
Simulink Via MATLAB
Step Response of 4 Transfer Functions
Analysis of step response of 4 different transfer functions using Simulink.

Block diagram of different Transfer Functions

Step Response comparison of 4 different transfer functions via the scope block of simulink. T(s) can be best approximated by T3(s) because of almost same values for TP, smax and sfinal.
Unity Feedback System with a compensator
Analysis of step response of unity feedback system with a compensator.

Block diagram of unity feedback system with a compensator

Step response observed via simulation
Design of PD Controller
PD controller designed using root locus

Block Diagram of Compensated and Uncompensated Transfer-Functions

Un-compensated vs Compensated Step Response for PD Controller

Root Locus

Step Response for Un-compensated and Compensated
Ball Follower Robot PID Controller Design
A Differential drive robot whose motion is executed by two similar DC motors. The Characteristics of the angular speed response of the motors to their DC inputs are Settling time 2 <= sec, Overshoot <= 5% and Steady state error <=1%. The ball moves in a curved path for 5 sec. and stuck in a corner. We need to evalute the response of our compensated motors keeping in mind the vision sensor that is tracking the ball.

Robot Following seeking a ball Illusration. The ball gets stuck in the corner

The Controller Simulink Model for both DC motors

Step Response

System's Response
ICONNECT
Micro-Epsilon (http://www.micro-epsilon.com/)
Analog Chart (Signal Representation)

Sine, Sawtooth and Sqaurewave representation using three signal modules and Analog Chart (Graph) module
PulseGen

Modulation of Pulse Signal using Pulse Gen module.
Syncronous Graph Study

Synchronous graph study. Counters 17 Hz and 37Hz increment(+1) with a frequencey of 8Hz and at 18.5Hz respectively, counting from 0 to 32767. Both send their data to MultiCom module. The Sync recieves data through MultiCom module and use this data as input to "Interpret". The "Interpret" takes both the inputs and as soon as there is a high bit on either of the two inputs it increments in the sum. The running counter as result is basicly an addition of counters from
Odometry Simulation

Odometry Simulation using D-flip-flop (created via GAL module). Two channels A and B are represented and a slider for offeset inorder to observe the leading or lagging between the two channels. Q and Q' are high pulse time periods respectively.

Observations based on the simulation
Filtering Technique

Binary Filter
Graphical Demonstration of Convolution via ICONNECT
Convolution with kernel h(t) in the time domain can be also achieved via multiplication of the FFT(h) in the frequency domain. This has been simulated via Iconnect as under

Convolution Module blocks with Analog Signal Monitor
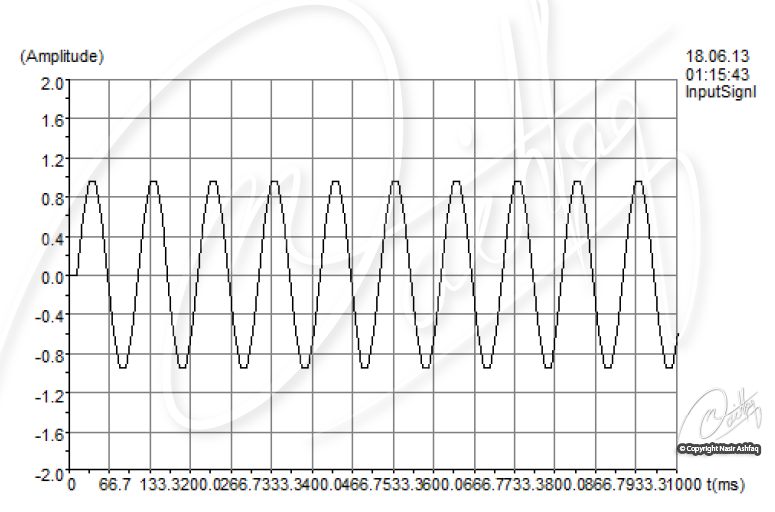
Input Signal

Impulse Response, Convolution and inverse FFT Signal Outputs
