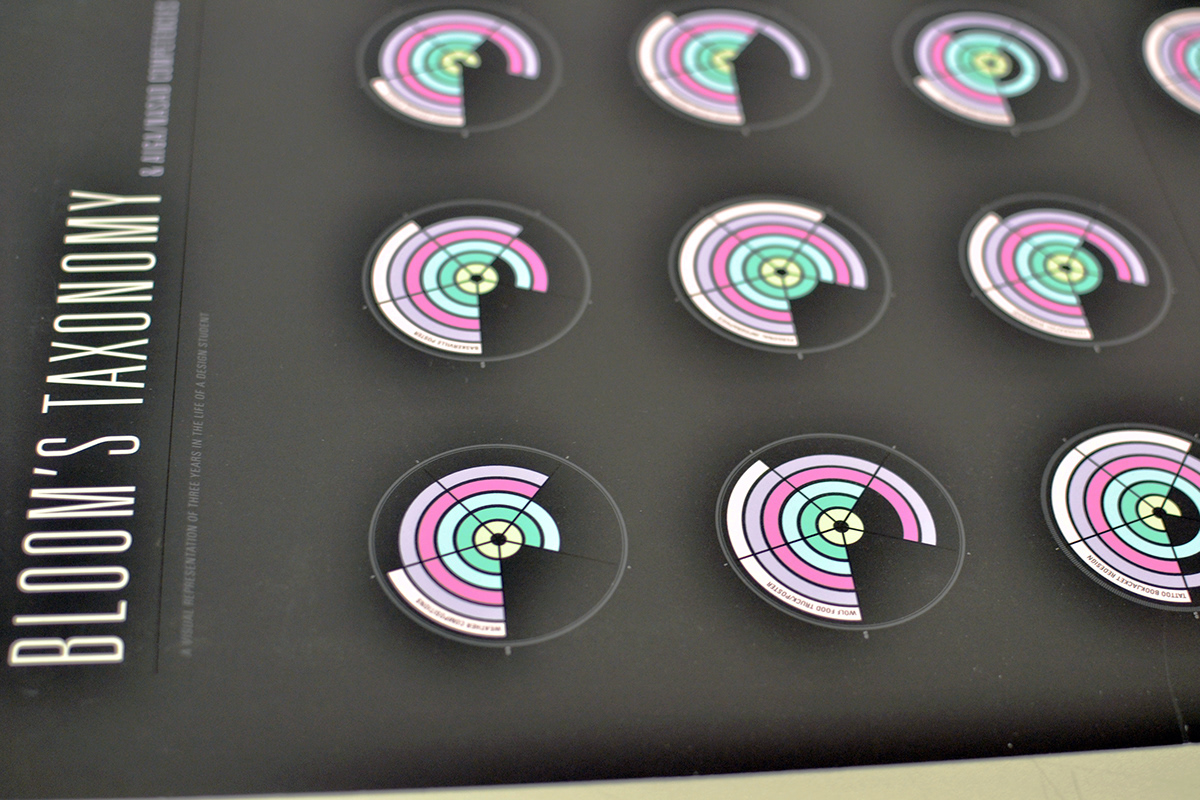
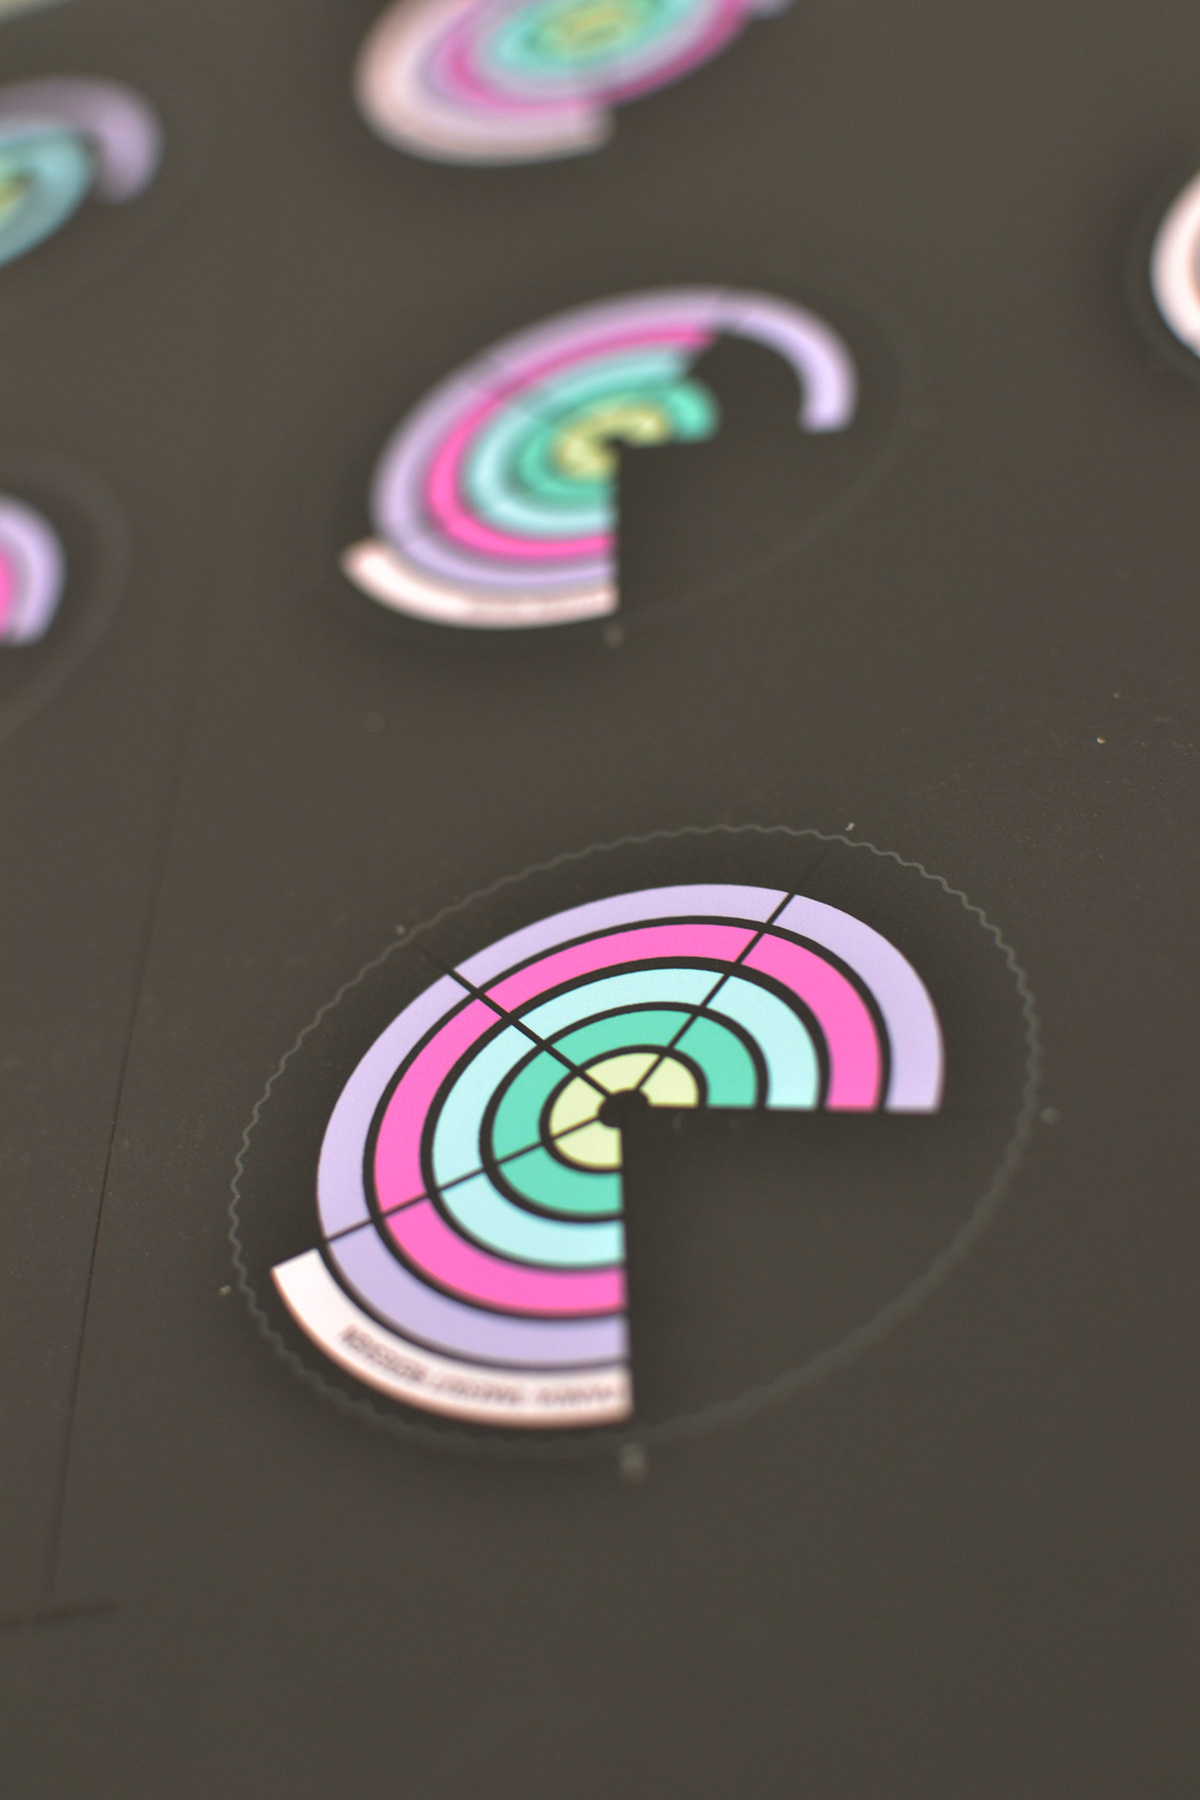
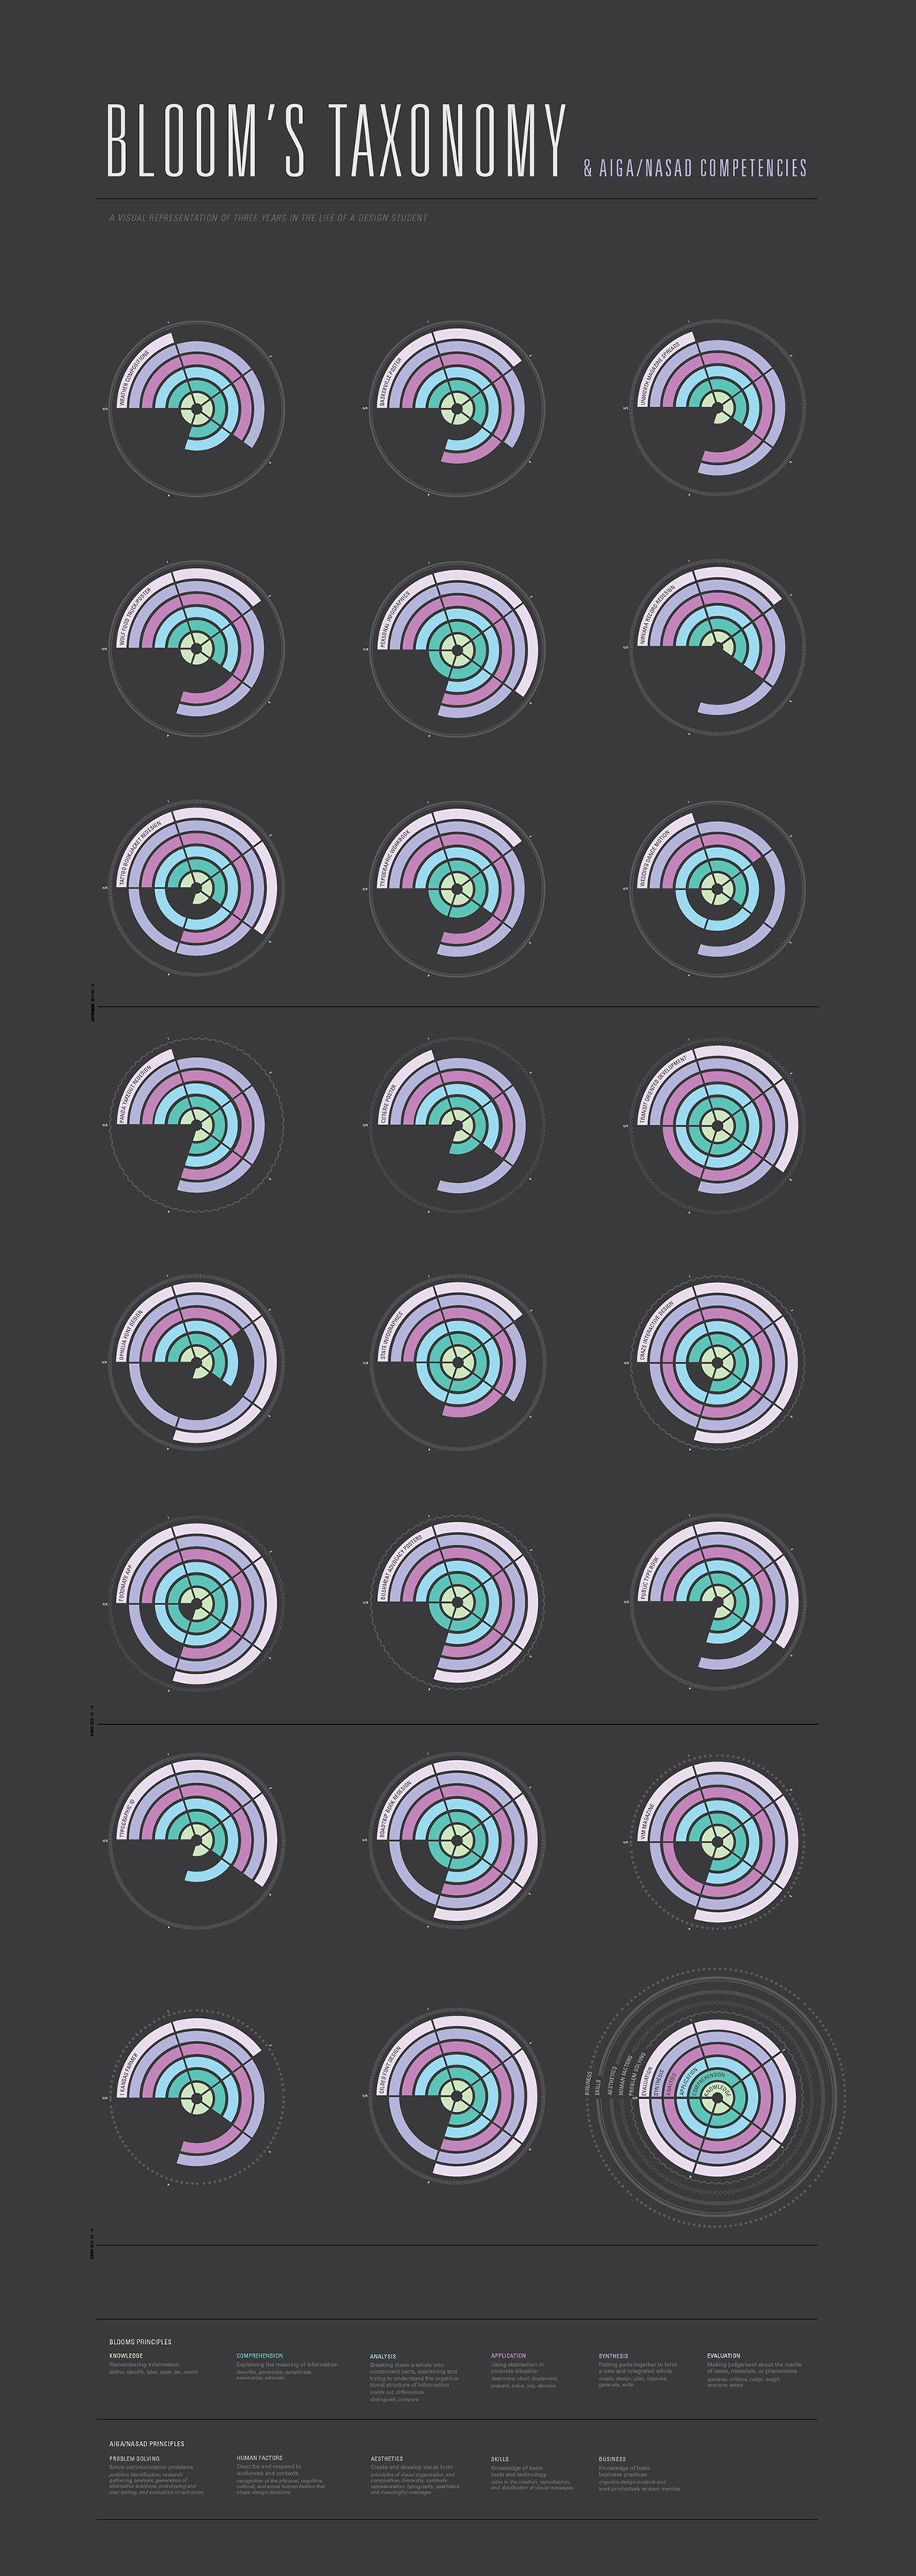
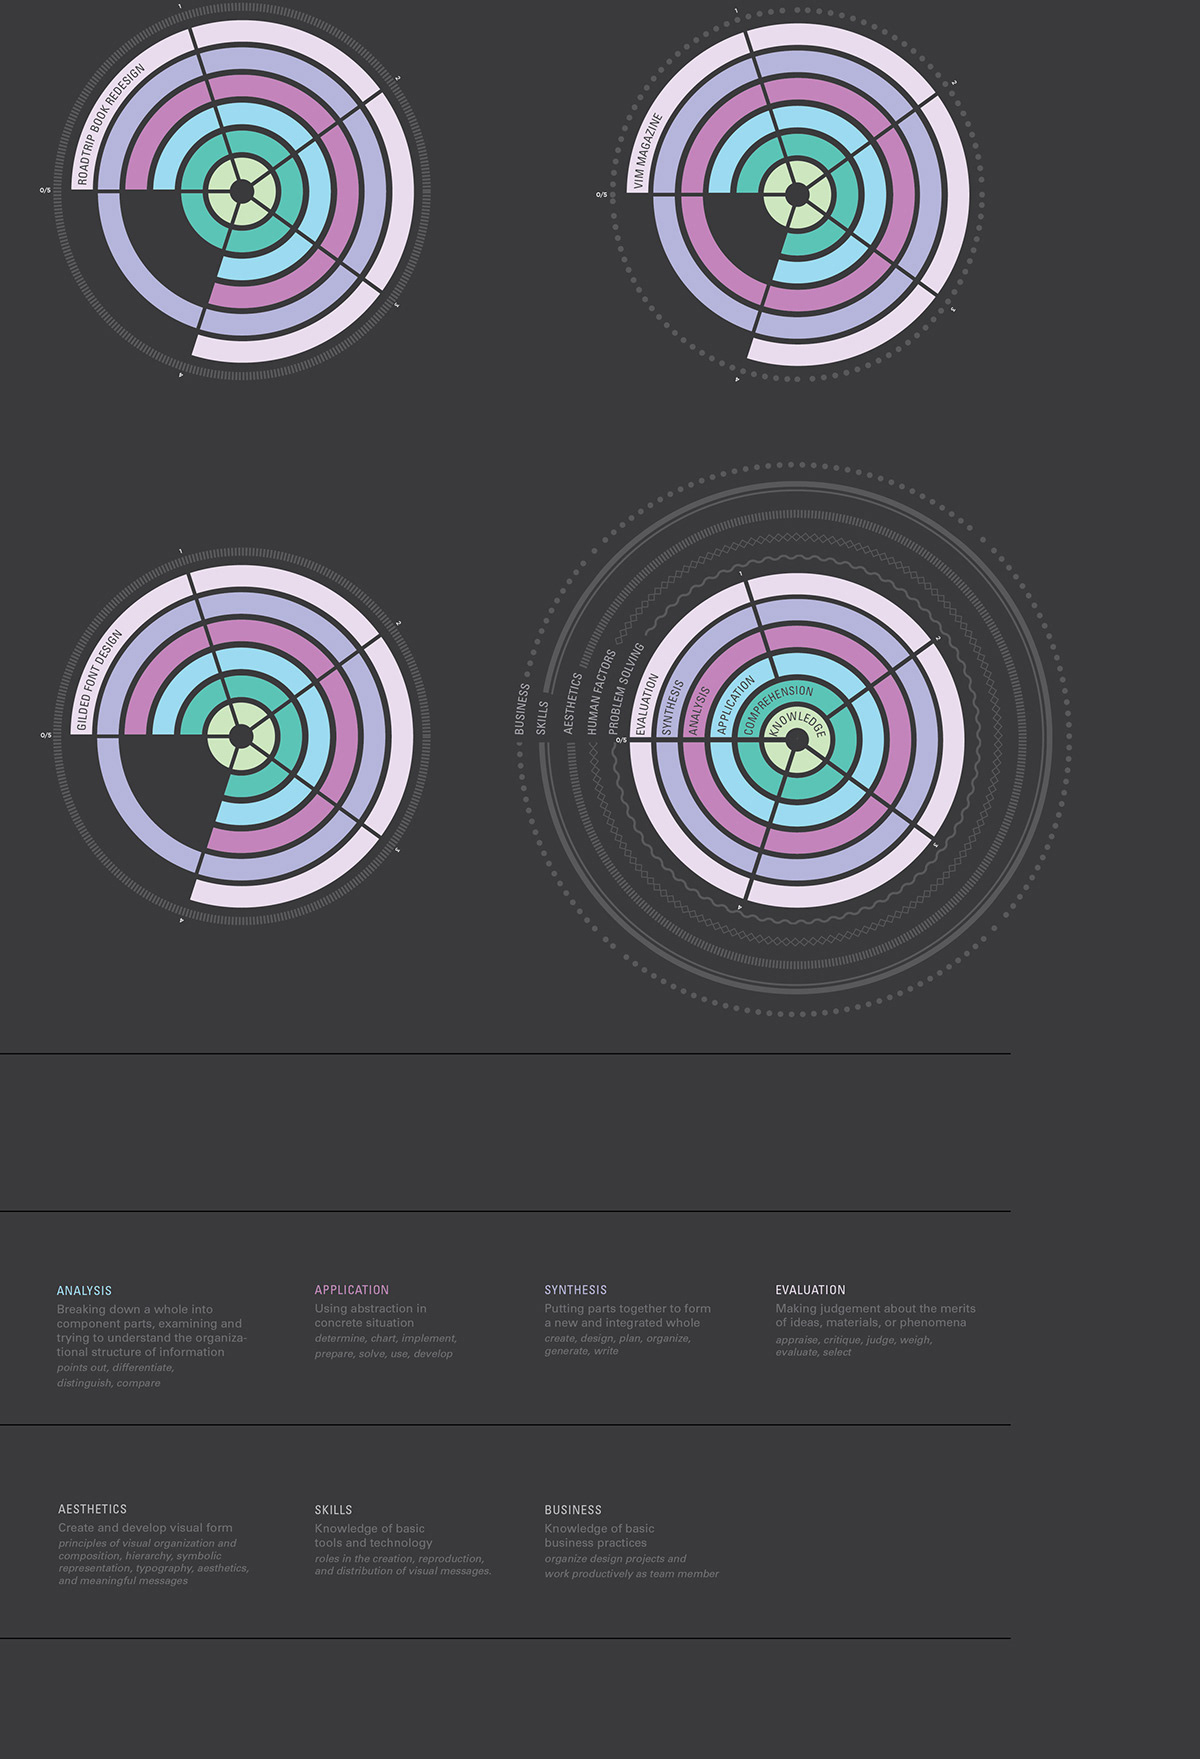
Using all the projects from sophomore to senior year in design, I created an infographic that quantifies the projects compentencies bases on Blooms Taxonomy and AIGA/NASAD.
Dołącz do Behance
Załóż konto, lub Zaloguj się,aby wyświetlić spersonalizowane rekomendacje, obserwować autorów i nie tylko.
lub
Dołącz do Behance
Załóż konto, lub Zaloguj się,aby wyświetlić spersonalizowane rekomendacje, obserwować autorów i nie tylko.
For this project we had to sum up our whole design education in an infographic that displayed our projects based on the Bloom's Taxonomy and AIGA Rozwiń