Strat () Columbus
Understanding cities through cyber-culture data with an overlay of ethereal sensibility.
Understanding cities through cyber-culture data with an overlay of ethereal sensibility.
Installation Project | 3-person group
Initial study in producing word clouds as a means of understanding societal interest on a variety of topics led to the use of Google as a lens in which cities may be interpreted through cyberspace presence. The graphing of top searched words throughout the year 2010, across thrity cities, showcased seasonal trends and implied information about each city when studied as a collective. The idea of cities as an agglomeration of stories was studied further through the digestion of Italo Calvino’s “Invisible Cities” in which Marco Polo uses the telling of stories about pseudo cities as a disguise for expressing thoughts about his home city of Venice to the Emperor Khan. Disguise and the use of experiences to define a place began to be thought of as relating to clouds, this time in the physical sense. Research and mapping of clouds across the United States became an additional device in which to study cities. Part to whole relationships became an apparent theme in the research, where clouds, similar to the way in which city is related to globe, may be understood on both an individual level having unique qualities within types, as well as the broad level as an atmospheric effect. Inspired by this research, Strat () Columbus strives to act as an informative mask that derives from numerical data, while providing sensuous qualities that speak to the city of Columbus, Ohio.
Location: Knowlton School of Architecture main space
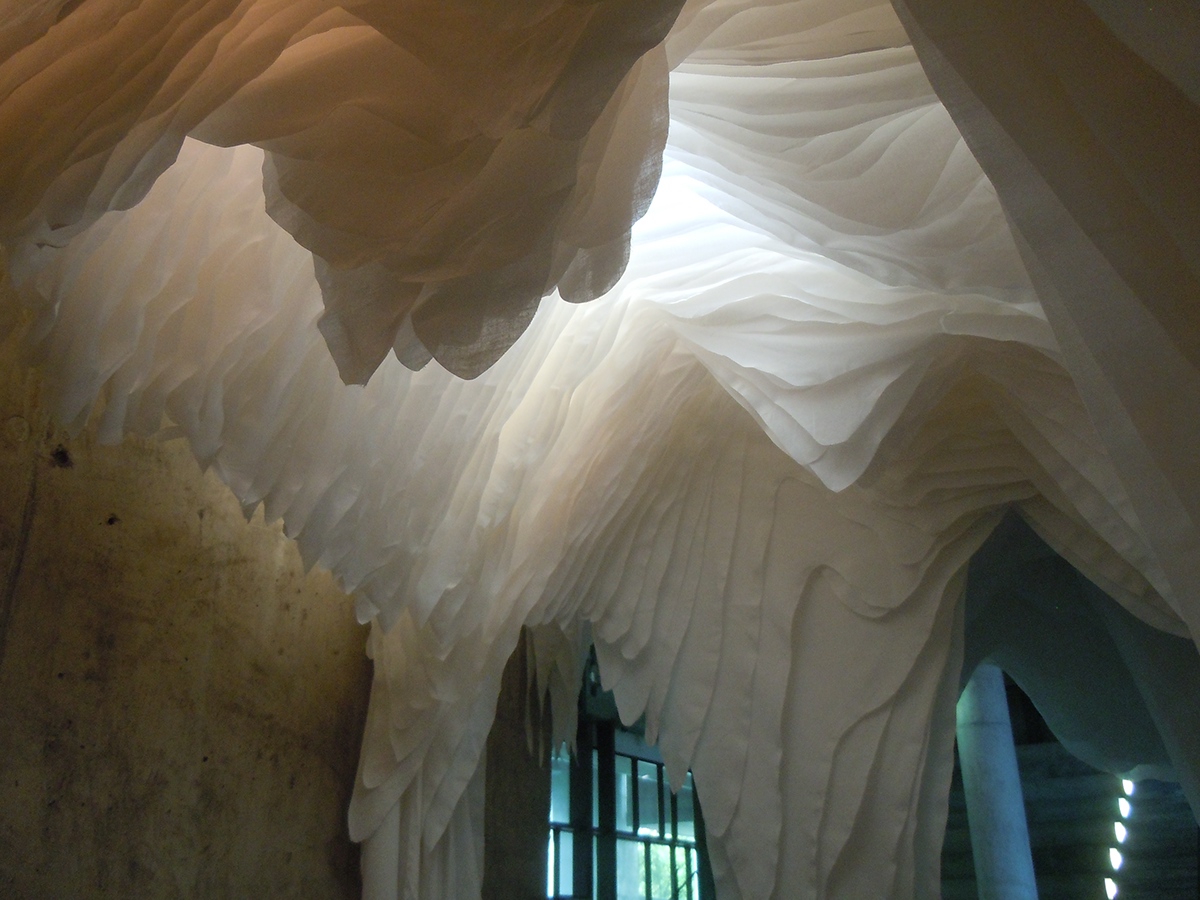
Inside the cloud(s)

Research and Inspiration

Word cloud representing relevance of given sustainable keywords, as searched online by residents of Columbus, OH
The Google Zeigheist list for 2010 registers words searched throughout that year by volume and uniqueness. The City by City option offers a look at 31 cities in 2010 and their top searched words. The top words come to define cities in Google's terms; the words ranging from simple searches of local facilities to institutions in the city, demonstrate a dominion of these searched parties over the digital geography of the city. The footprint of these searches leaves behind a new city, rediscovered by these arising digital maps.

Google Zeitgeist 2010, six example cities out of 31 graphed

The chart reflects the number of Google hits the "e street cinema" had by residents of Washington D.C. during 2010. The peaks showcase popularity during particular months while the averaged information reveals trends throughout the year.
“Kublai Khan does not necessarily believe everything Marco Polo says when he describes the cities visited on his expeditions, but the emperor of the Tartars does continue listening to the young Venetian with greater attention and curiosity than he shows any other messenger or explorer of his.”
Invisible cities is the story told by Marco Polo to Kublai Khan. The various cities Polo describes to the emperor seem to all be very different, but we later learn that all the stories make up the singular city of Venice. Albrecht Durer in techniques of the observer gives an insight into this effect in a much different manner. When the parts make up the whole through a carefull techniques. The story of invisible cities can be intrepreted just as that; where the individual parts are of their own and just as essential to the whole.

Study and reinterpretation of Italo Calvino's Invisible Cities
The study about invisible cities surveys the individual stories of Italo Calvino; through close observation we see different aspects that make up cities and themes that go beyond the physical realm. The arbitrarily selected images to acompany the stories invite a certain doubt about representation, a doubt similar to realities of Polo’s story telling to Khan. The physical reality of the images provided by a digital tool allow the stories to exist in a realm that negotiates the physical and the digital.
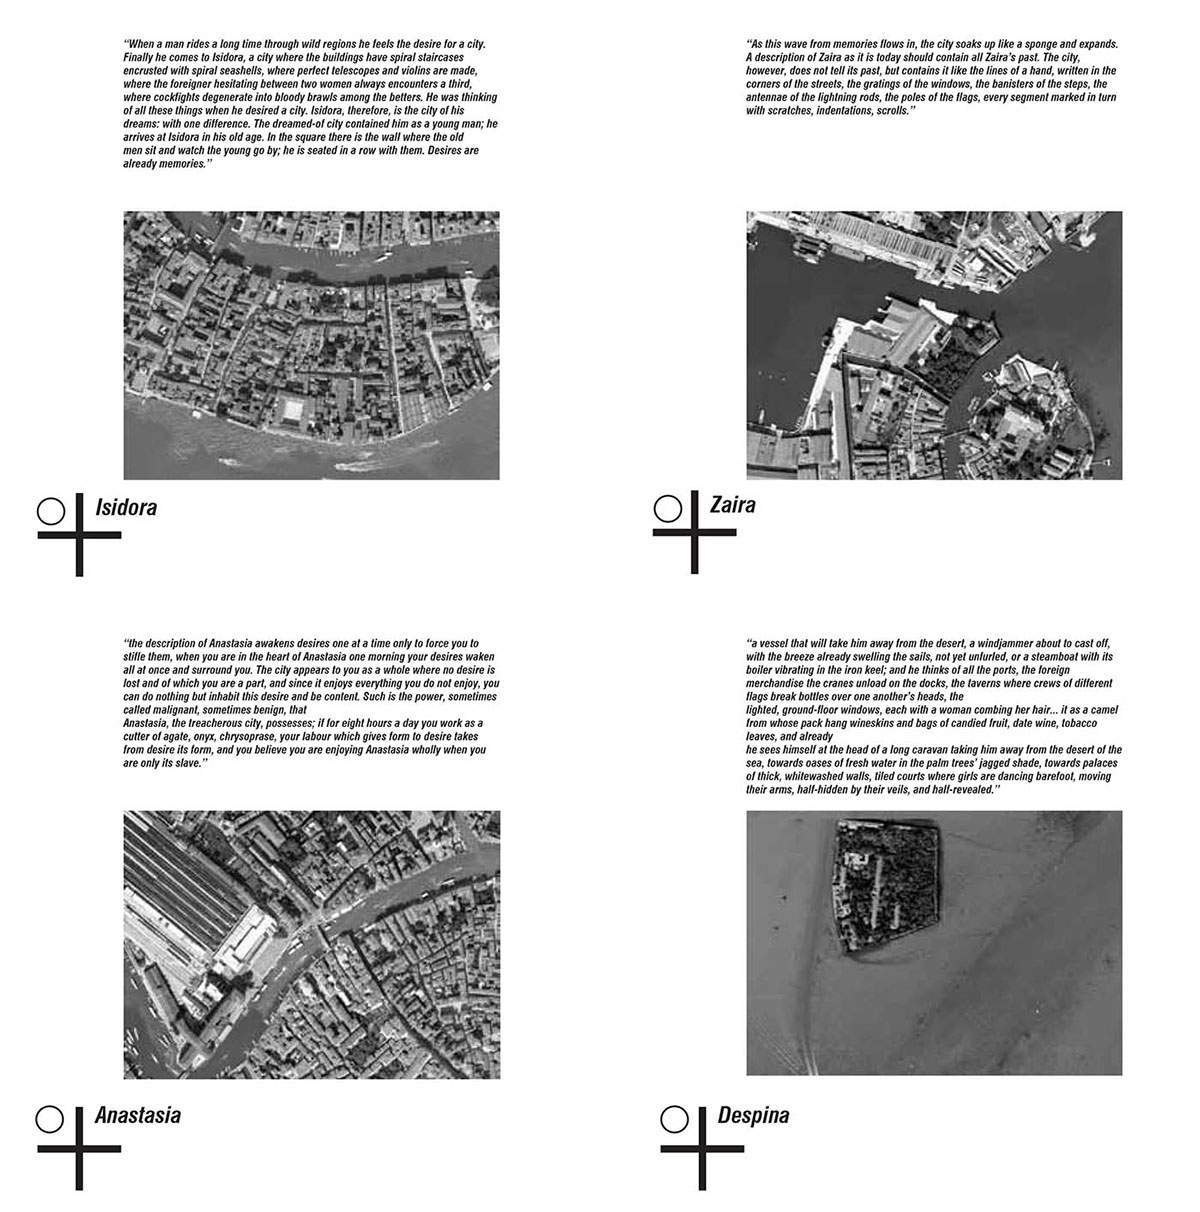
Excerpt of Invisible Cities mapping
The initial study regarding data cloud formation supplemented by Google led to the research of physical clouds. Clouds in the atmosphere although at times may look similar, possess individuality within them. The various cloud formations depend on altitudes, terrain, temperatures, wind speeds and other physical factors. Cloud formations are a physical manifestation dealing with place. The different forms of clouds being tied to the physical environment vary with periods. The physical environment changes throughout the years by various means, natural seasons, man-made terrains or other changes that may occur in the physical realm. Cloud formations may reflect some of these changes, where some cloud types may be extinct because of the environmental requirement for them to exist changes.

The 27 cloud states are assigned a unique international symbol, recognized and utilized by meteo- rologist and aviators as form of rapid visual shorthand and when reporting the state of the sky.

Excerpt of a cloud taxonomy study
Implementing Interpretations
A combination of information about the cloud typologies and the Google Zeigheist cities can be interpreted as in relation to one another. While the clouds manifest as a response to the built environment and the existing ecosystem, the hidden cities of Google Zeigheist exist in a digital environment. These two environments oscillate in time, interacting between their two mediums.

Superimposing Google's Zeitgeist cities with their geographically related cloud studies

Two example cities showing implementation of transfering data to 3-D model
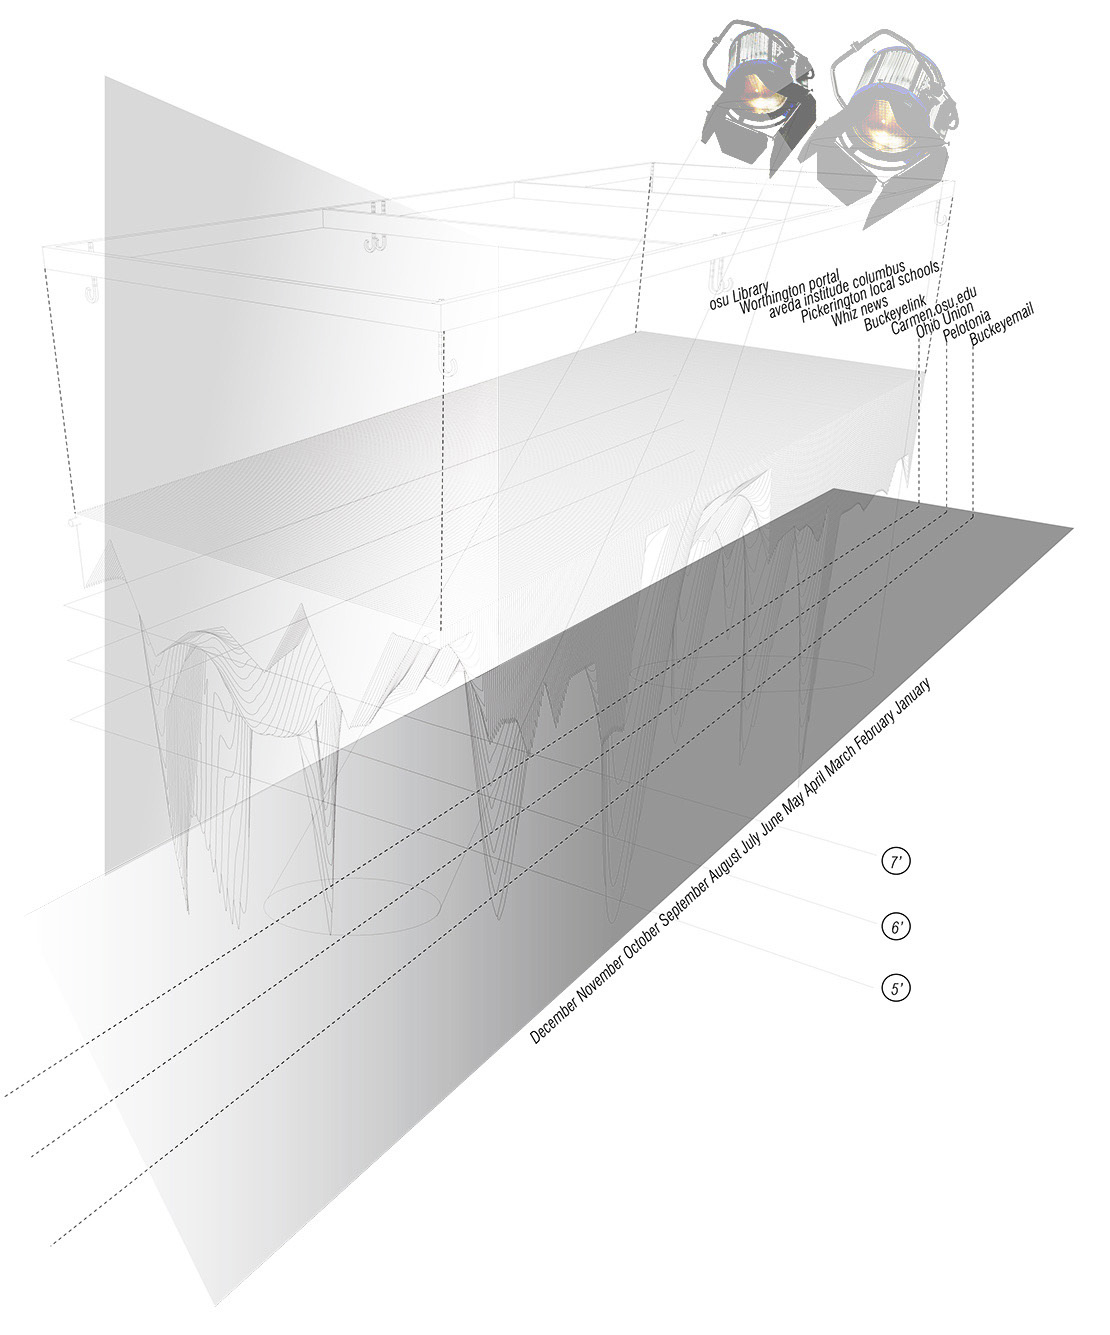
The data relating to Columbus, OH was selected to develop into an installation. The surface produced by the obtained data can be manipulated in various manners while still being sensitive to the information it represents. The following procedures operate on the surface to obtain various effects. Taking into account the different precedents studied, the surface is to be treated as a spatial object, one that you can transverse, affect and be affected by it.

Studies of a surface within a space
The spatial qualities of the surface are limited to its contour. However, the projections allow for a similar spatial experience yet more interactive and responsive to light. By making a structure composed of the data involving the cities, this same structure has the potential of projecting information into the space being ocupied.

Implementing depth to establish an environment
Digital tools were used to explore arrayed effects of surface and depth. Model making and the use of CNC printers in conjunction with laser cutters was necessary to understanding construction opportunities.

Physical model studies
The grided nature of the surface’s inception works in favor of the waffled system. The grid can be easily analyzed through various operations in section and plan. Furthermore, it allows for this analysis to be compartmentalized within the grid.

The plan diagrams express the reading of Columbus's represented information, cavities within the model that allow user passage, and the programatization of the grid to clouds formations, dictated by local weather patterns.
The static nature of the grid makes it operate in the conceptual realm, however in the physical world a pleasant spatial experience can be supplemented with the benefits of the grid. The proposed project operates in the axis where the grid thrived the most. The data surface is composed in a time period. This period when analyzed one by one shares an insight into all the aspects affected. By analyzing the data surface throughout its beginning and end [365 days] we can begin to trace the inception of the hidden cities that lies within them. The transformation of the individual parts into the whole is to be experienced spatially by a user.
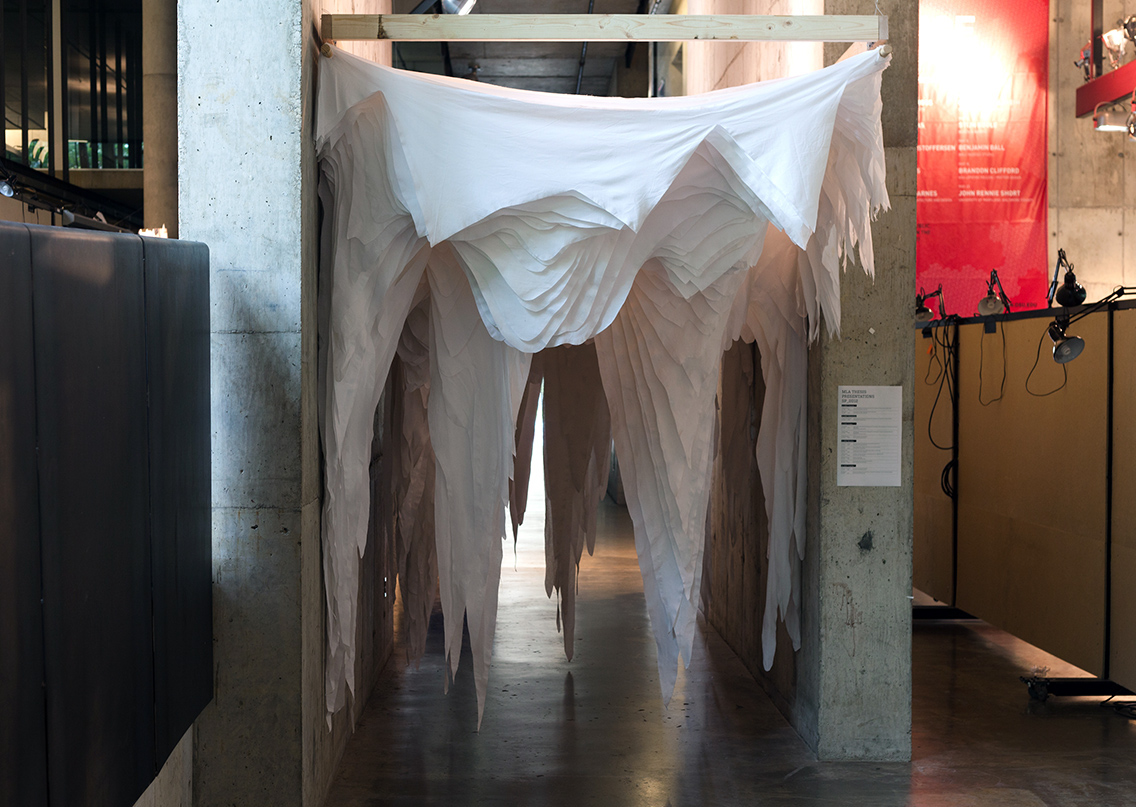
Compositional perspective of installation proposal
The installation consist of 365 cut pieces that make up the data surface. Each piece is cut from fabric and is susceptible to temporary transformation by the elements of light, wind and users.
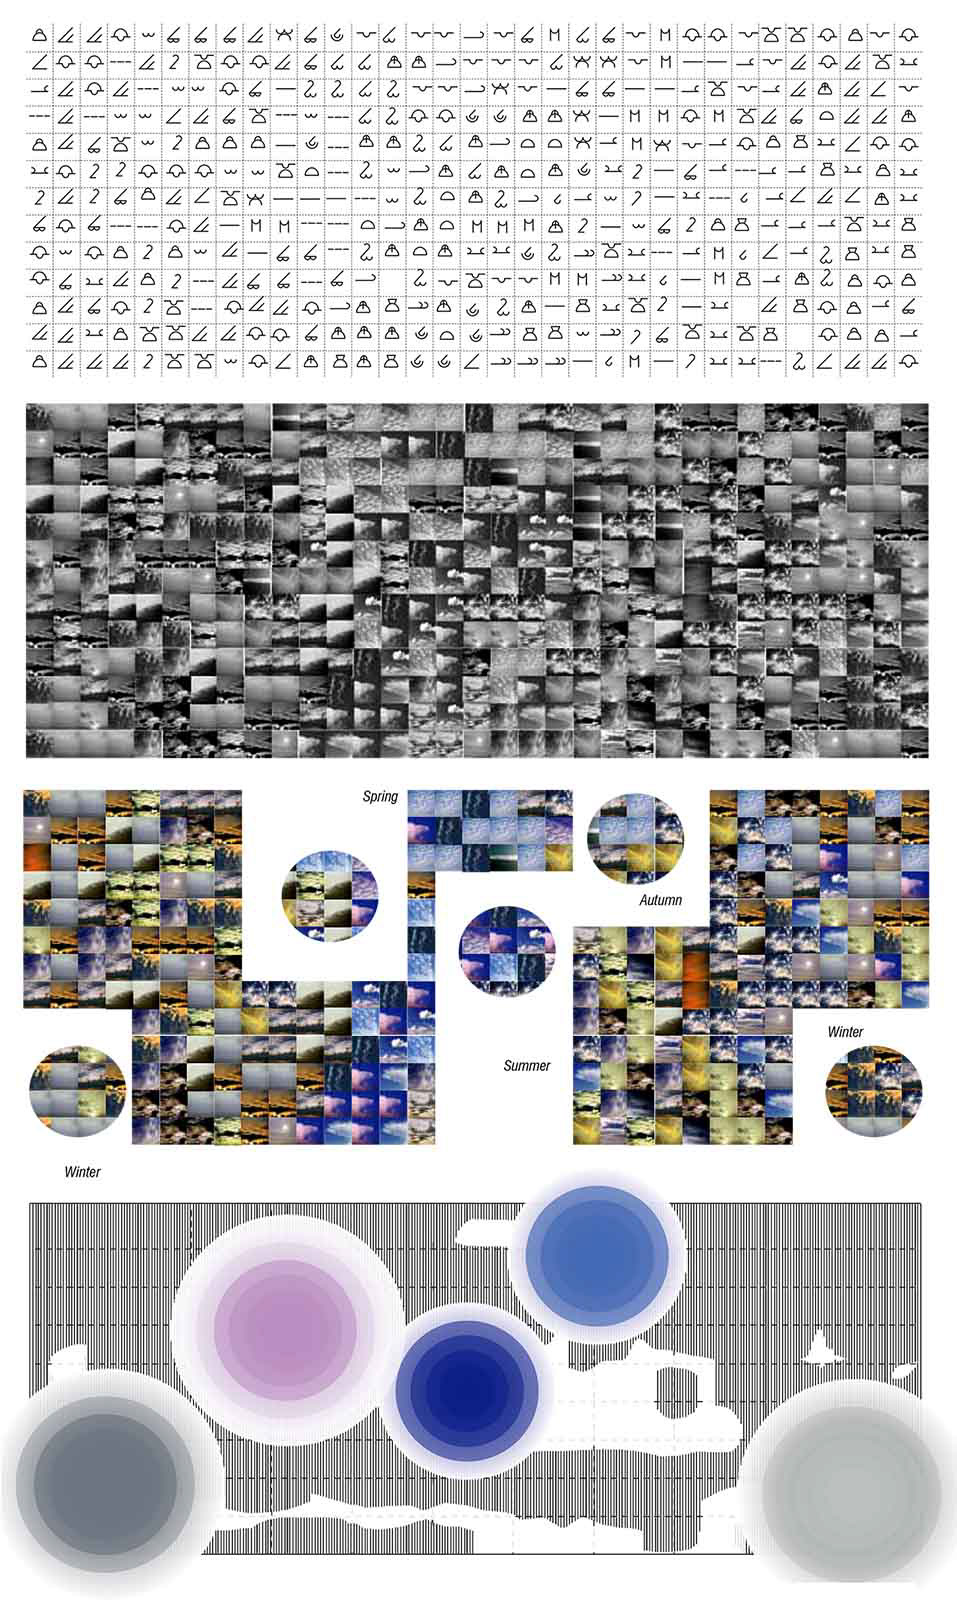
Organizing cloud taxonomy within the gridded structure of the installation allowed for colorization to become the representation of Columbus's atmospheric trends
Building the Installation

To produce the installations pieces that measure 6ft wide by up to 8ft tall, a large-scale cutting board was created from coated chipboard and mounted onto available wall space. Fabric was then mounted to the board using an adhesive spray.
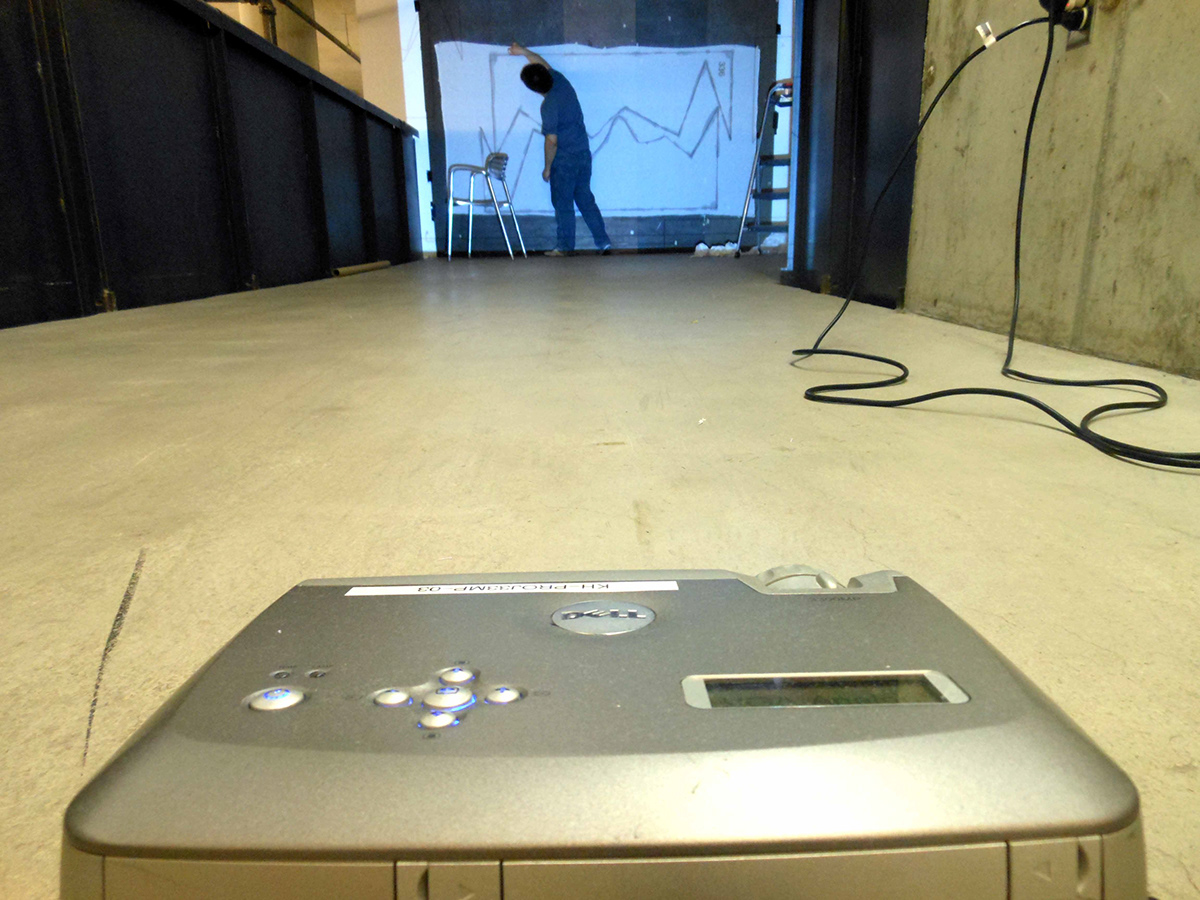
A projector was used to display section drawings of each piece, with its distance maintained to ensure consistency of scale.
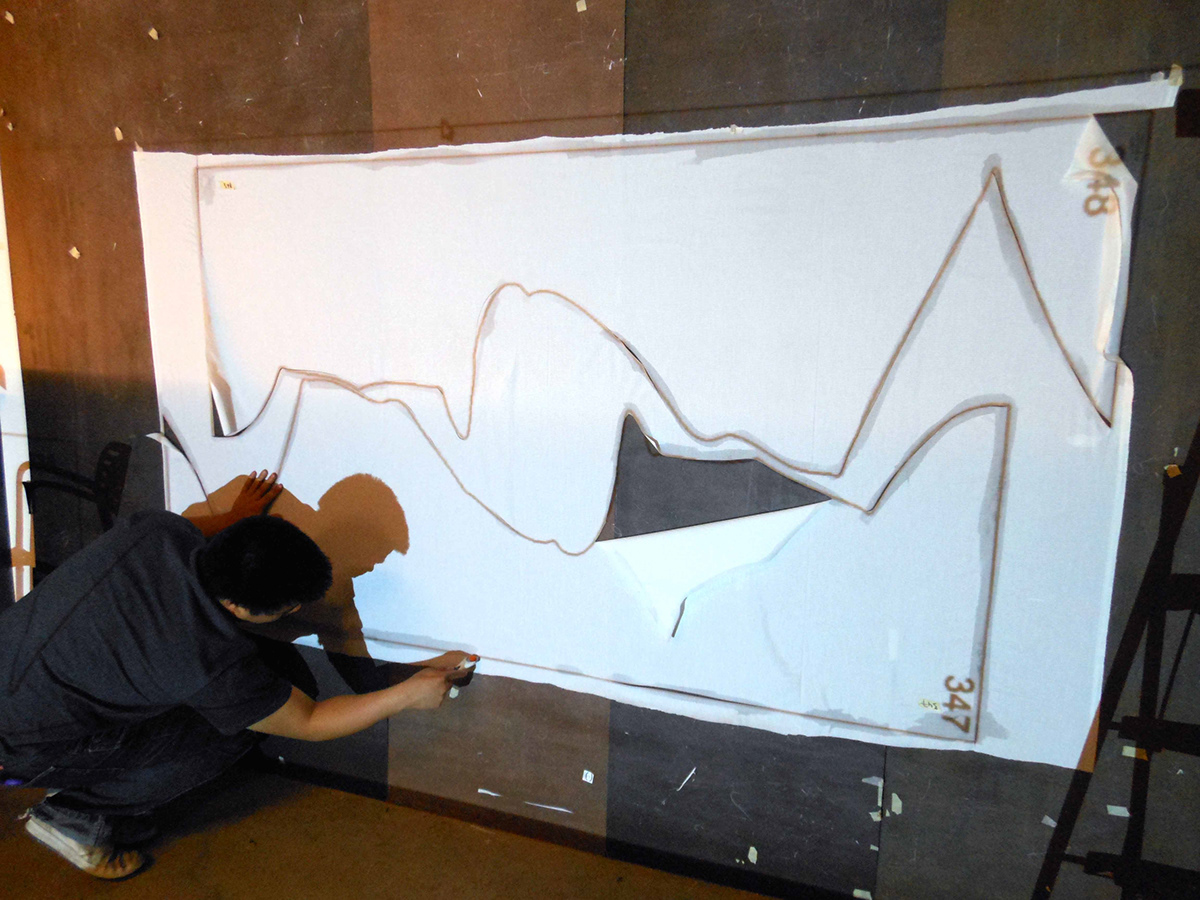
Sections were digitally arranged in groups according to the capacity of the cutting board to facillitate conservation of material and time. Diluted glue was applied to cut lines to prevent fraying of the fabric. A rotary cutting tool provided smooth, accurate cuts.

2" cross-slits were cut into the left and right corners, then the pieces threaded together with dowel rods. A vertical steam iron was used to remove distracting wrinkles.

A 16ft by 6ft frame made with 2x4's was built and installed on site, fitted between two sheer walls. Cables were attached to each corner and connected to upper-level infrastructure to provide additional support. Spotlights were placed according to our seasonal-trend diagram and colored transparencies were installed in their covers to promote a sense of time. Motion-detectors were also connected to each of the five lights to create an opportunity for user activation of the installation.


