Budapest POP-UP Book
By creating this pop-up book my goal was to use a simple way of paper folding combined with classical diagrams. These well-known two dimensional diagrams and charts are the most common and overused forms of representing annual reports. So, I decided to create something simple but expressive to refresh their conventional forms. I put them into three dimensions and I’ve chosen data about my city, Budapest, such as area, population, orography and natural water supply.

It shows the relations between Hungary and Budapest first concerning the population, then below the same referring to the area of Budapest.

It shows the relations between the population and the area of the districts of Budapest: horizontally it visualises the area and vertically the population.
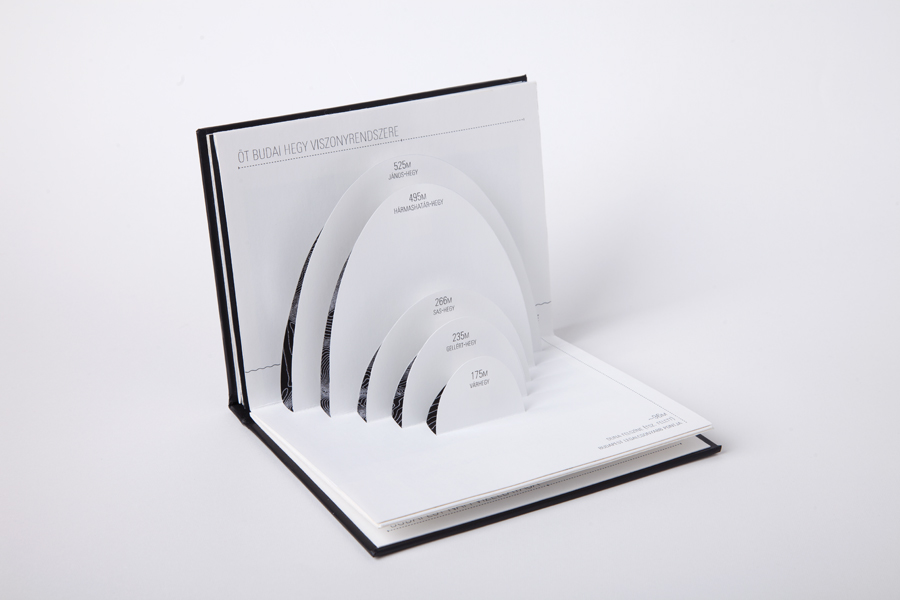
Budapest is divided into two parts (Buda and Pest) by the river Danube. I’ve chosen the hillside, Buda, and decided to show the heights of five popular hilltops from the lowest to the highest.
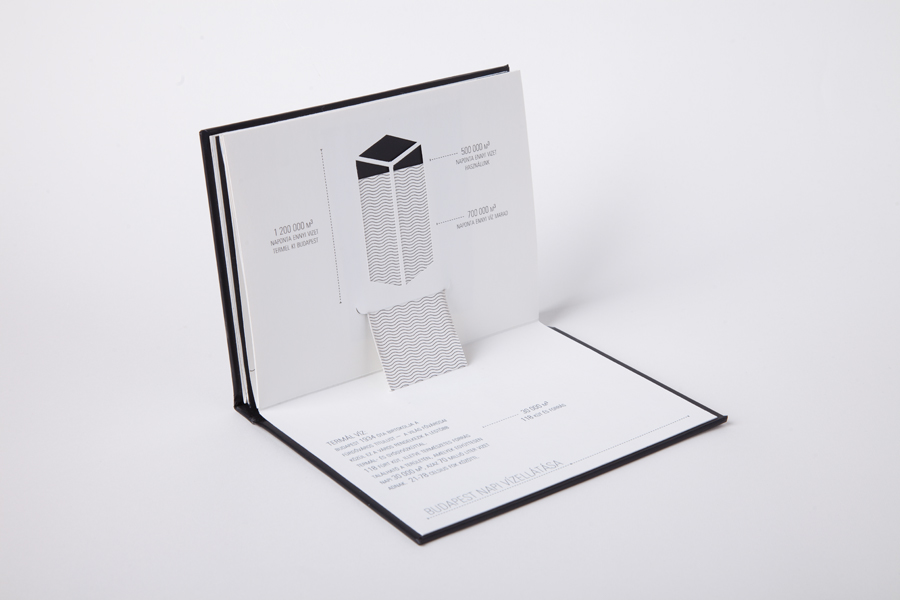
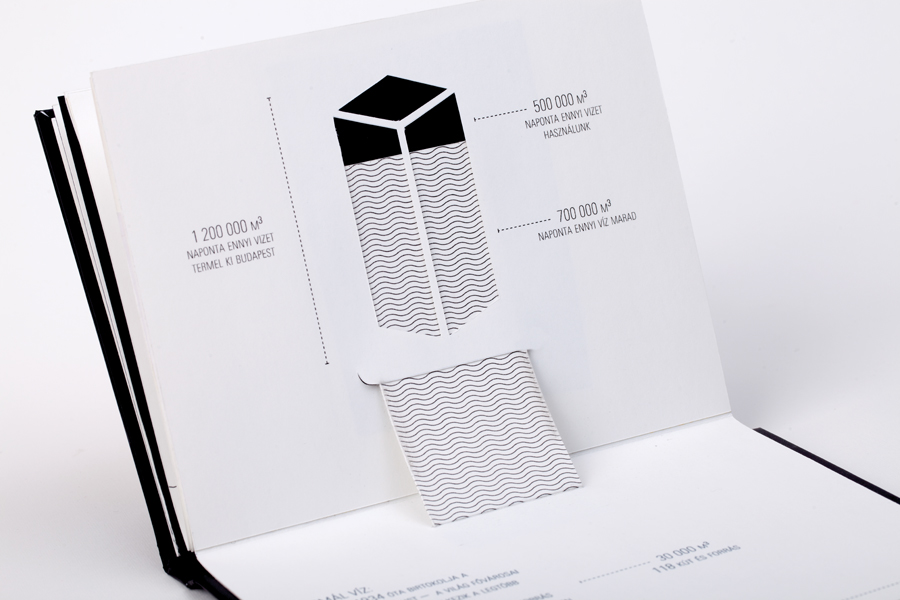
The last graphics aims to show the water supply of Budapest. The diagram of water consumption is changing by the opening of the spread. Also on this spread one can learn about the huge amount of spring water that the capital city has.