A classroom project to understand Information Design and using the data for an awareness campaign. The recently held assembly elections in 2013 was given as our main topic and I chose representativeness of the MLAs in Delhi, Rajasthan and Chhattisgarh as my data. A lot of iterations were done to best represent the data. I finalized on a horizontal graph.
Feedback is totally welcome, would like to improve it more, especially the data representation. :)
Please appreciate if you like the project. :D
Feedback is totally welcome, would like to improve it more, especially the data representation. :)
Please appreciate if you like the project. :D
Iterations of the data representaiton

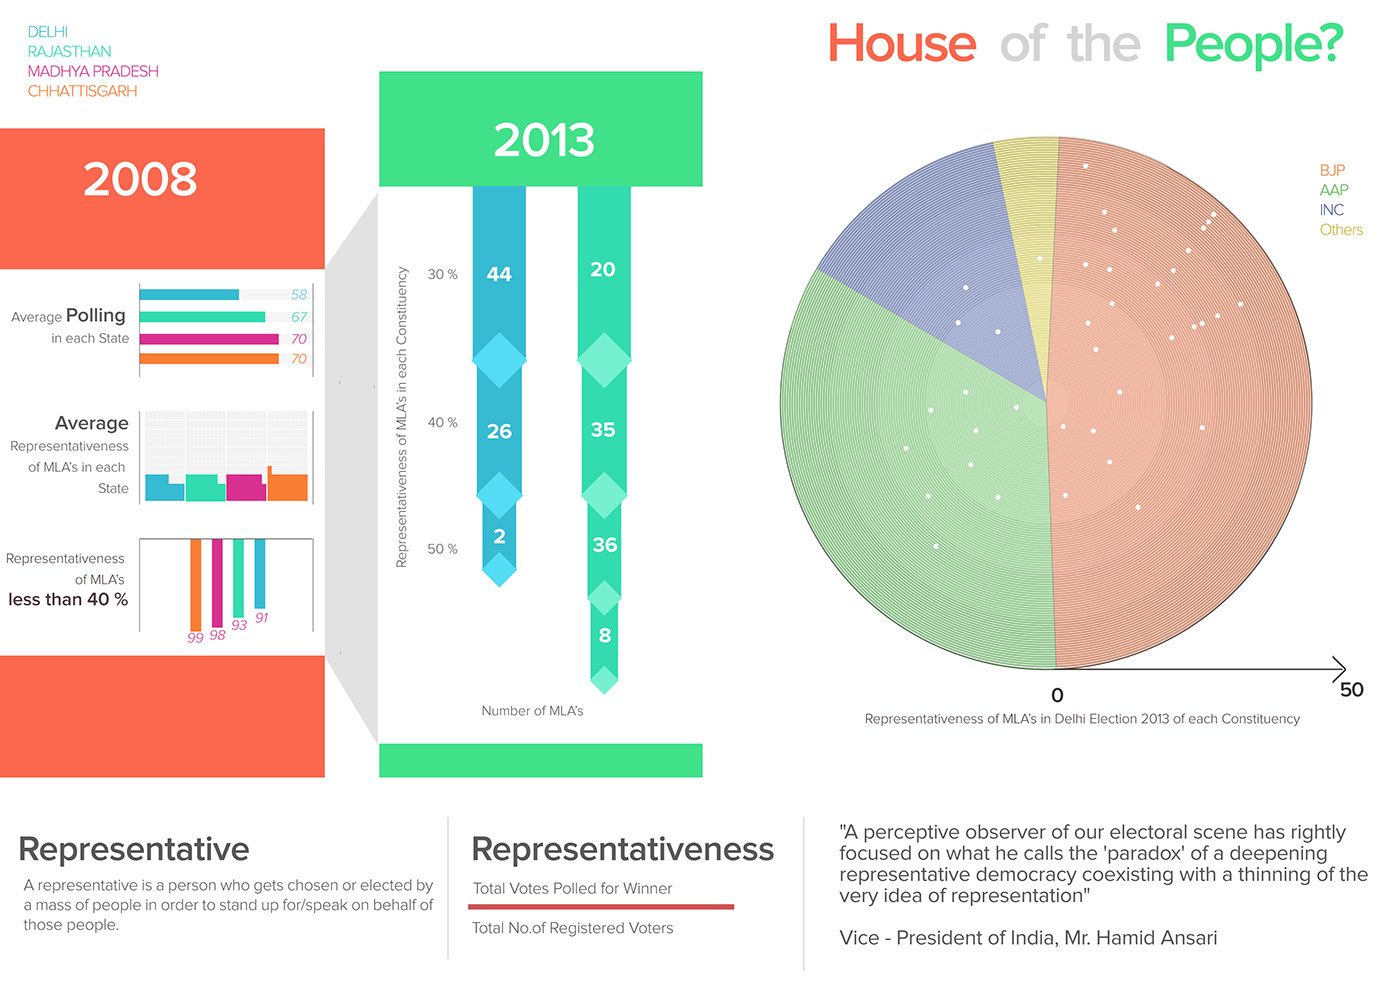

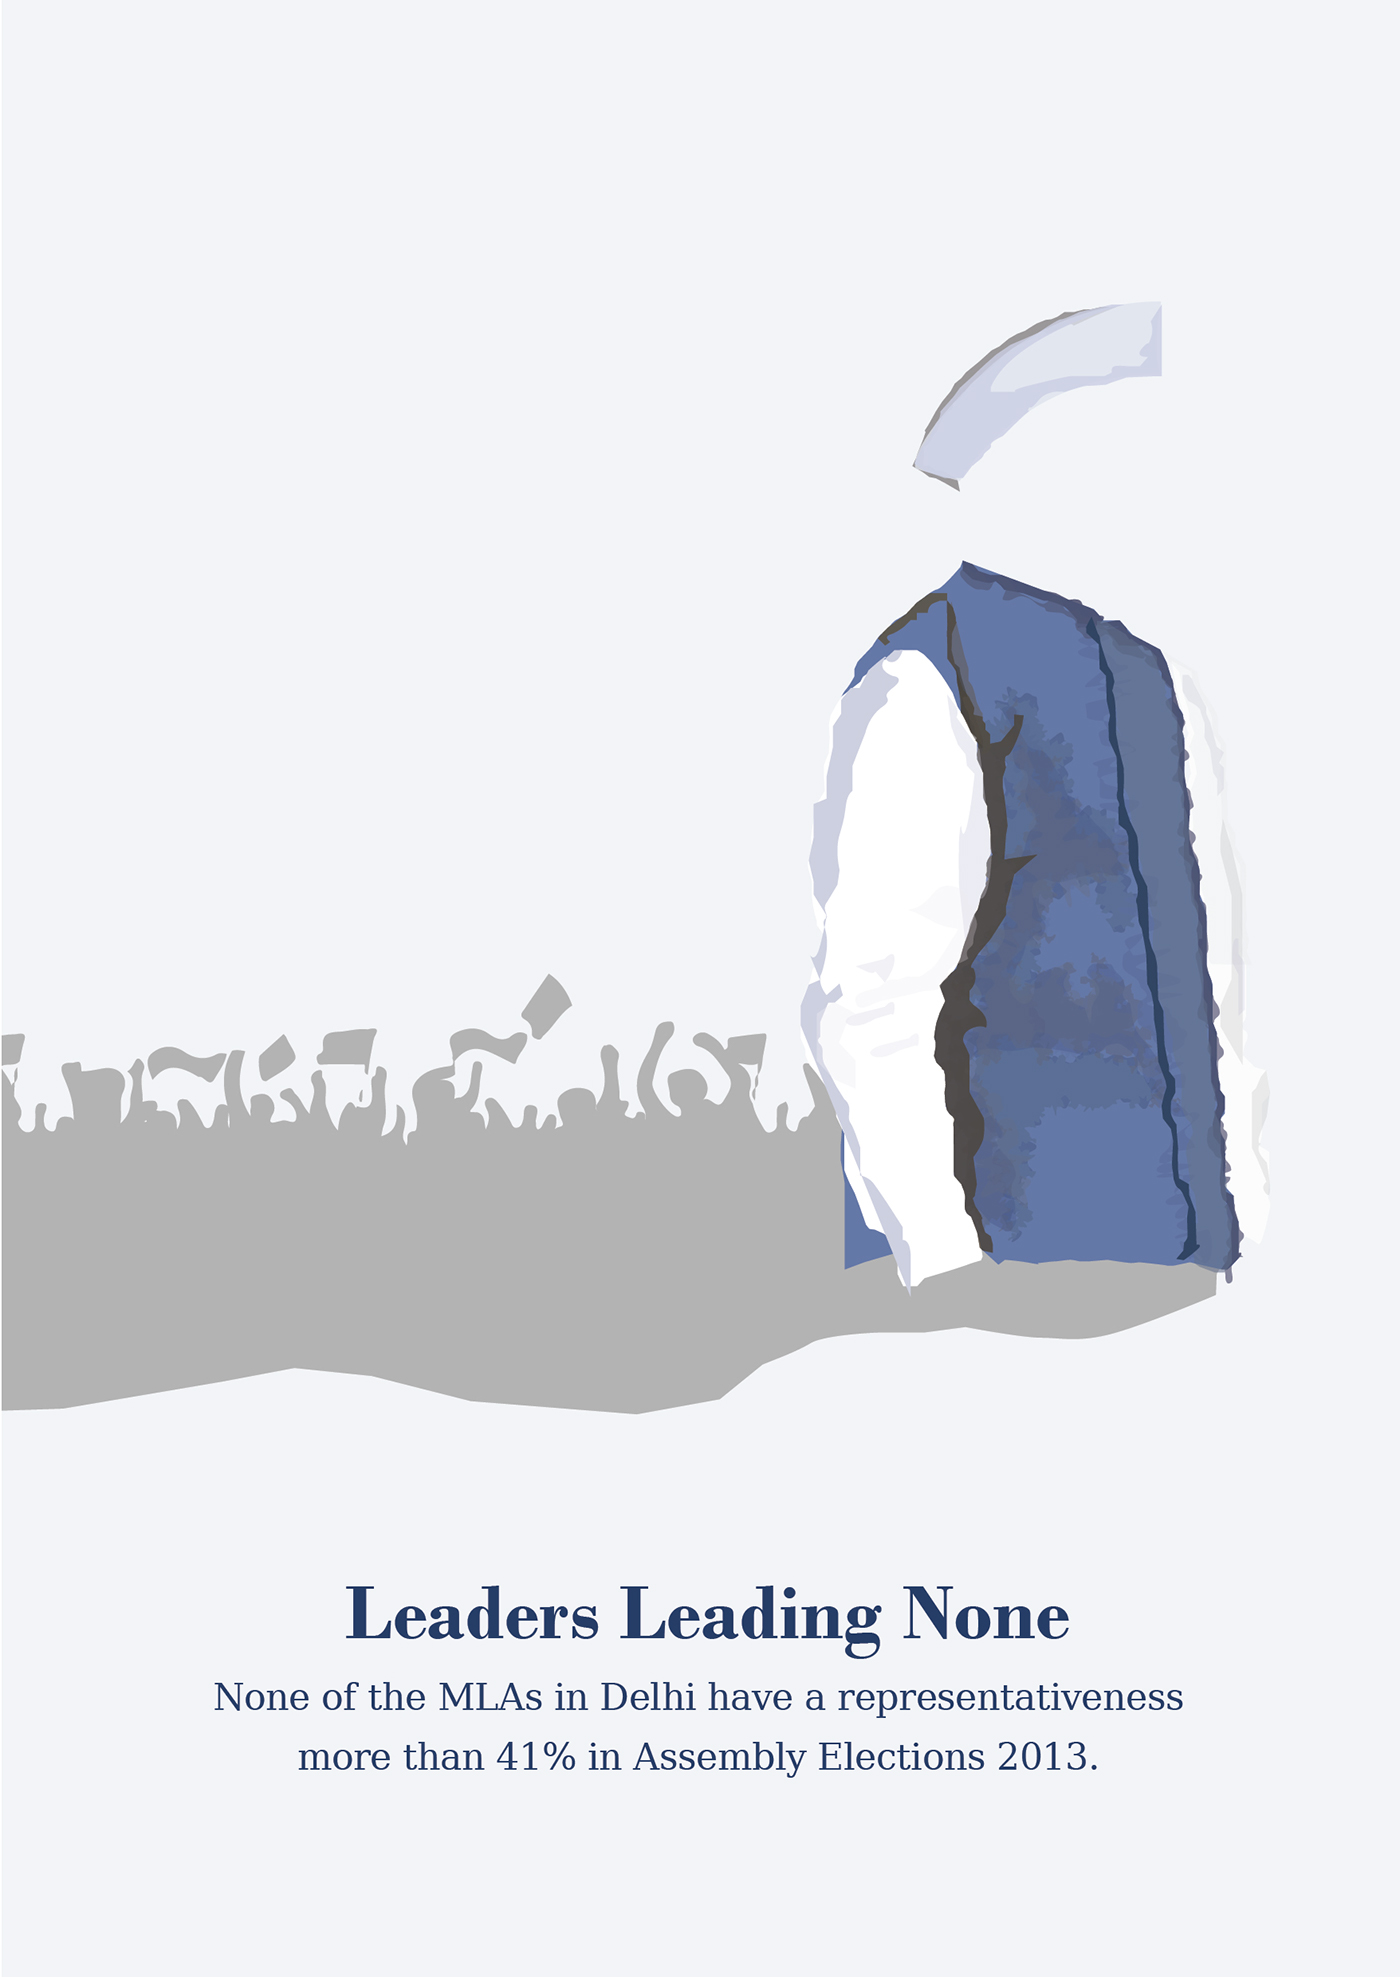
Final Posters