BBC News poll-tracker was divided into three parts: the traditional line graph showing the evolution of the possible vote support by political party, a pictogram that highlighted the likely range of this support, and a table displaying all the polls that build our poll of polls.
Line graph
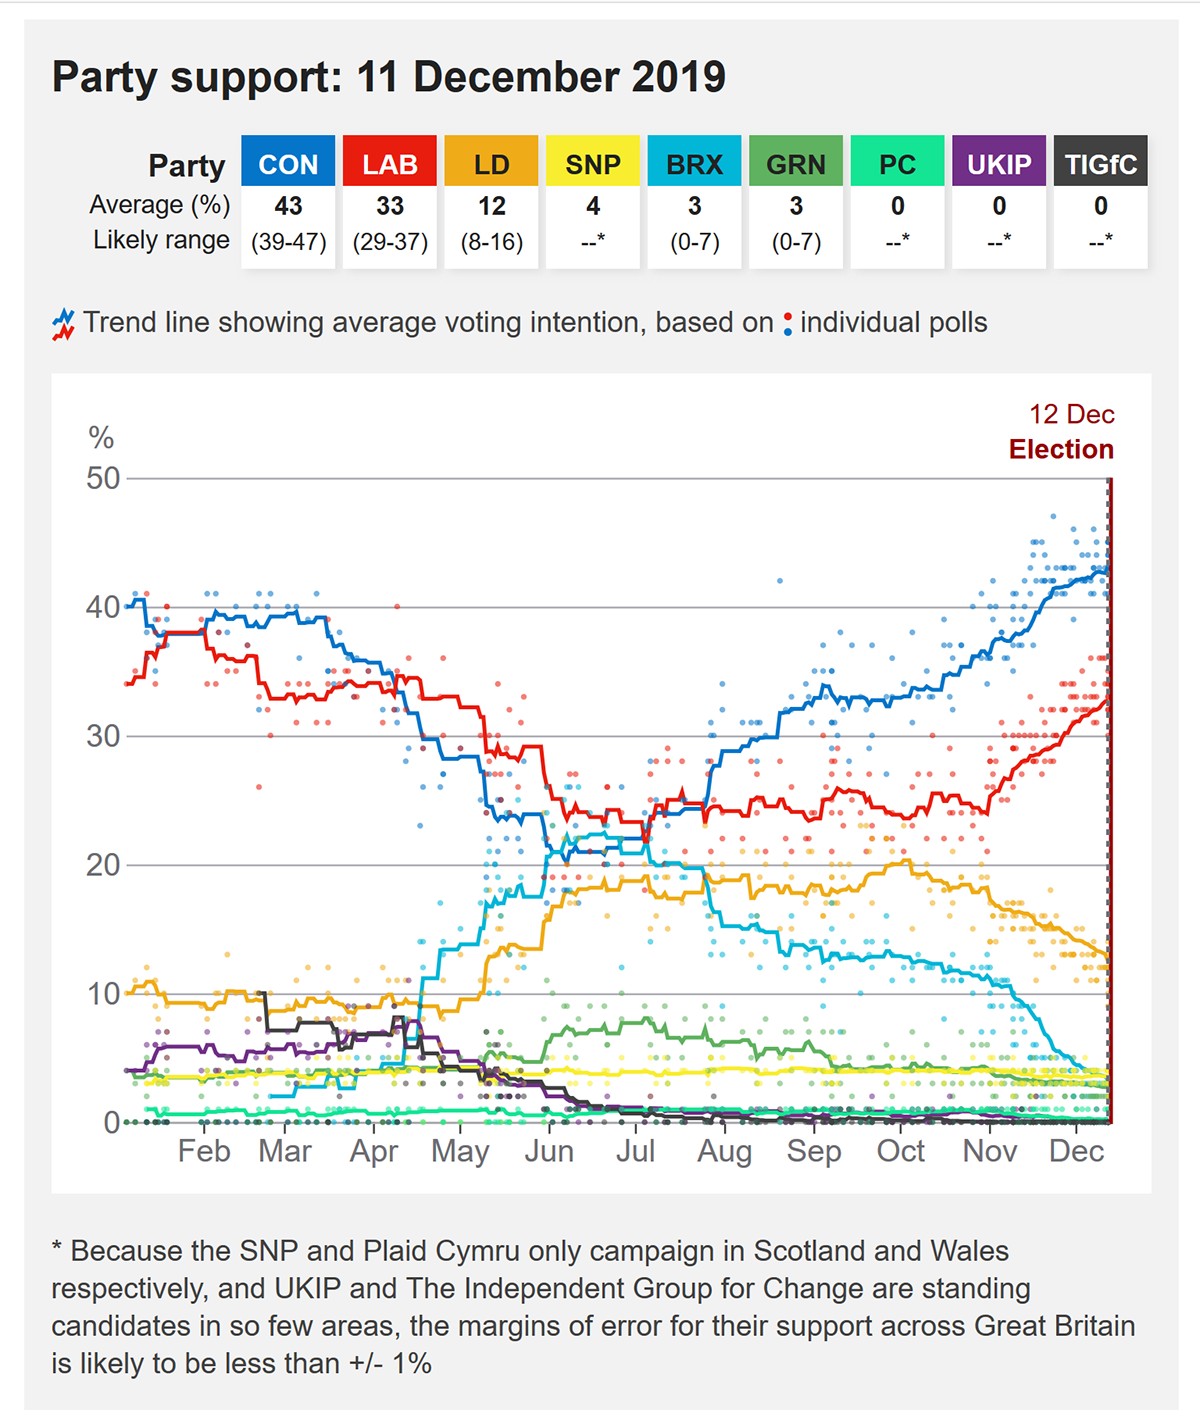
For the first time, BBC's poll tracker included numbers. The design of the line graph changed a lot. We thought about including a chronology highlighting events, also adding interactivity, etc. For clarity purposes, and easiness in the UX, these items were not added at the end.
First iterations

Pictogram
One of the goals of the project was to explain the uncertainty of polls as clear as possible. To do so, we designed an animated pictogram to help viewers understand the margins of errors.
Credits
Data analysis by Robert Cuffe, John Walton, Ed Lowther.
Design by Irene de la Torre Arenas and Debie Loizou.
Development by Becky Rush, Steven Connor, Tom Francis-Winnington, Alexander Ivanov and Felix Stephenson


