Quarantine: Viral Data
A Visualisation of the 100 Most-Viewed YouTube Videos
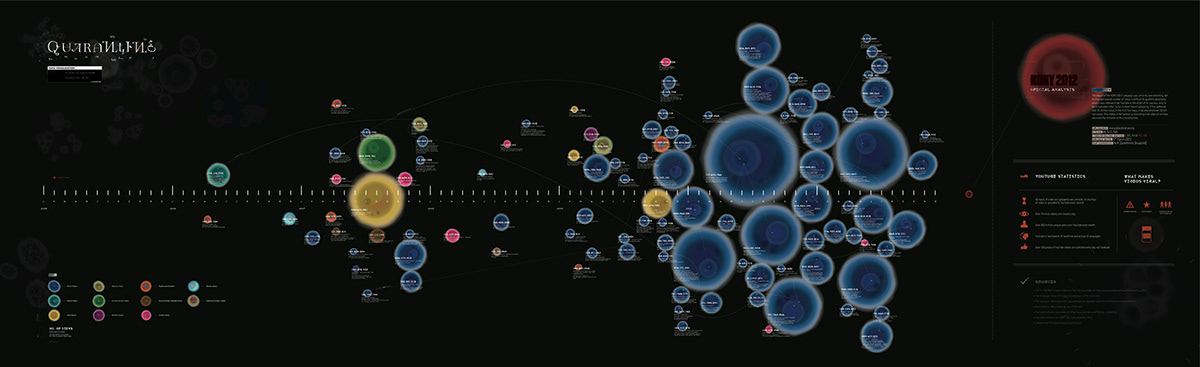
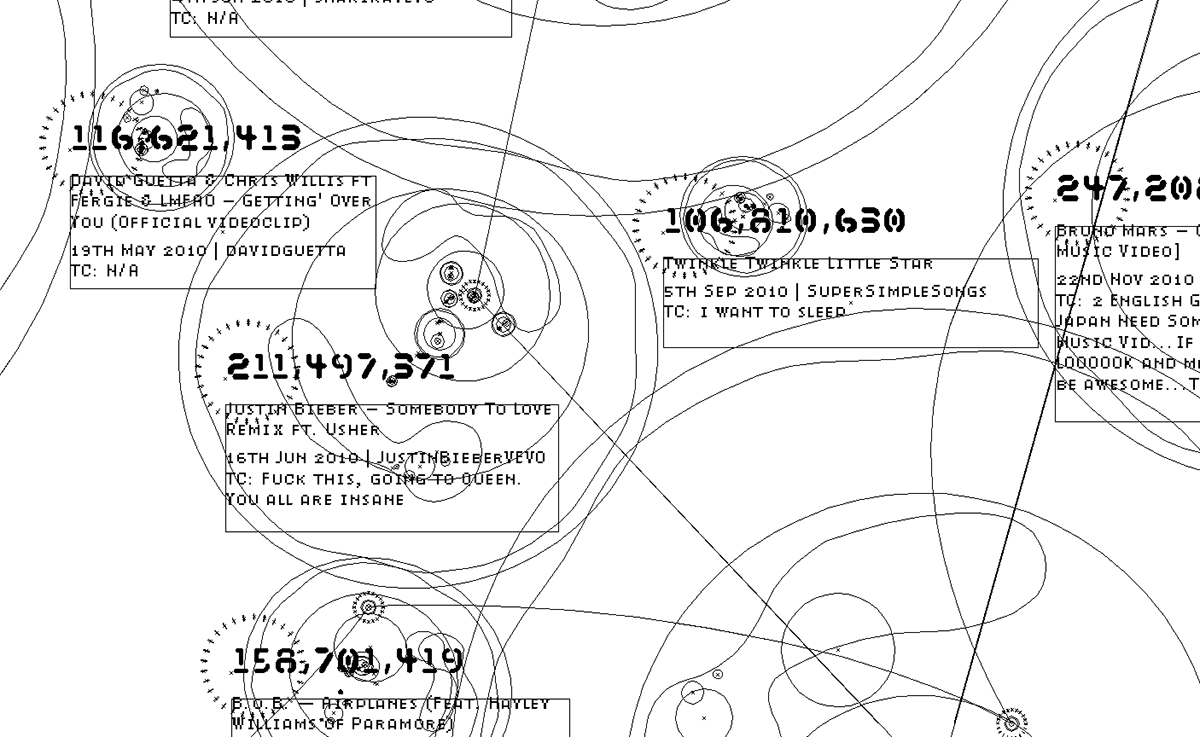
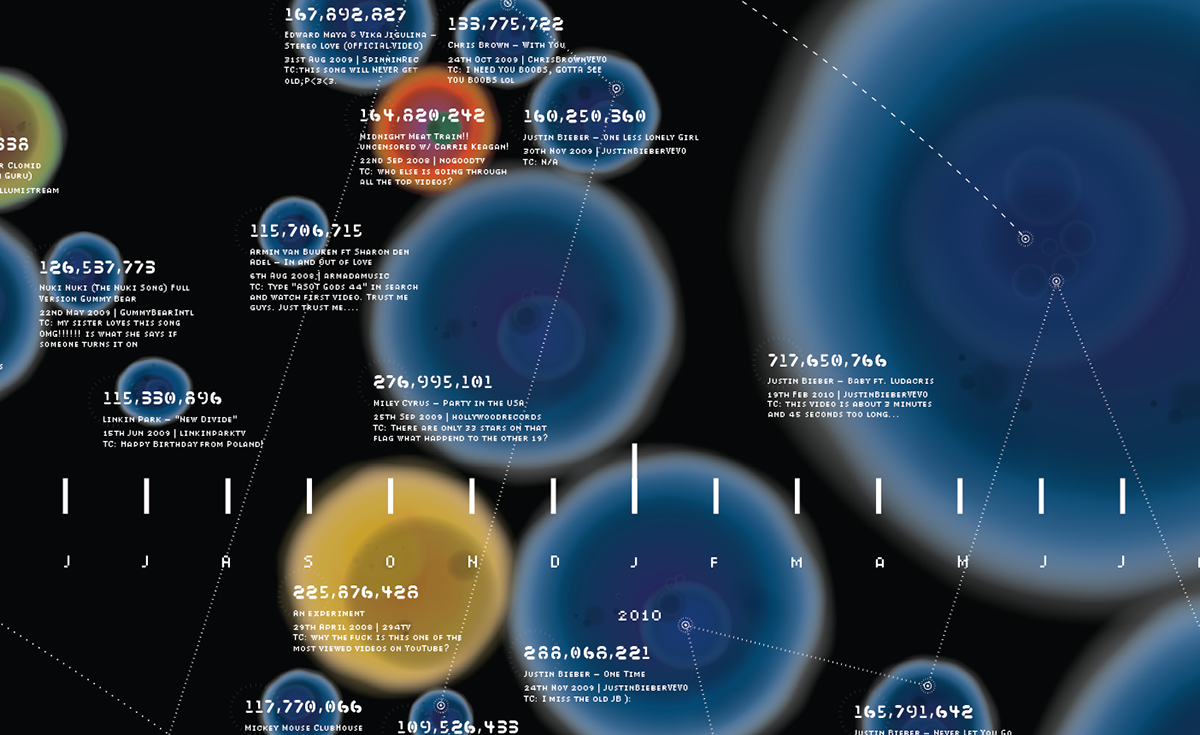
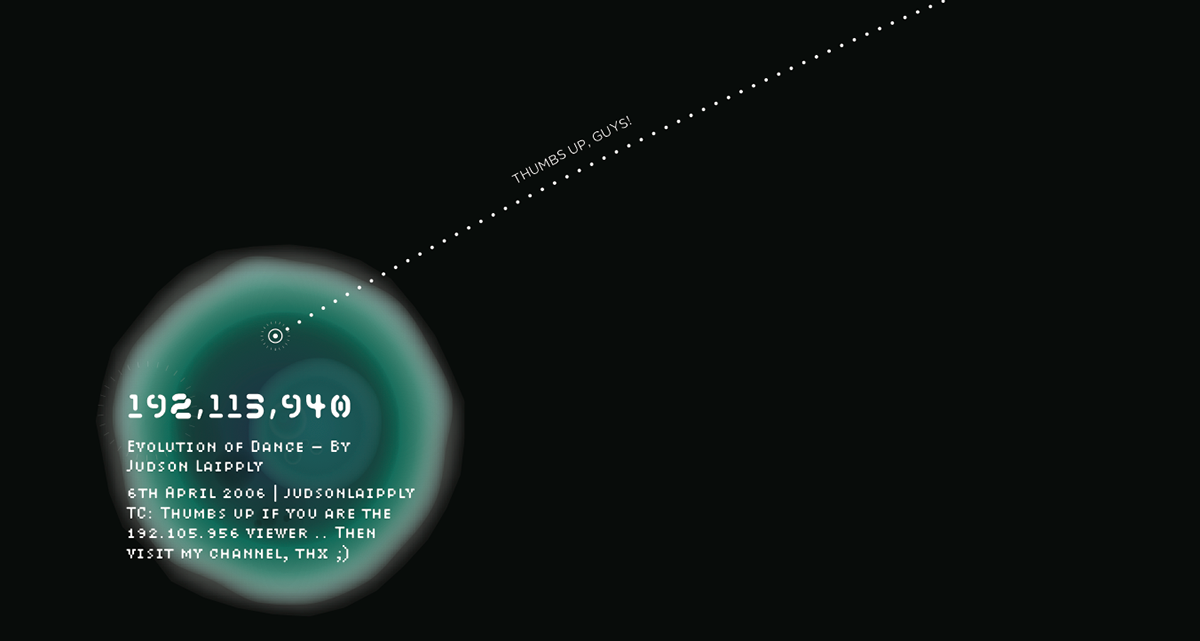
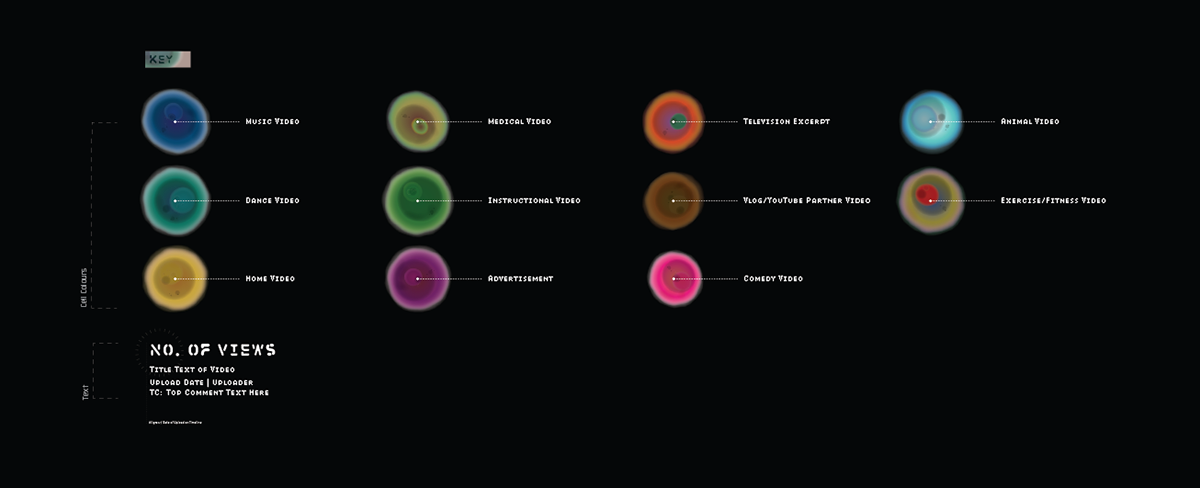
This project was an analysis of the 100 most-viewed videos on YouTube, and interprets the term ‘viral video’ literally by displaying the genre and number of views of each video by representing them as virus cells. Each cell's size indicates the video's number of views, its colour indicates genre, and its position on the timeline corresponds to the upload date. The text for each cell shows the exact view count, date of upload, uploader username, and top comment. Several of the cells are linked by prominent strands of data (e.g. uploads by VEVO accounts, and related top comments). The visualisation also includes a special analysis of the Kony 2012 campaign video by Invisible Children Inc., which became the fastest-accelerating viral video of all time following its upload in March 2012.