
_
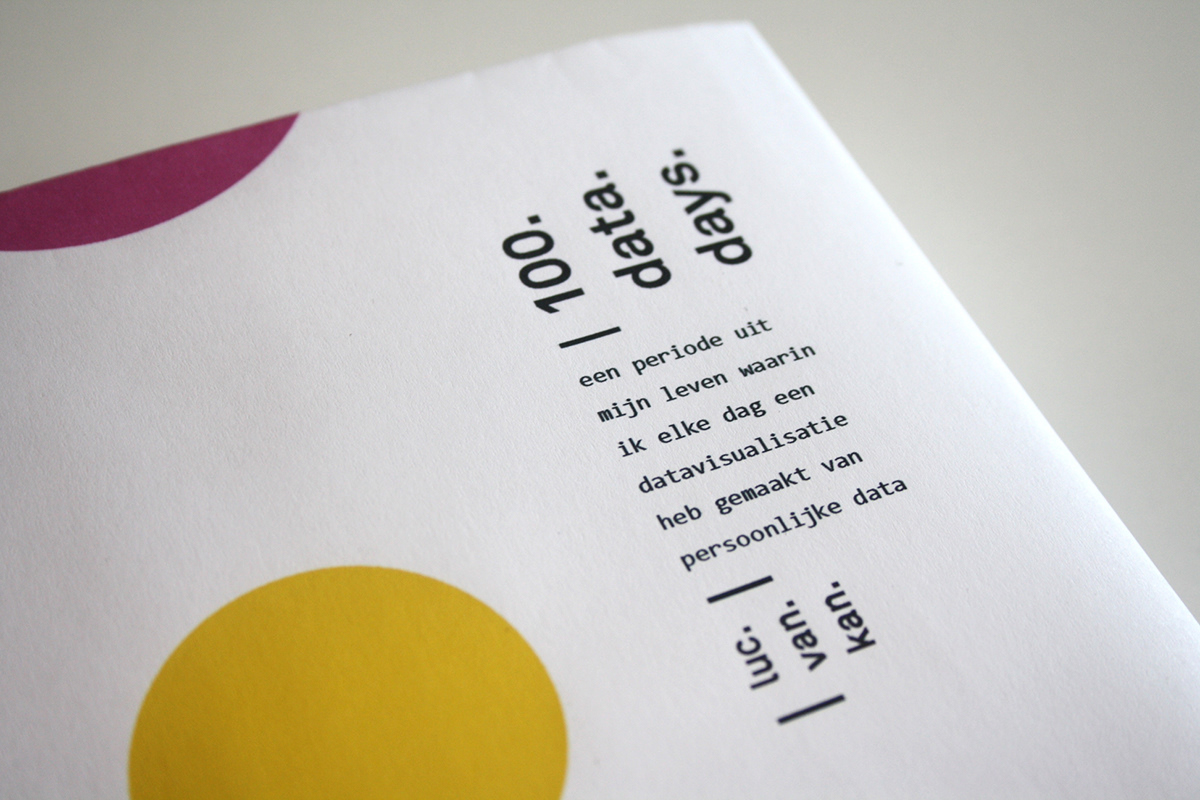
100 days
100 times data
100 visualisations
100 stories
100 times me
_
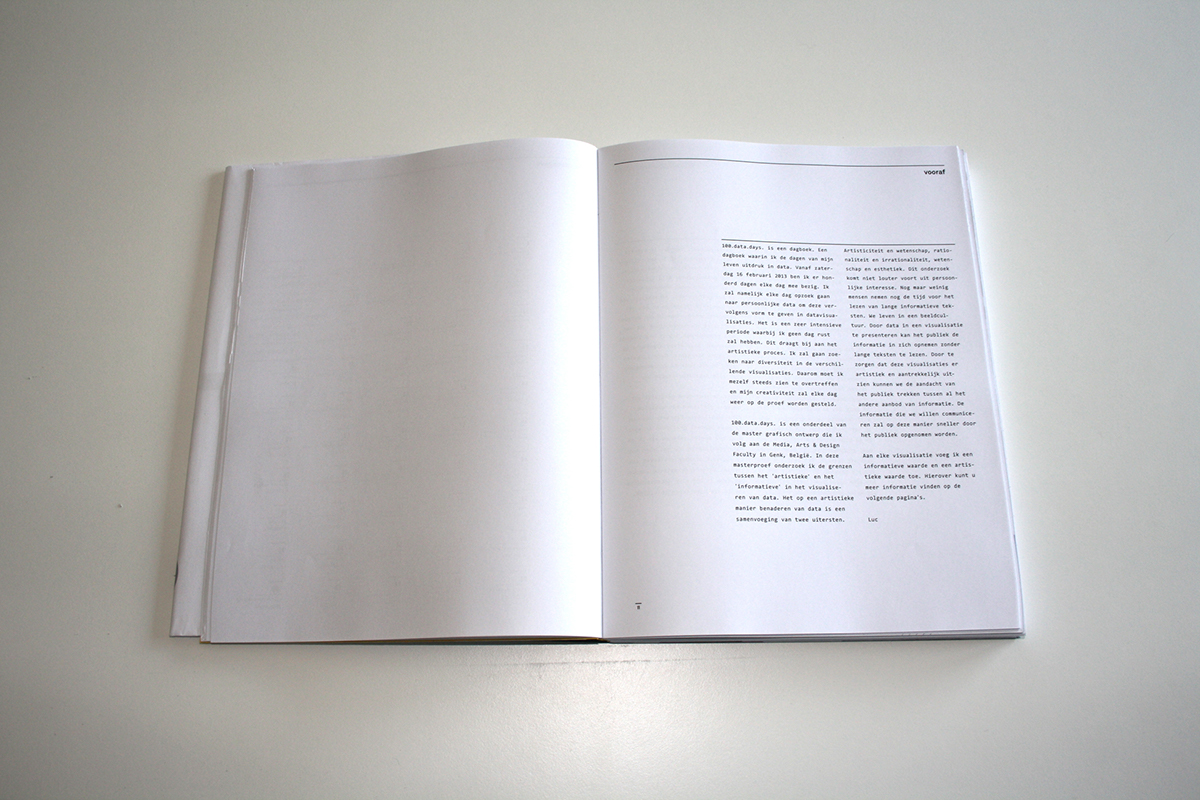
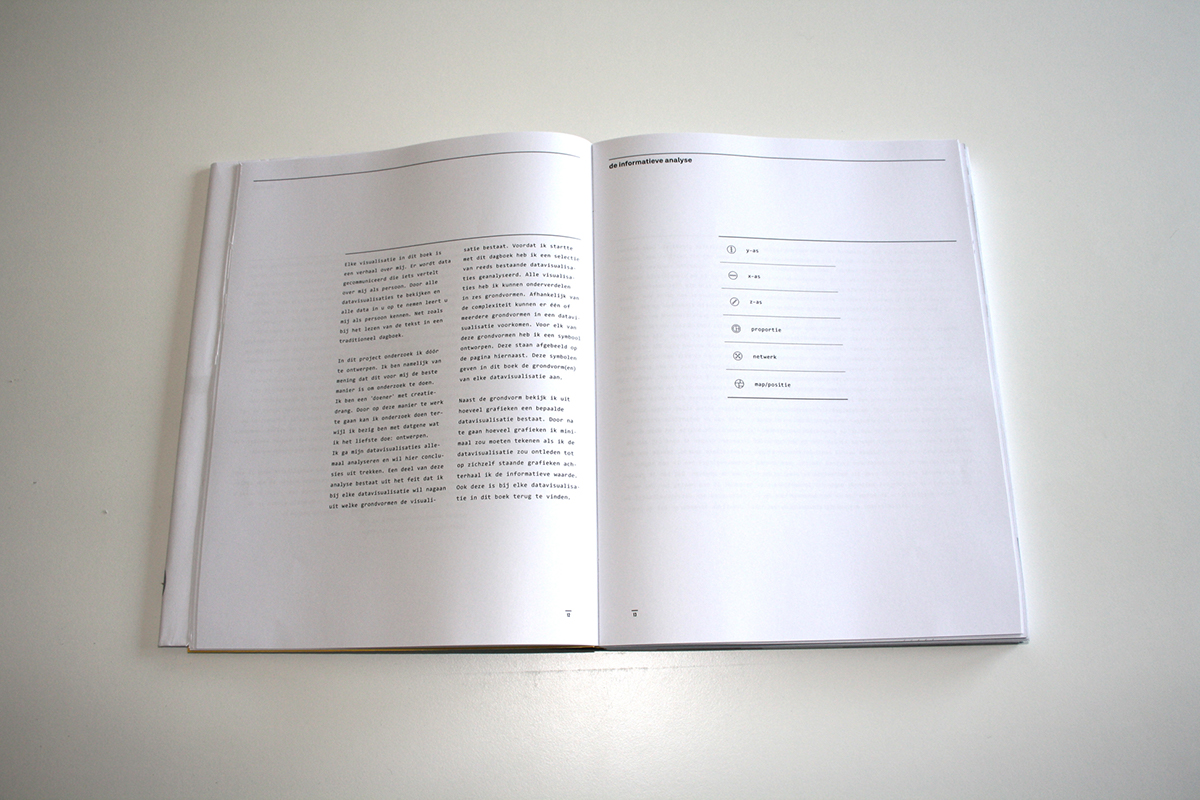
A hunt for the borders between the informative and artistic in data visualisation. A mixture of the scientific and instictive. How can we turn (generally dull) graphics into something visually attractive?
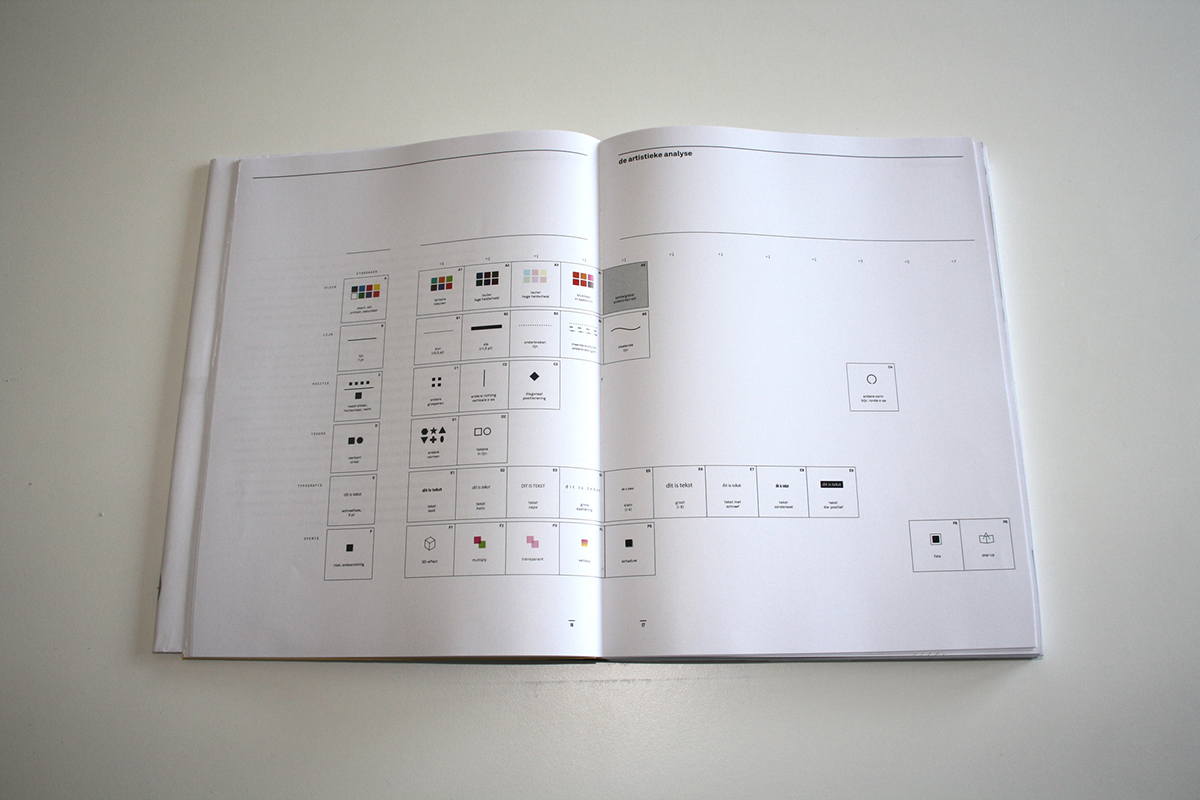
In the project 100.data.days. I spent a hundred days of my life working on data visualisation. During this period I gathered personal data on daily basis. Every day I've made a data visualisation about my data. So a dairy came about with a hundred different data visualisations, which each tell their own story about my life. The information and artistic value of eacht visualisation were then analysed.
The combination of these two extremes continues to fascinate me. In the current information culture the visualisation of data is increasingly important as it expands in quantity: without artistic transformation the communicative value of data is lost in the mass.
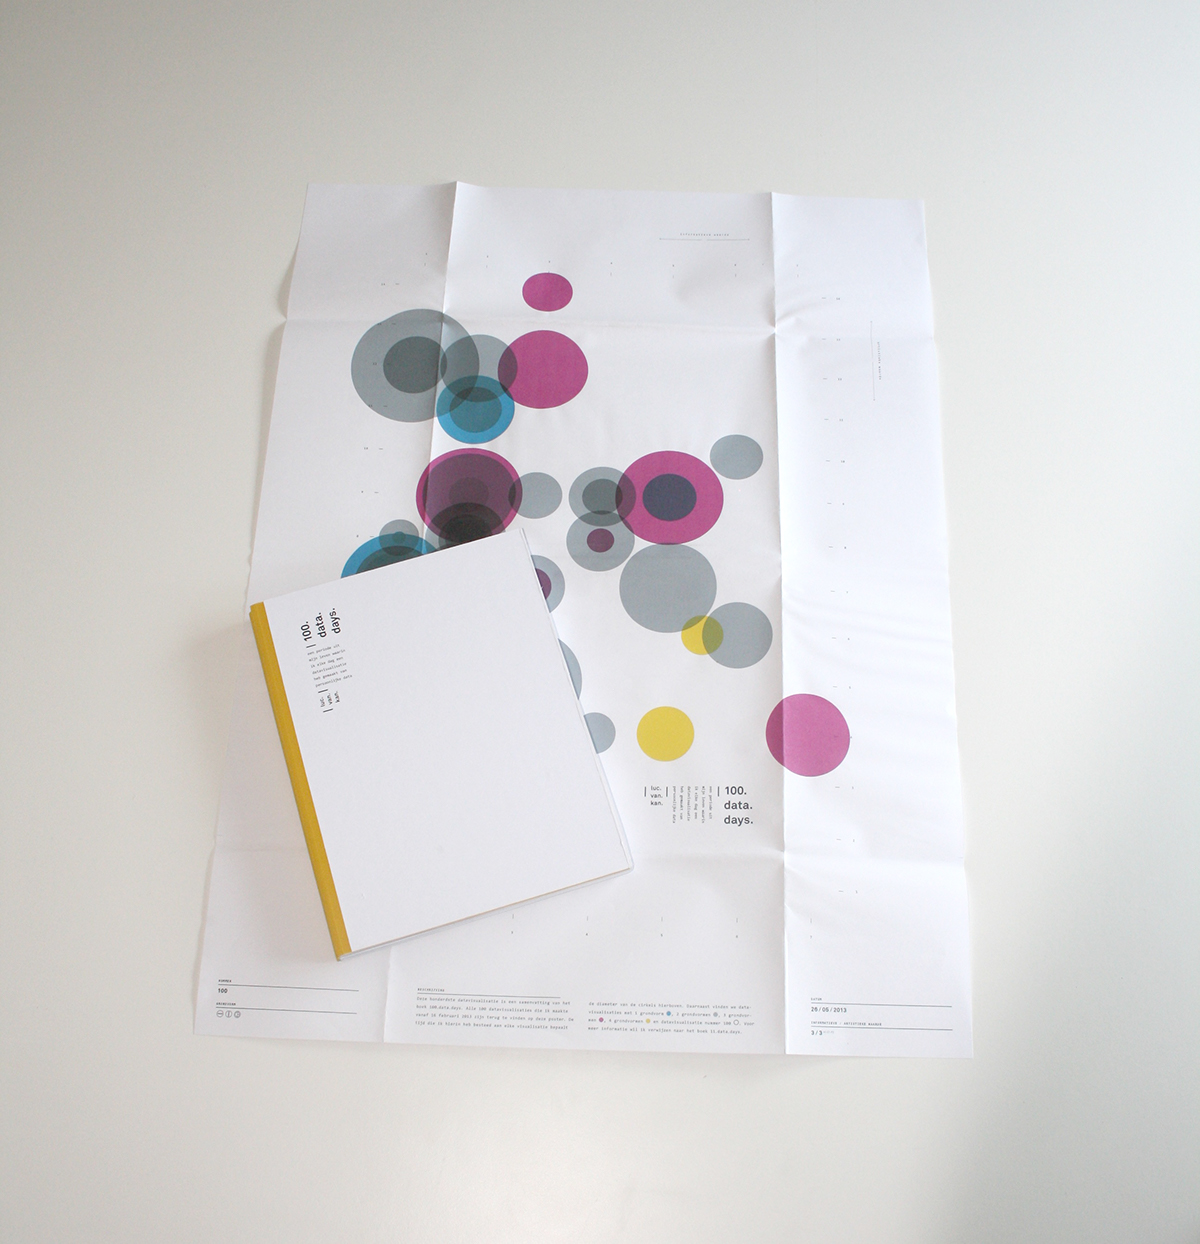
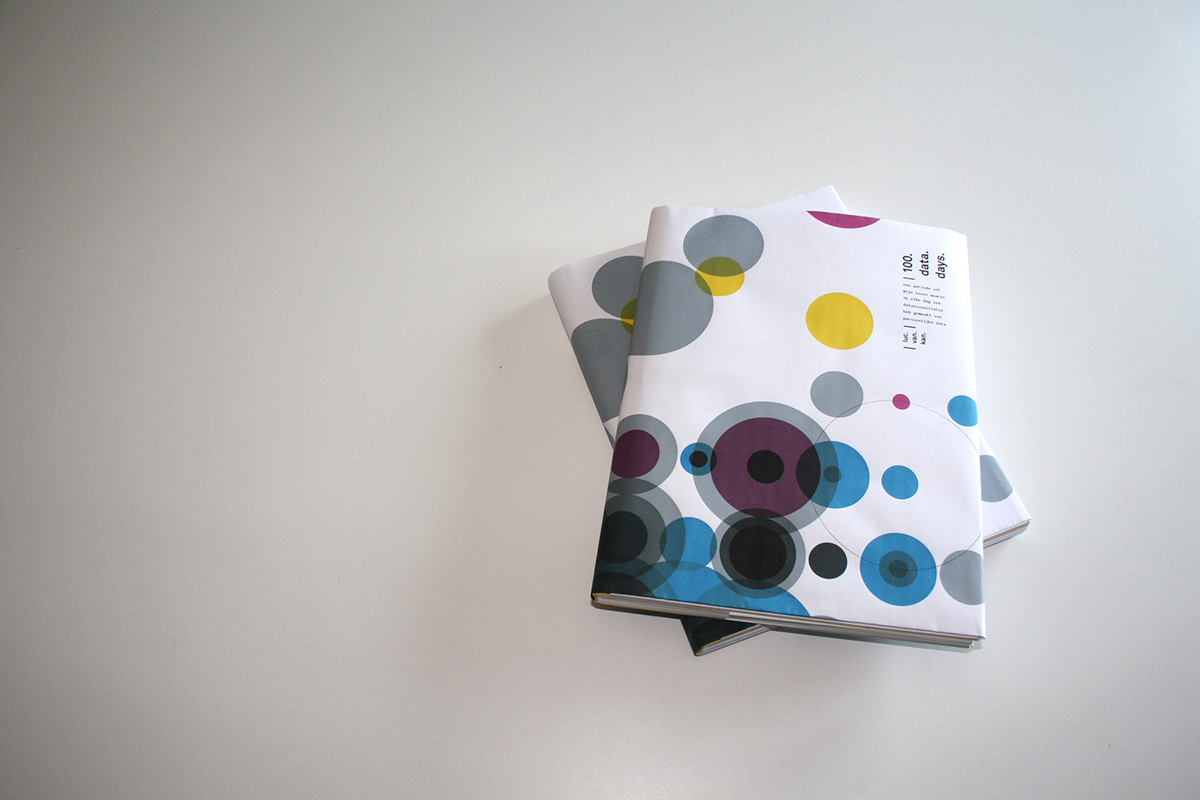
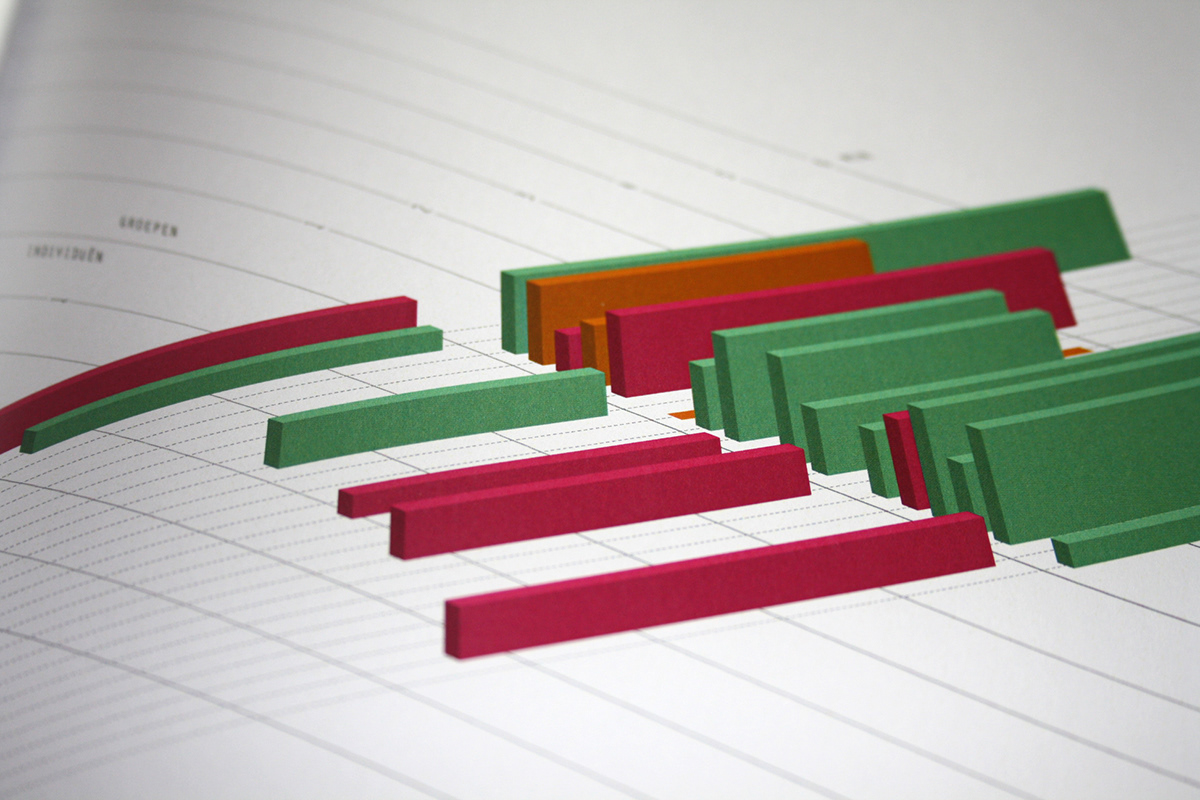
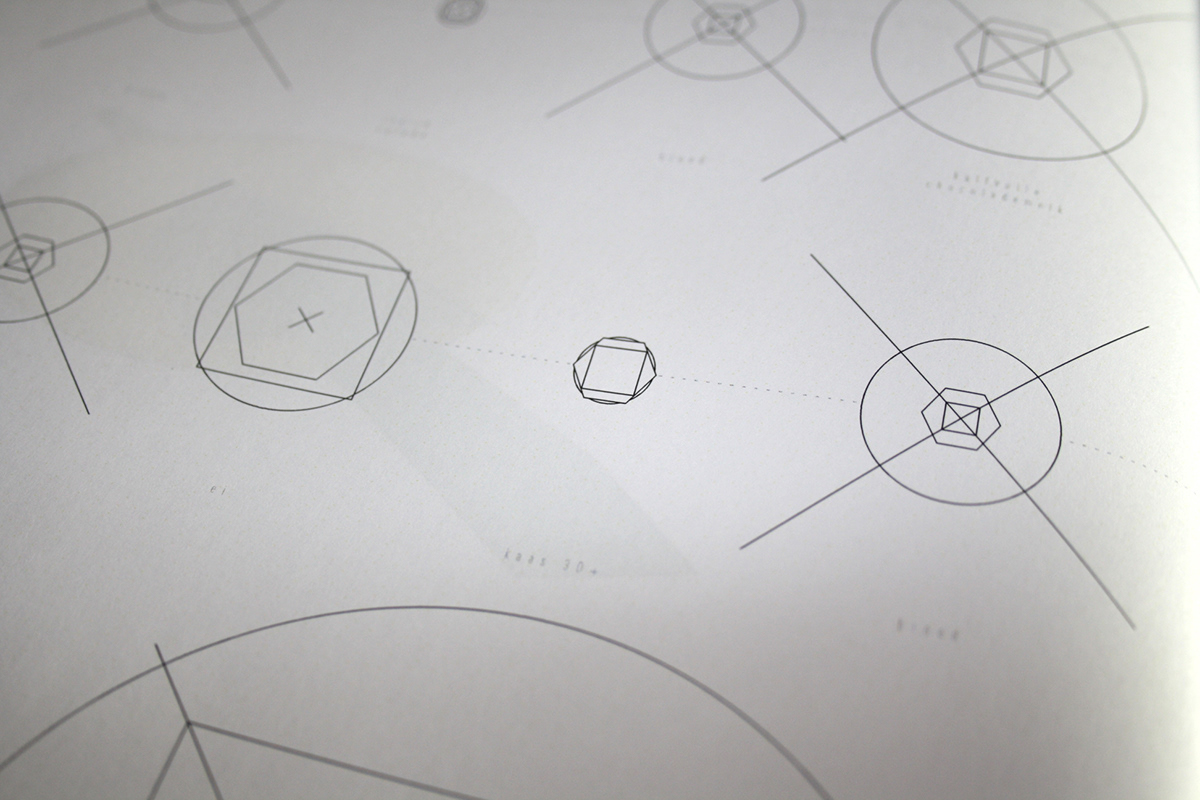
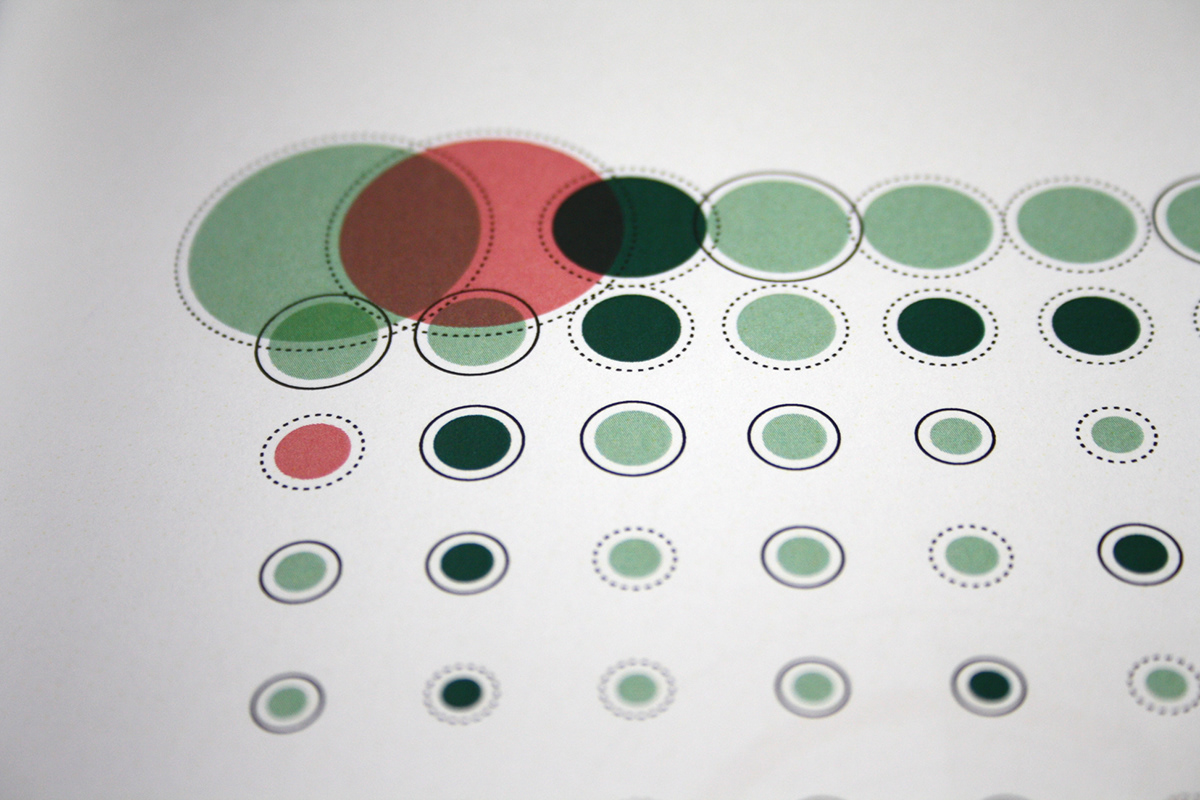
The hundredth and last data visualisation is a poster. All 99 previous data visualisations are visualised on an x-axis (informative value) and a y-axis (artistic). The size of the circles indicates how long I’ve worked on the respective visualisation. Folded, this last data visualisation is the cover of the books.
Because I wanted to do this project for 100 days in a row, I had no rest day. Every day I visualized data and I collected data for the next day. Besides of that, I had to think about which data I was going to collect the next day.
Yes, it was quite heavy.
Yes, it was quite heavy.
This project gave me a lot of creative satisfaction. But beside of that I’ve learned much about myself. I was shocked by the number of calories in hot chocolate and the large quantity of water I consumed when I was showering.
People looked really weird to me when I was counting all the steps that I took or when I noted the time when locked the car. I really discourage anyone to do a project like this for 100 days. But you will learn a lot about yourself if you will do a project like this for a week (or two).
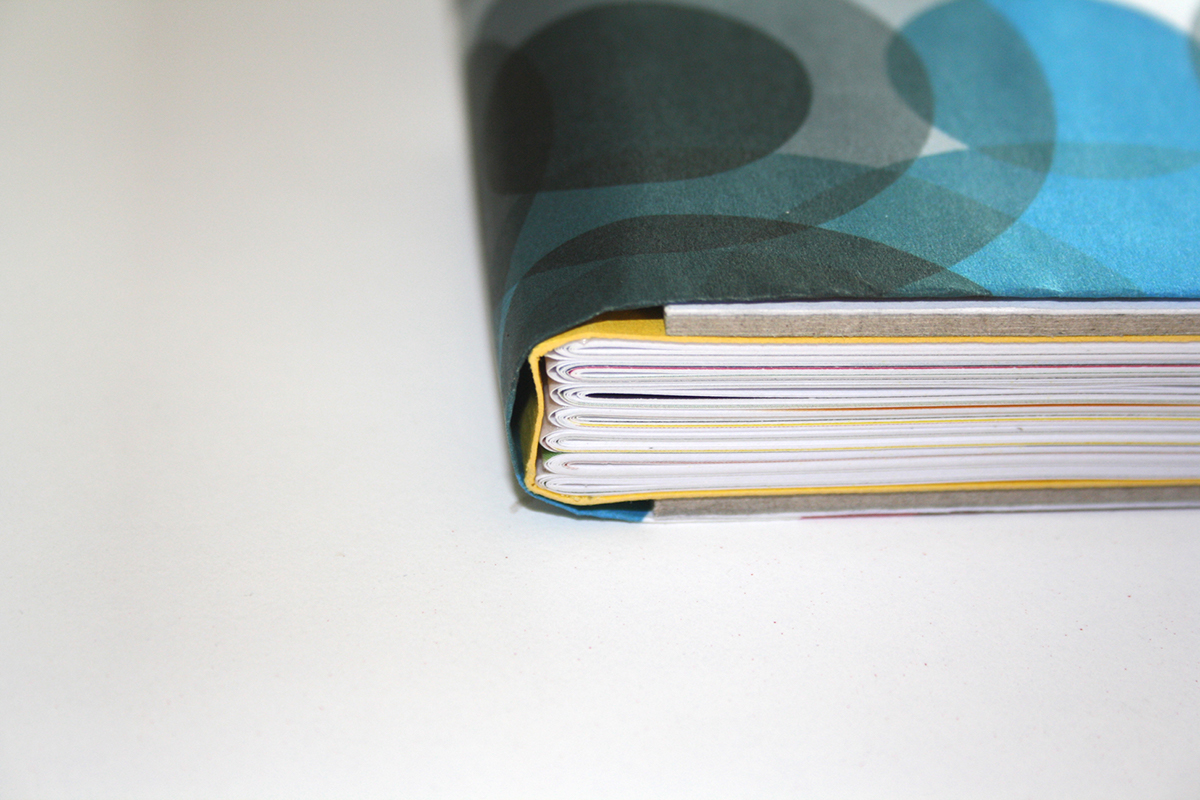
I collected the data, made the visualisations, did the editorial design, bounded these books and I've made these pictures.
100.data.days. is a part of my masterthesis.
Check www.lucvankan.nl for bigger pictures.
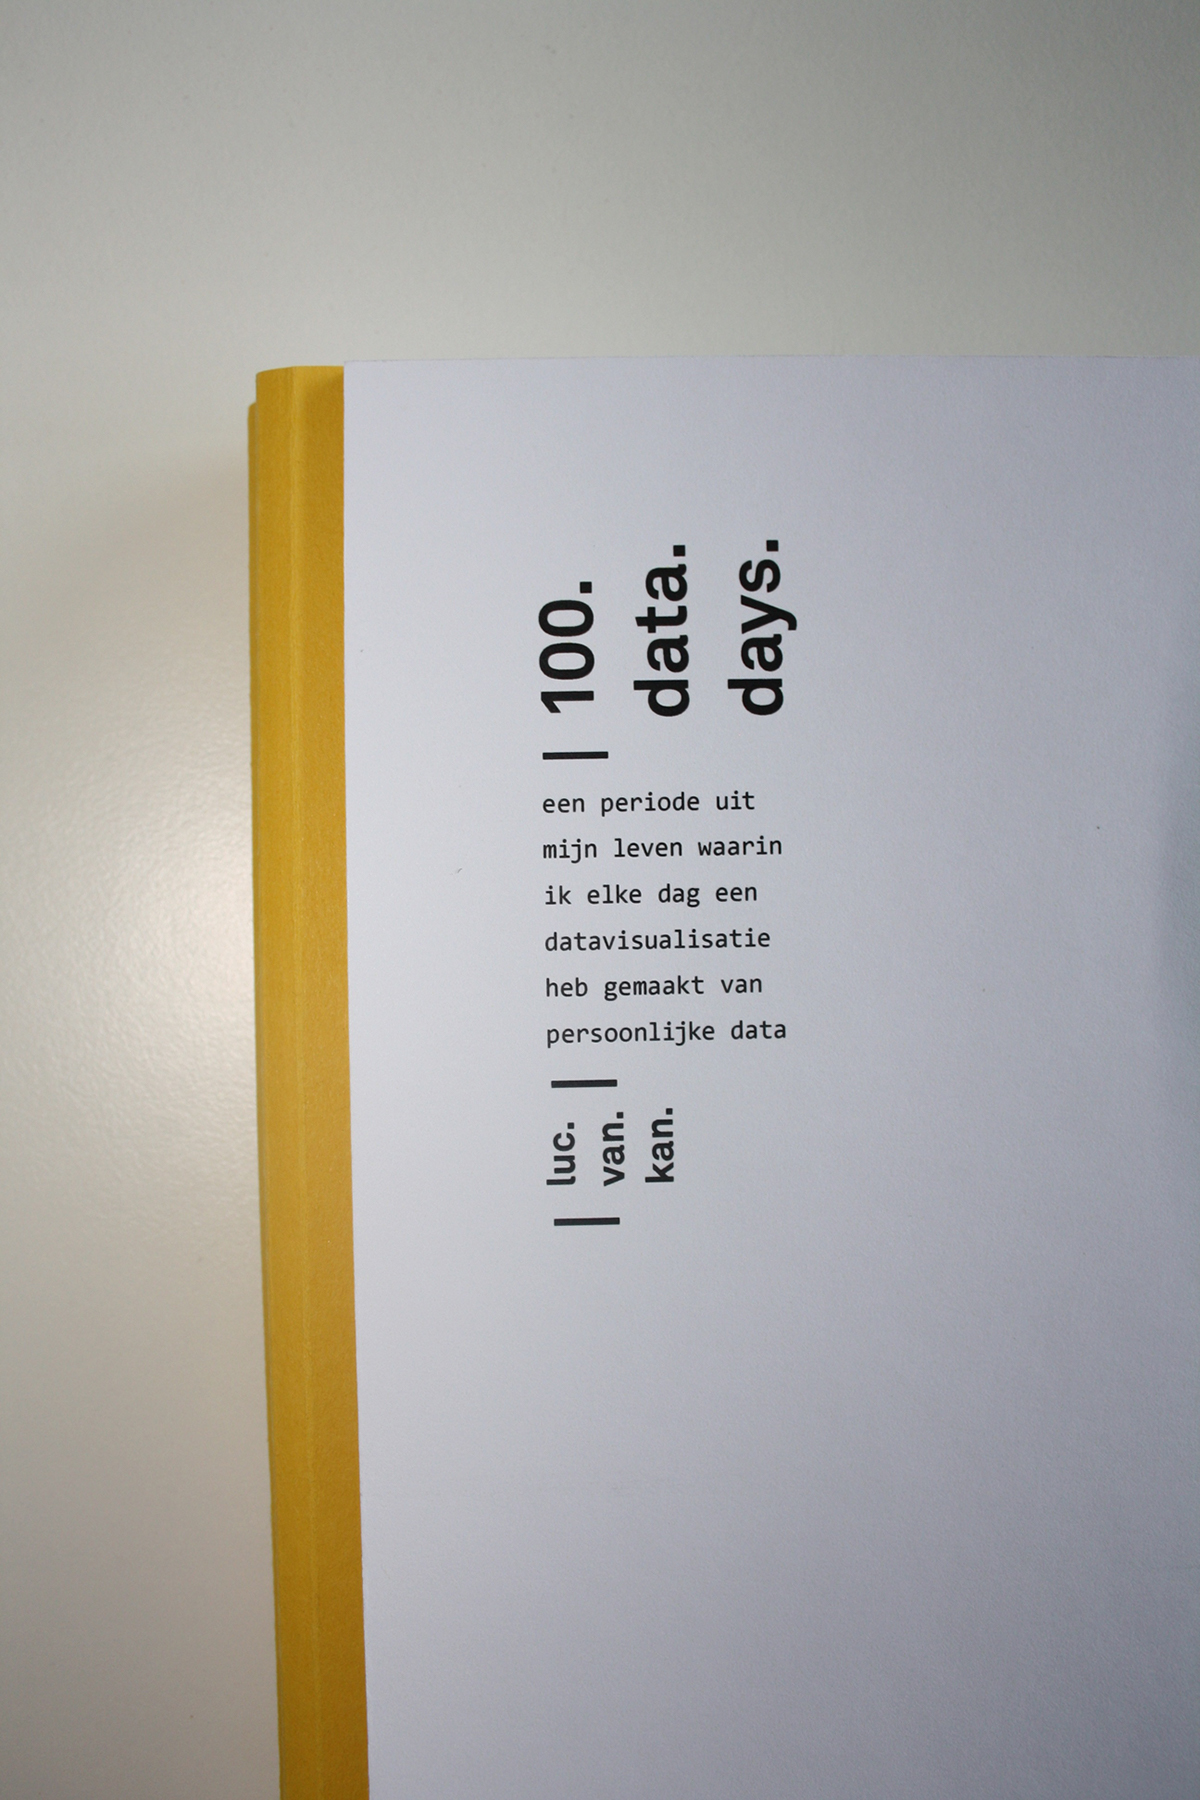
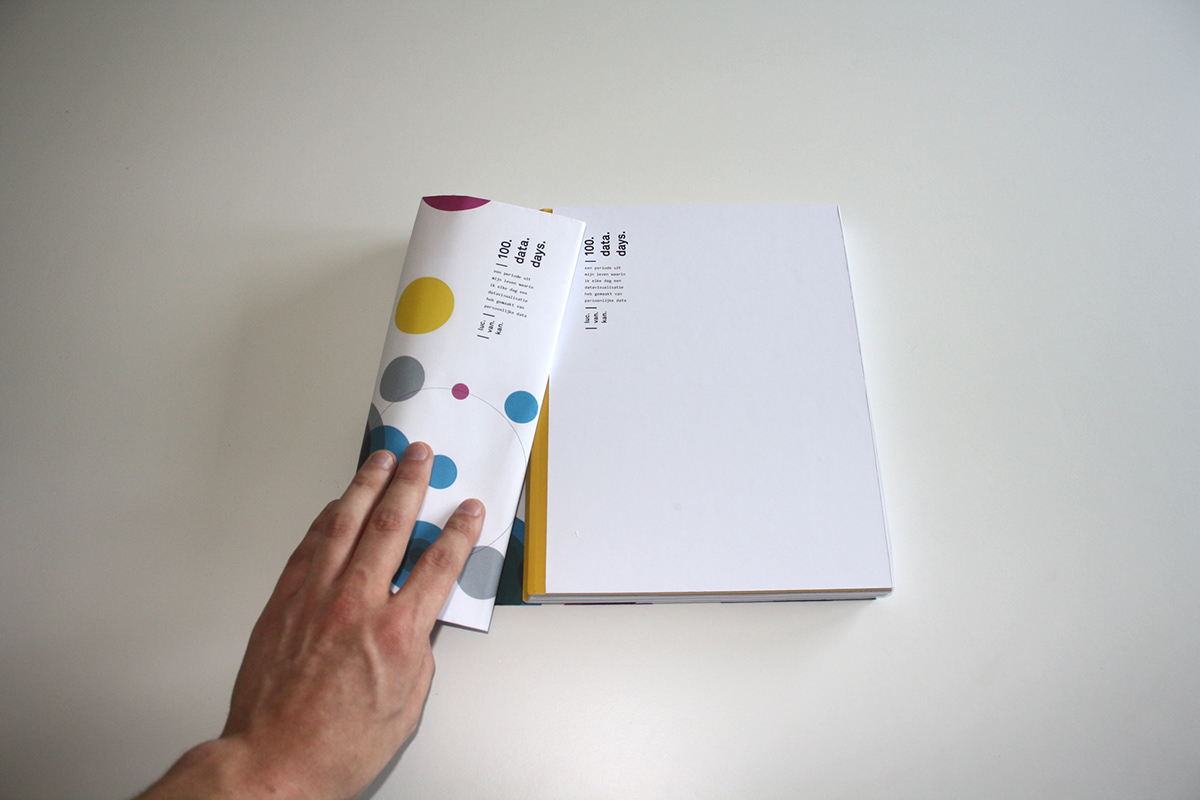
translation: a period of my life in which I've made a data visualisation every day, of personal data
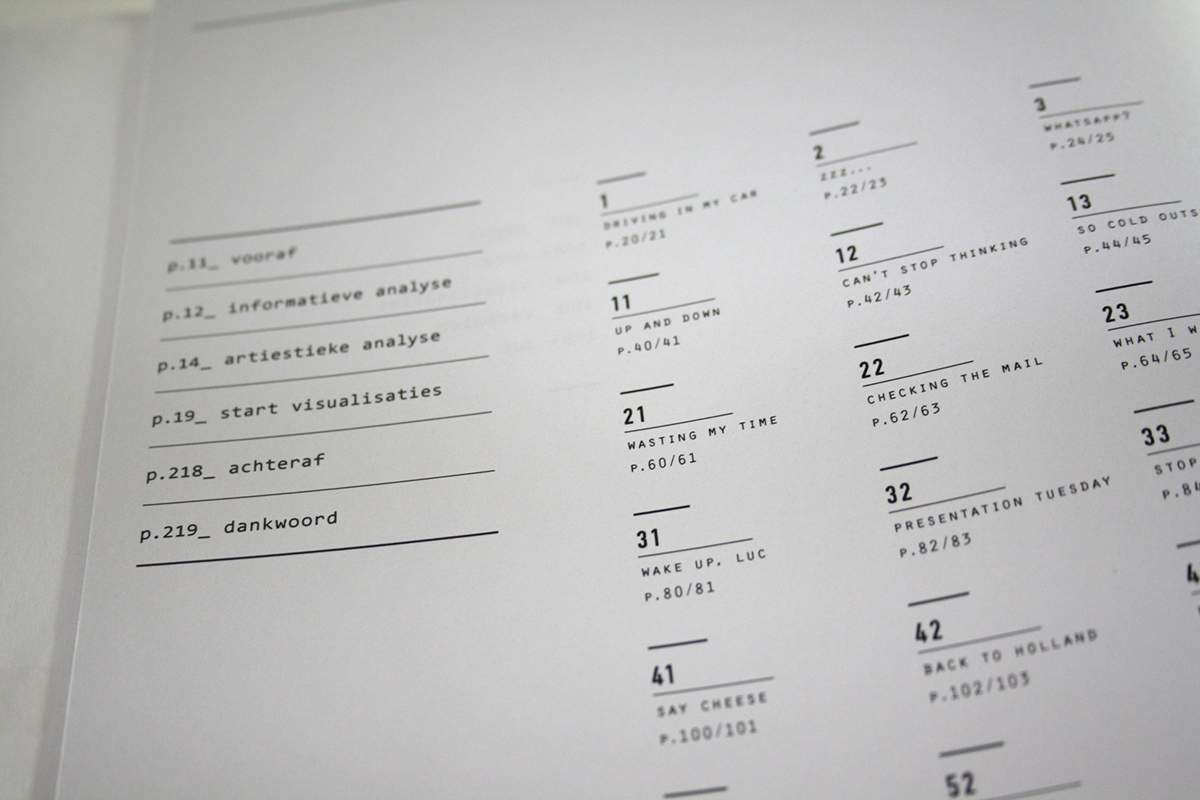
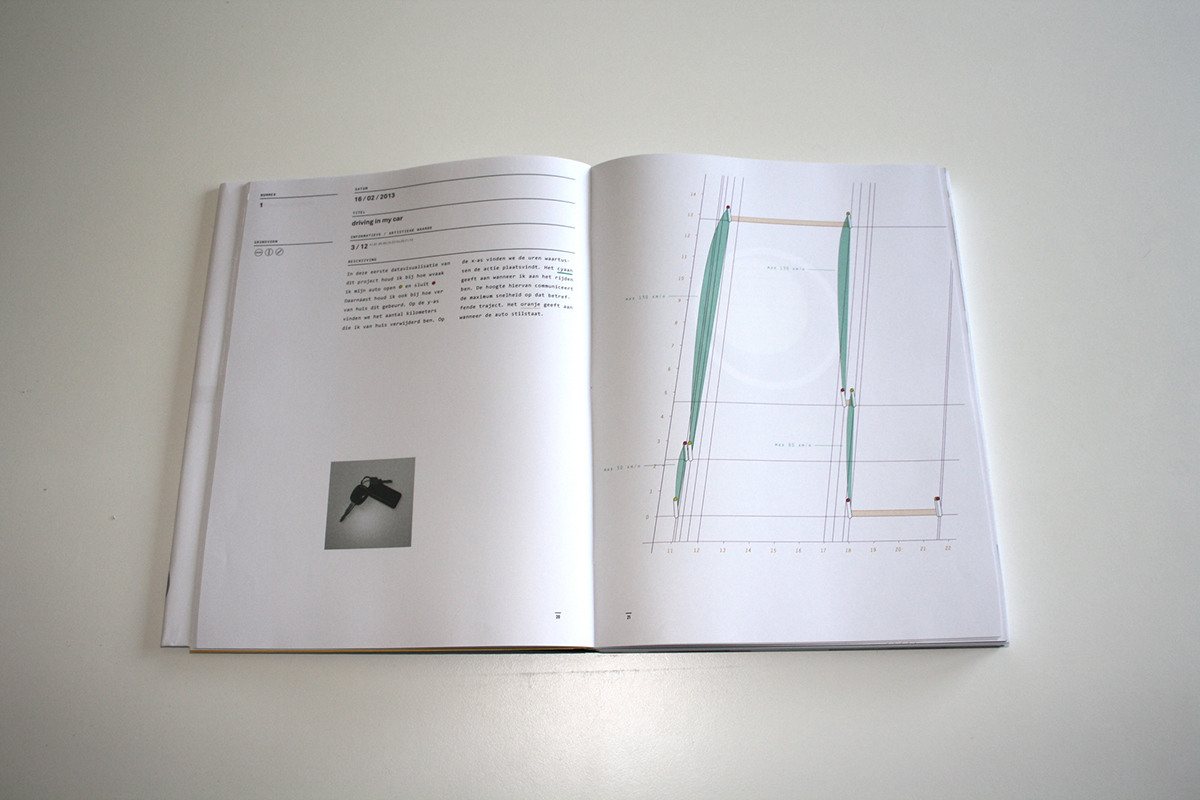
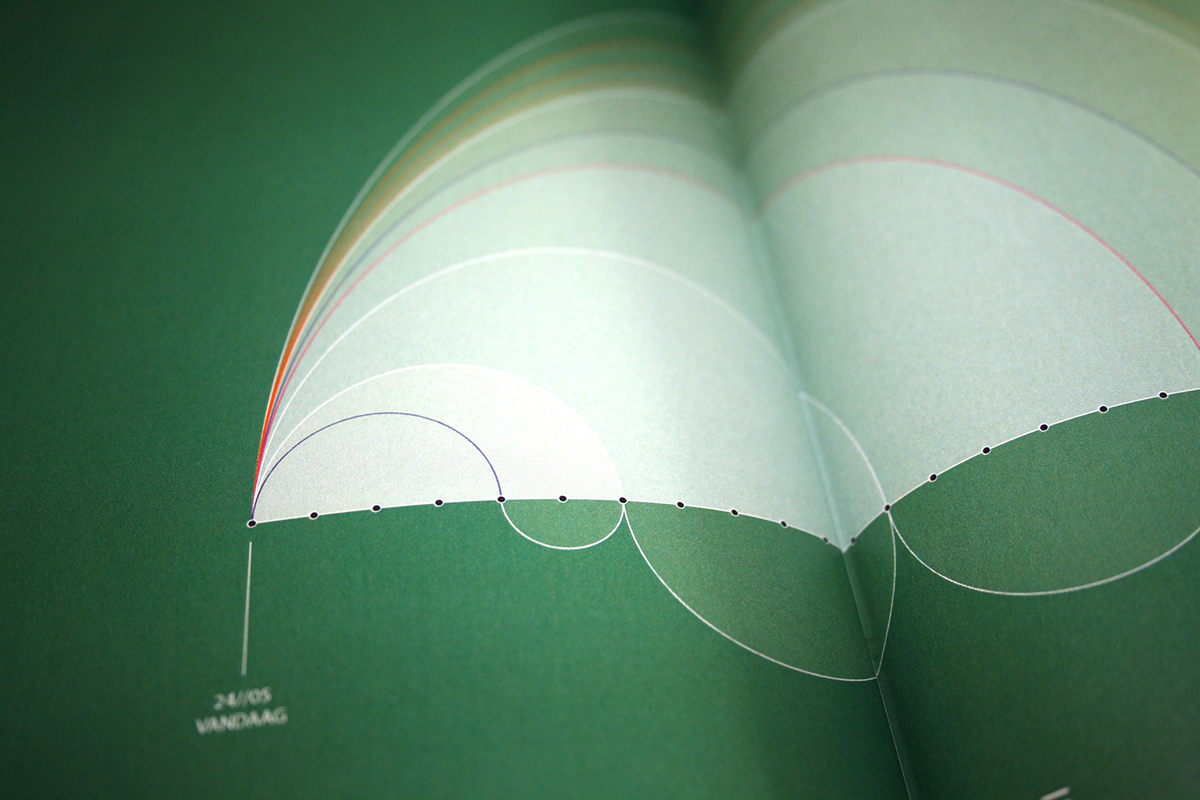
day 1: driving in my car
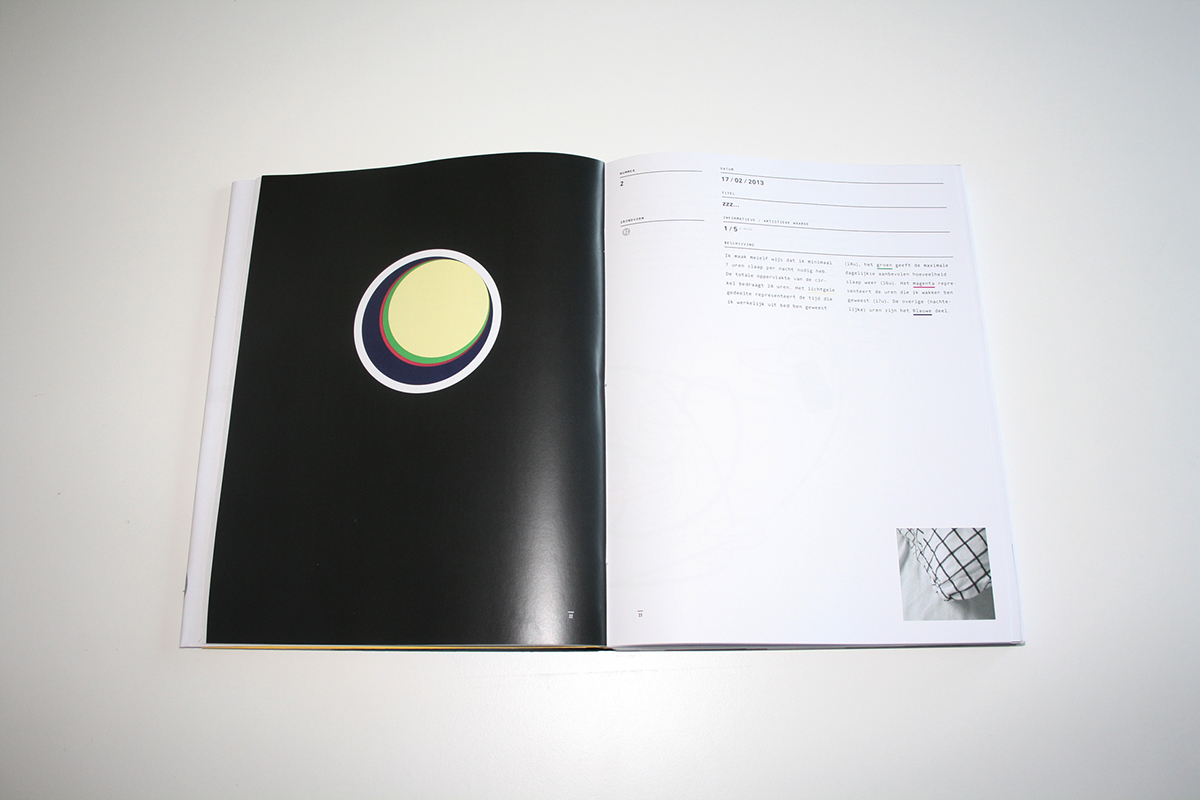
day 2: zzz...
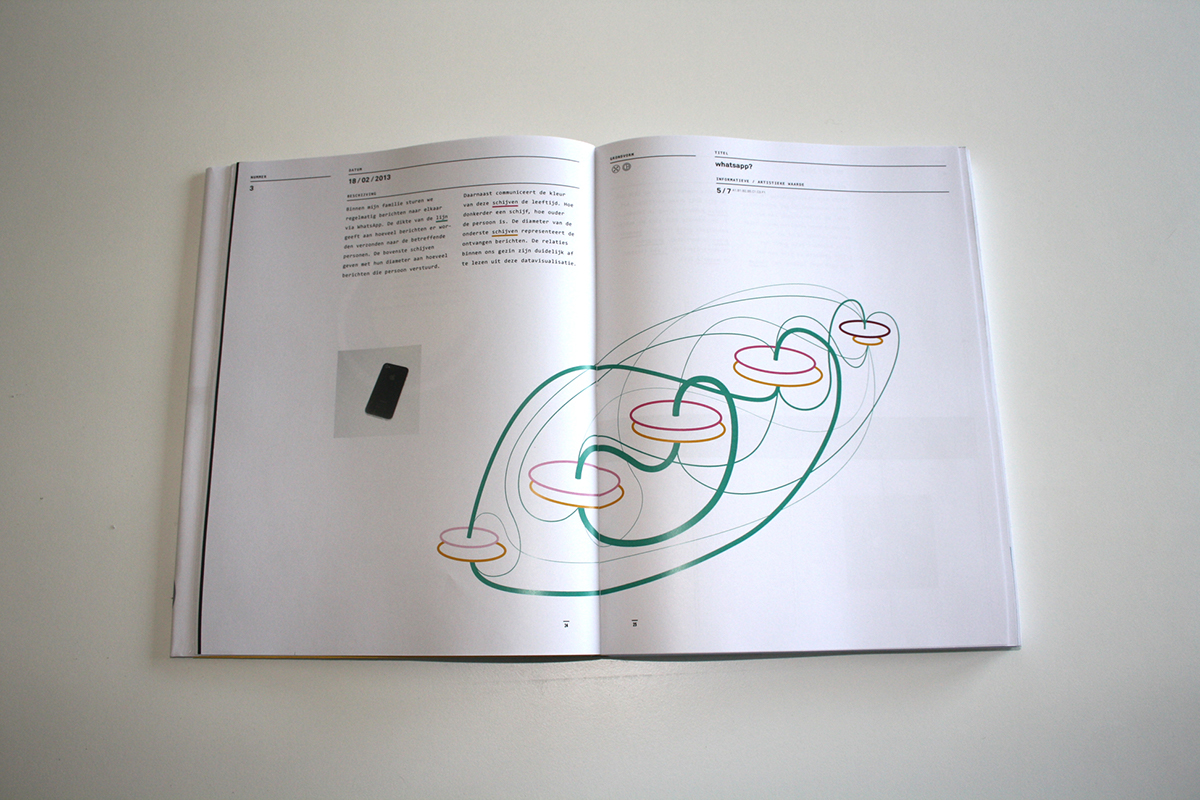
day 3: whatsapp?

day 4: let's see
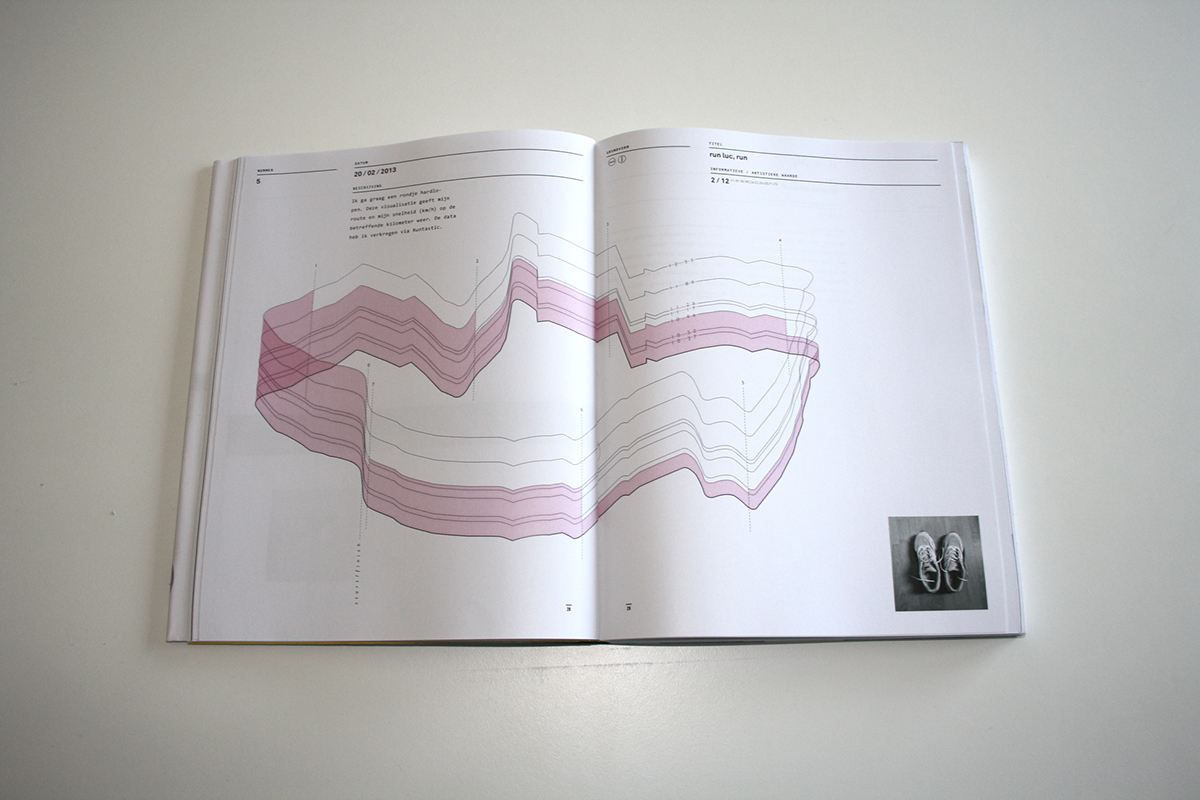
day 5: run luc, run
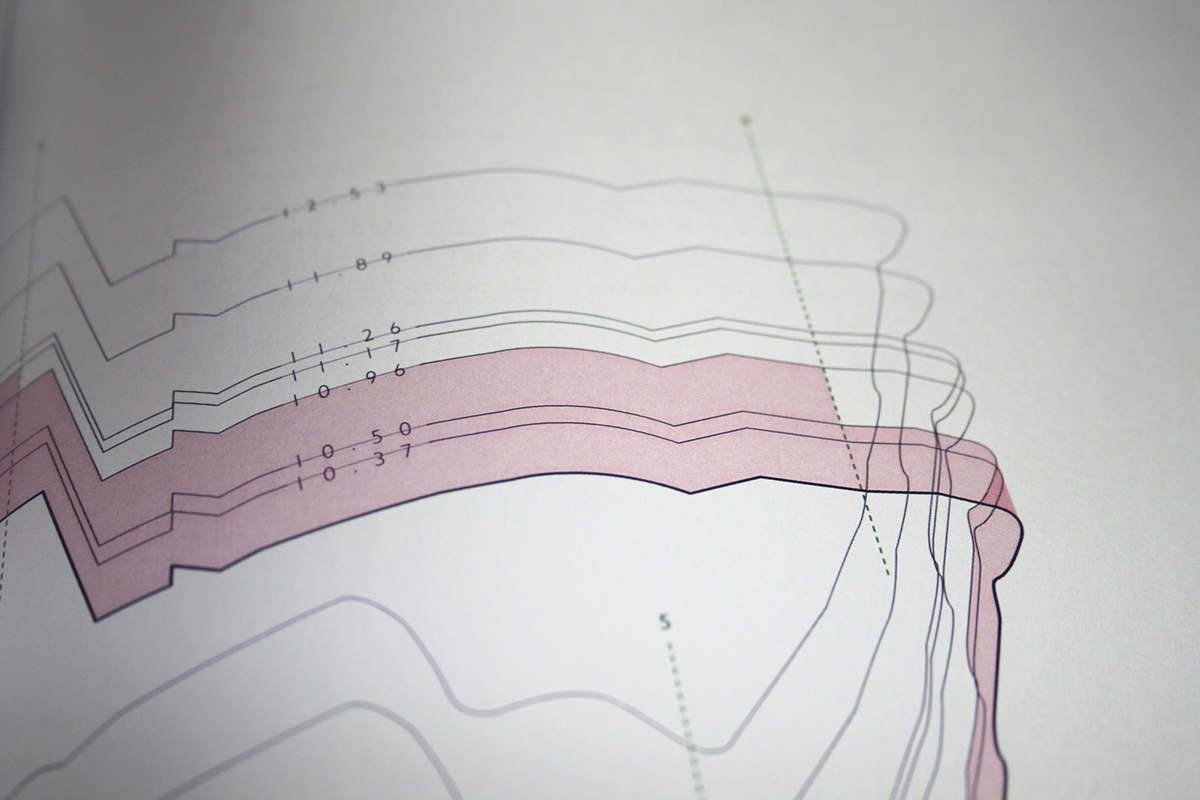
day 5: run luc, run (detail)
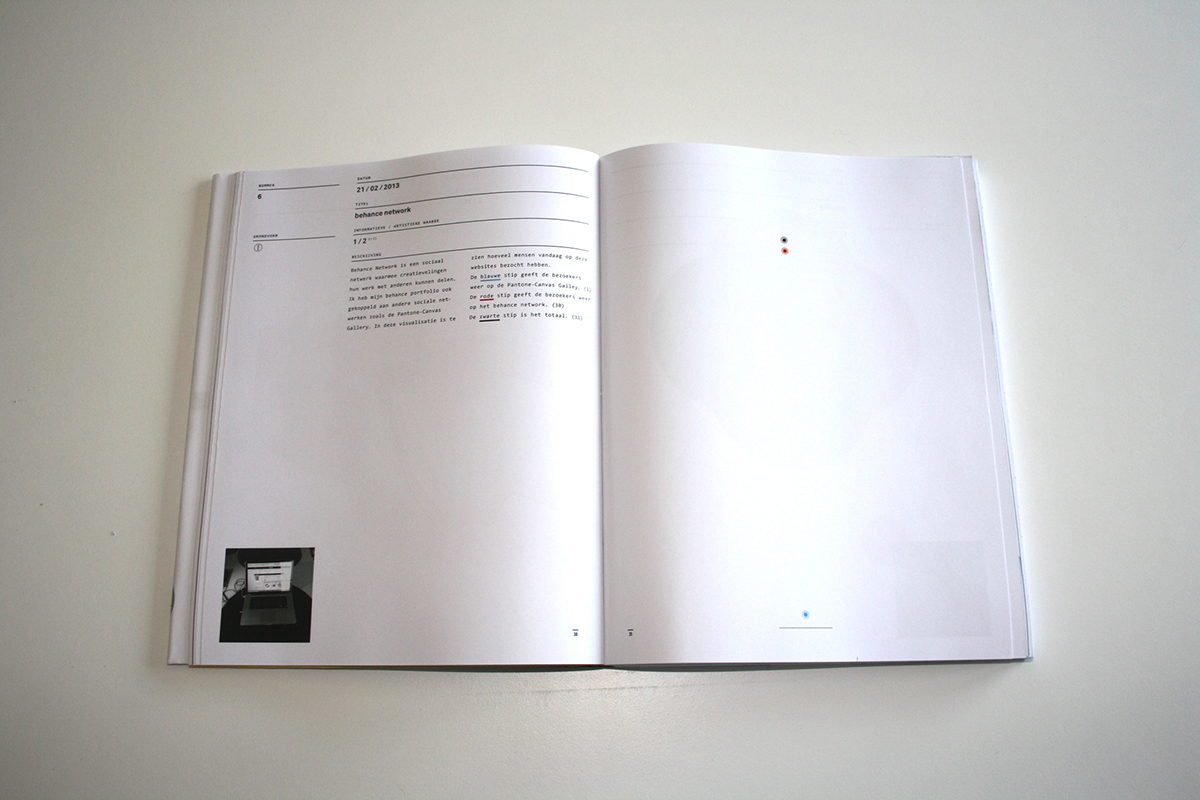
day 6: behance network
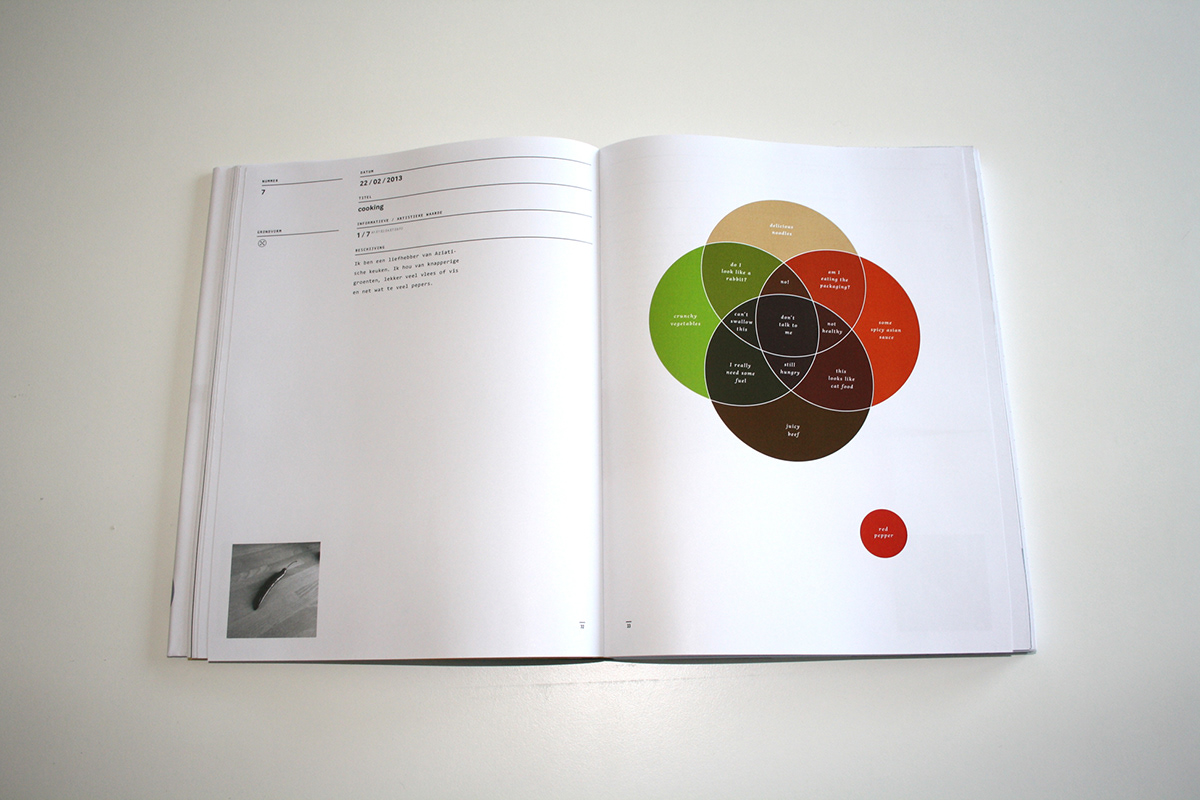
day 7: cooking
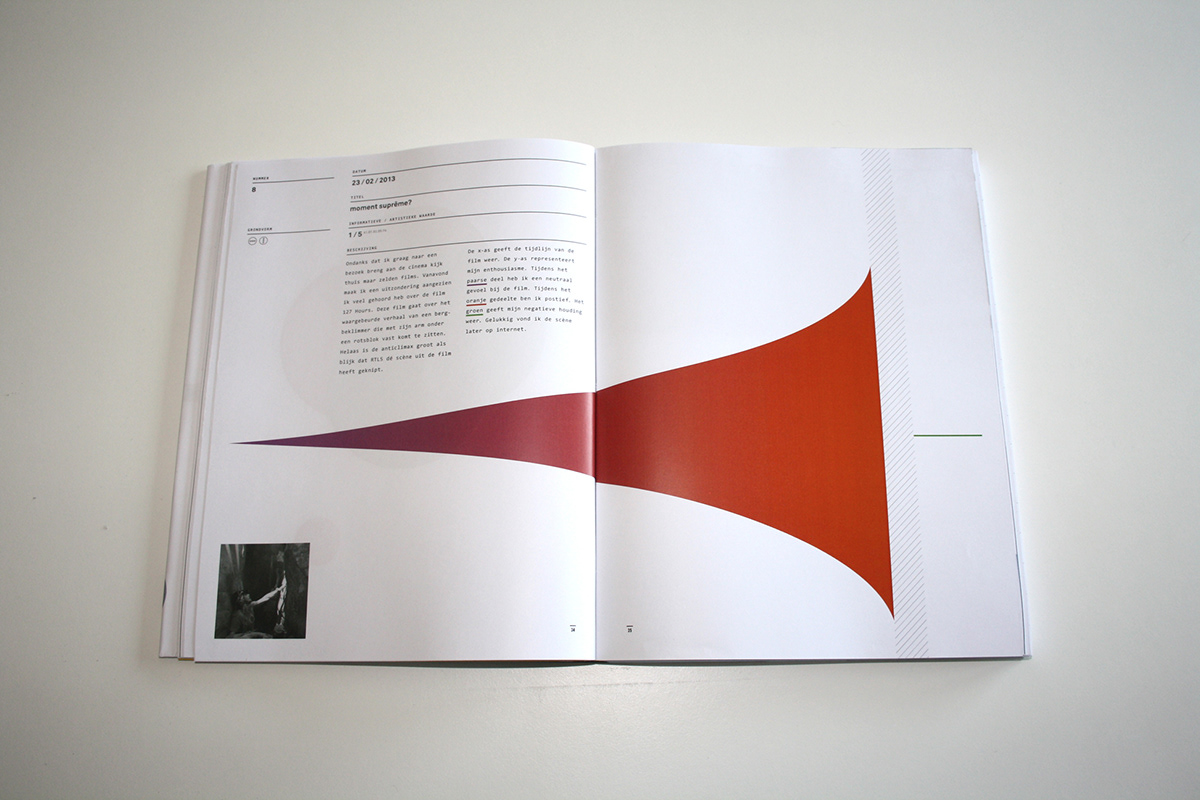
day 8: moment suprême
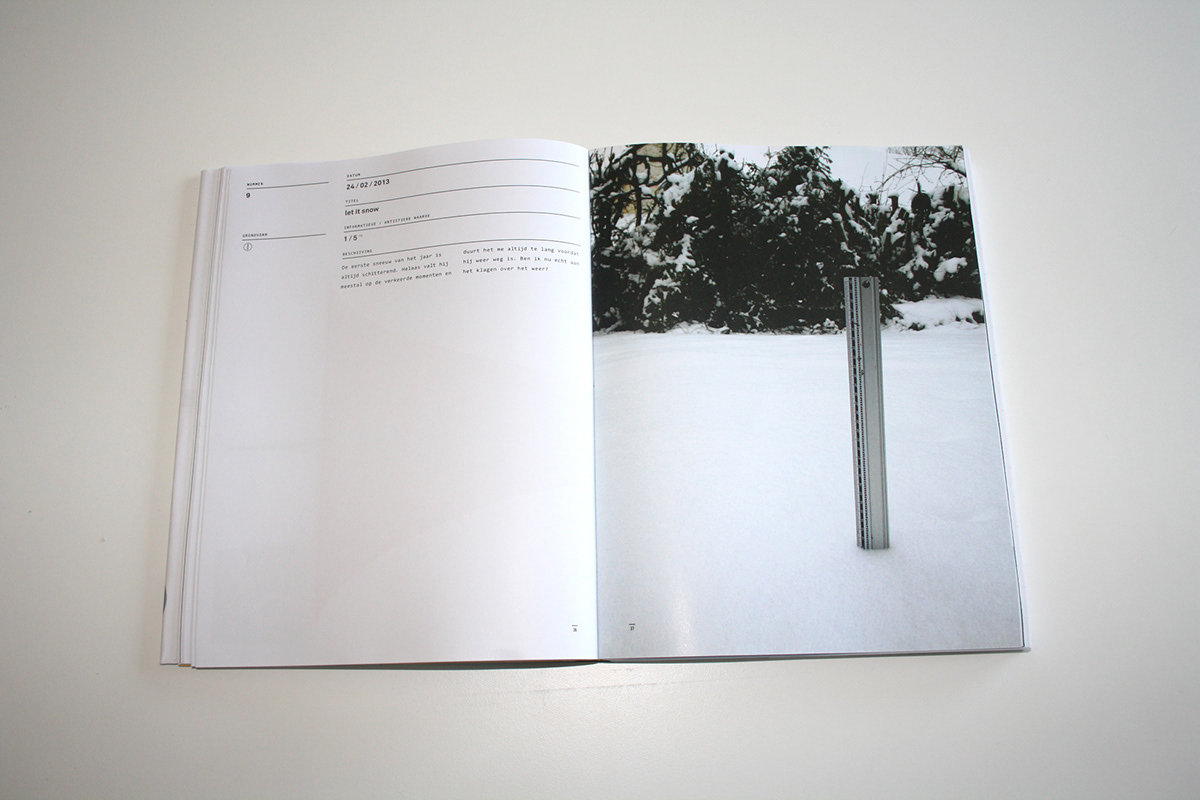
day 9: let it snow
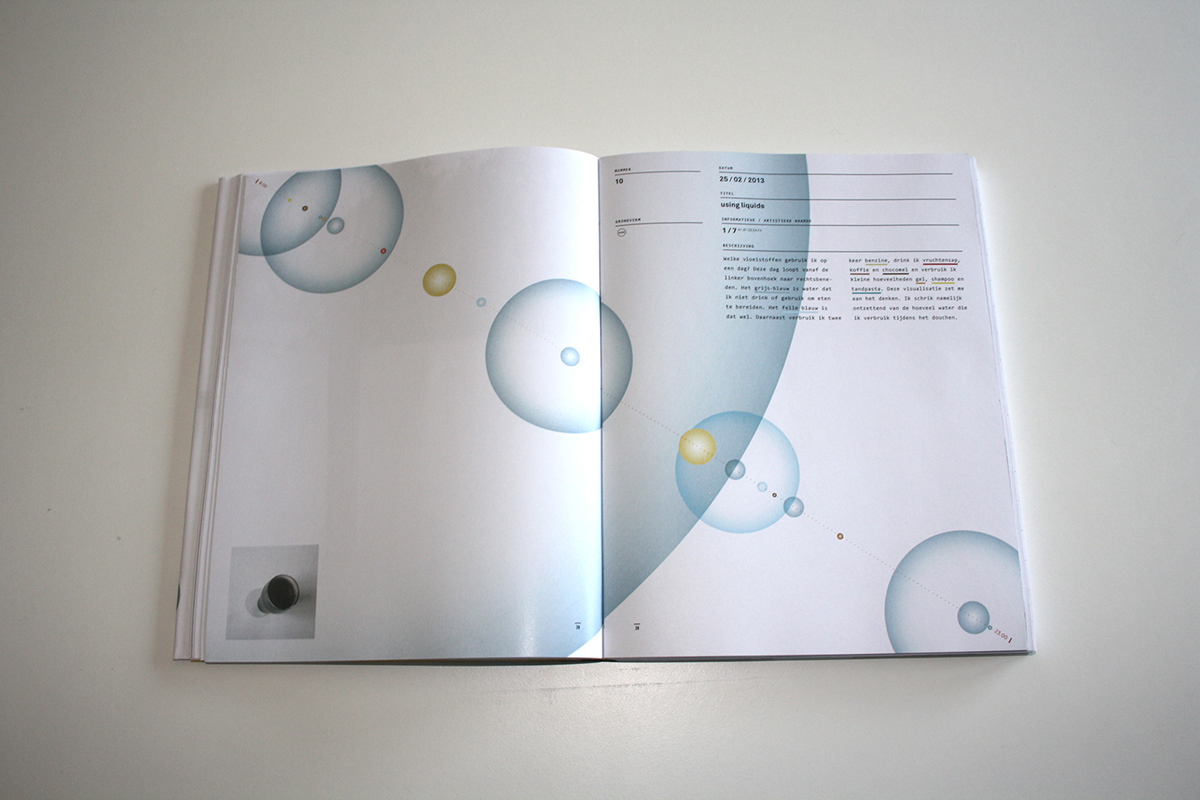
day 10: using liquids
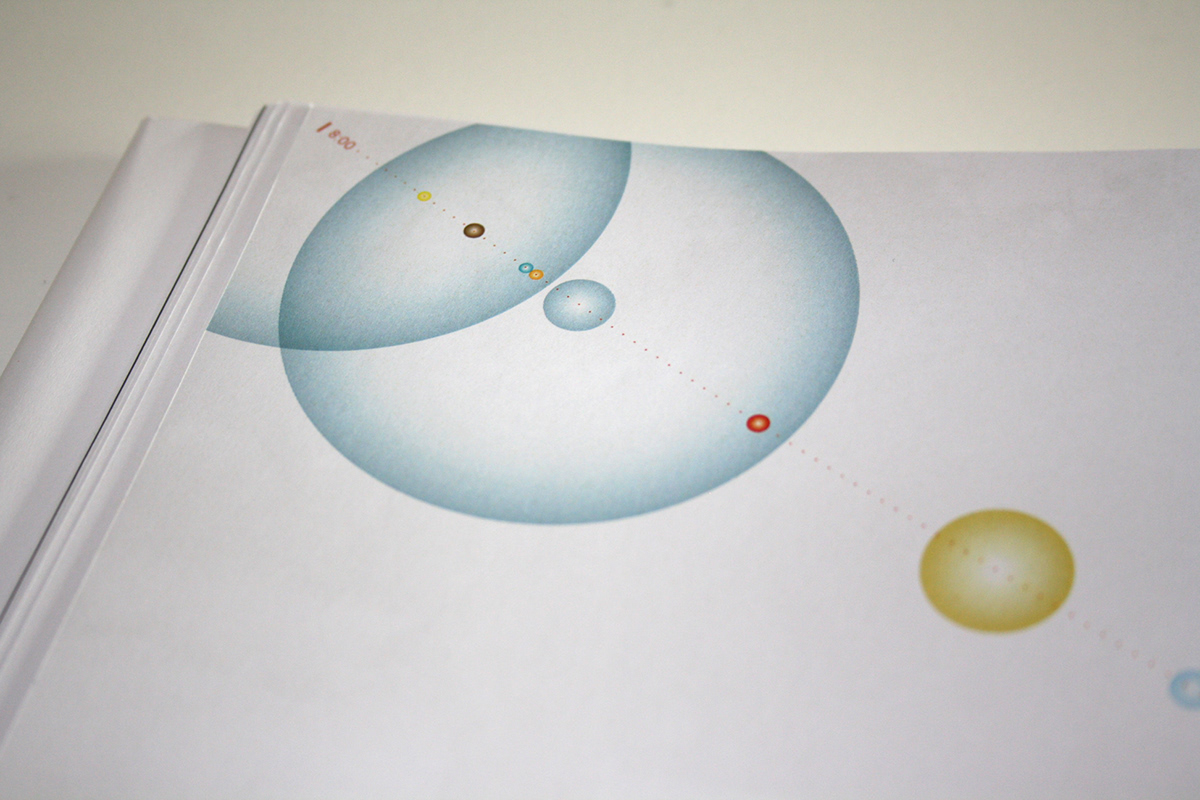
day 10: using liquids (detail)
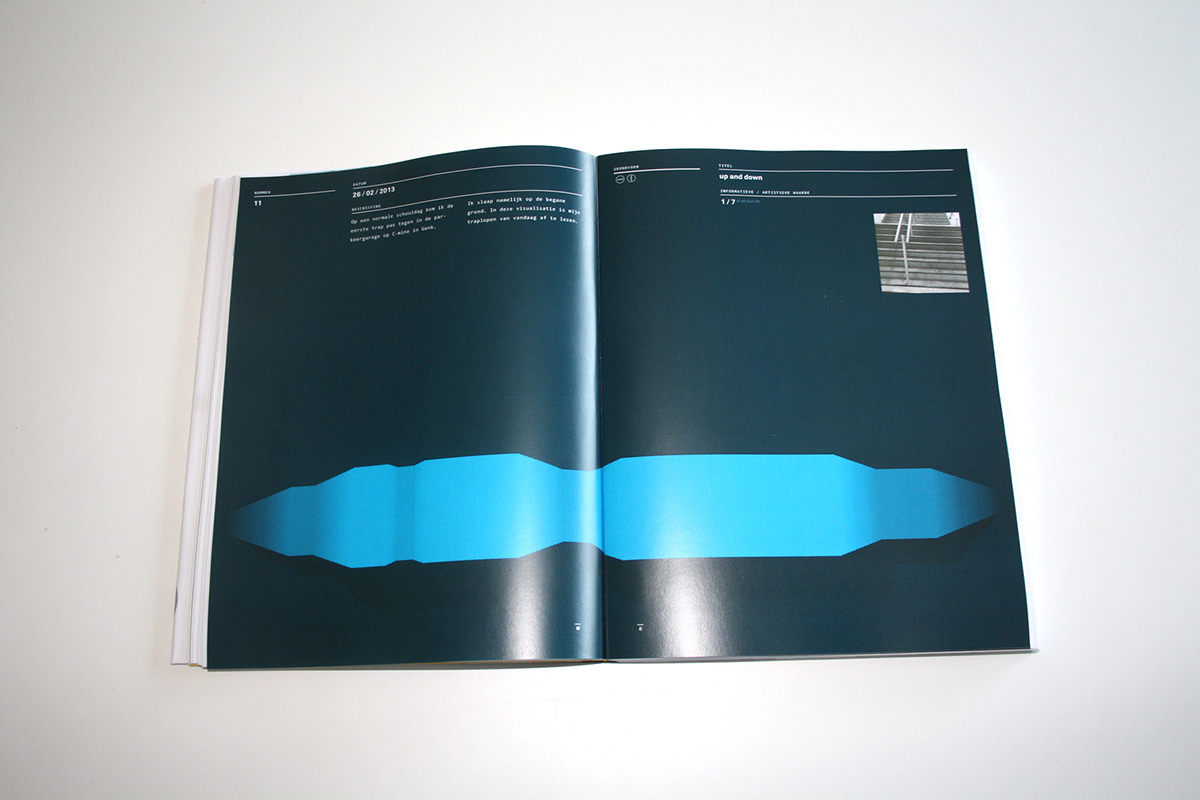
day 11: up and down
day 12: can't stop thinking about you
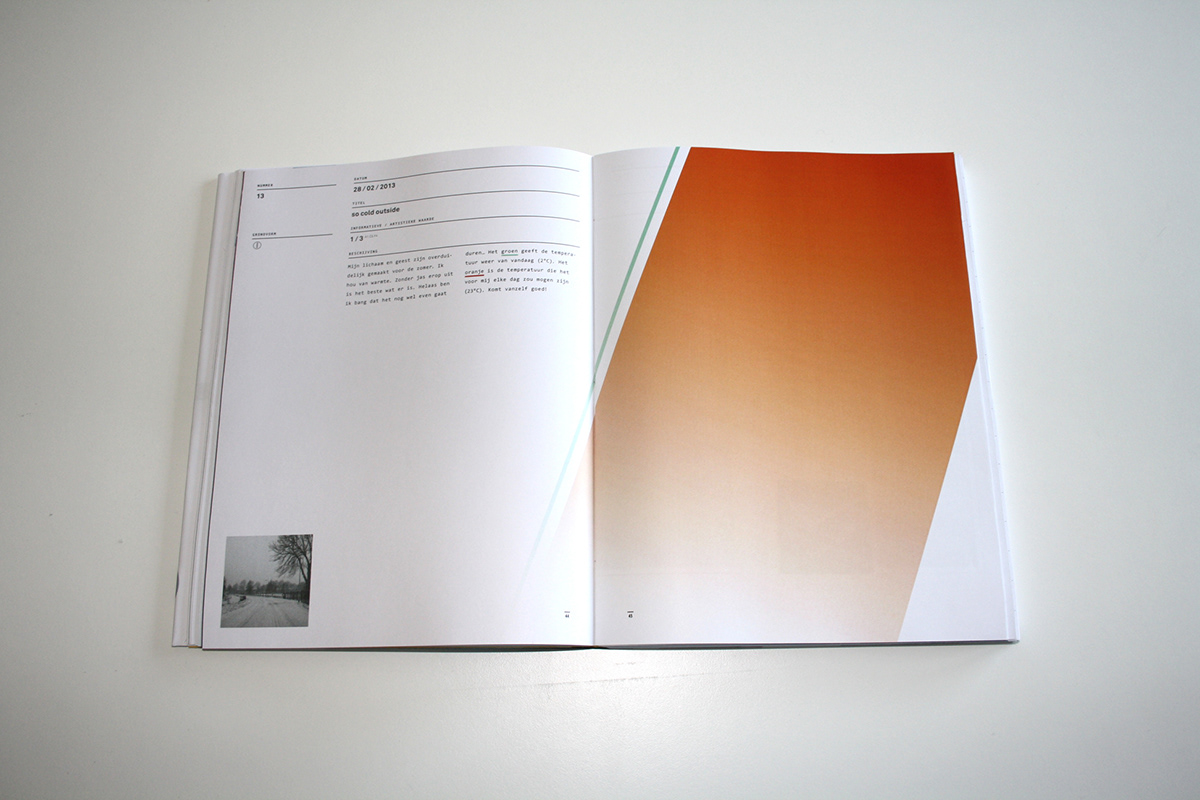
day 13: so cold outside
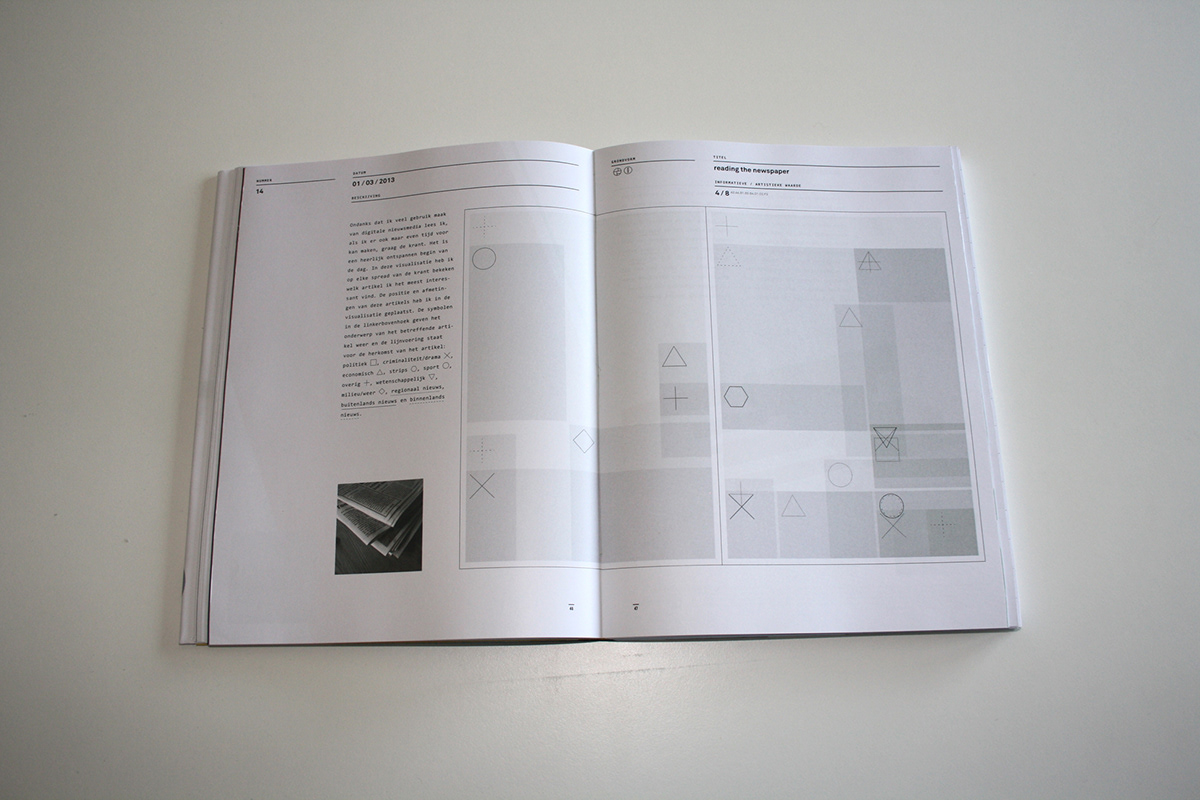
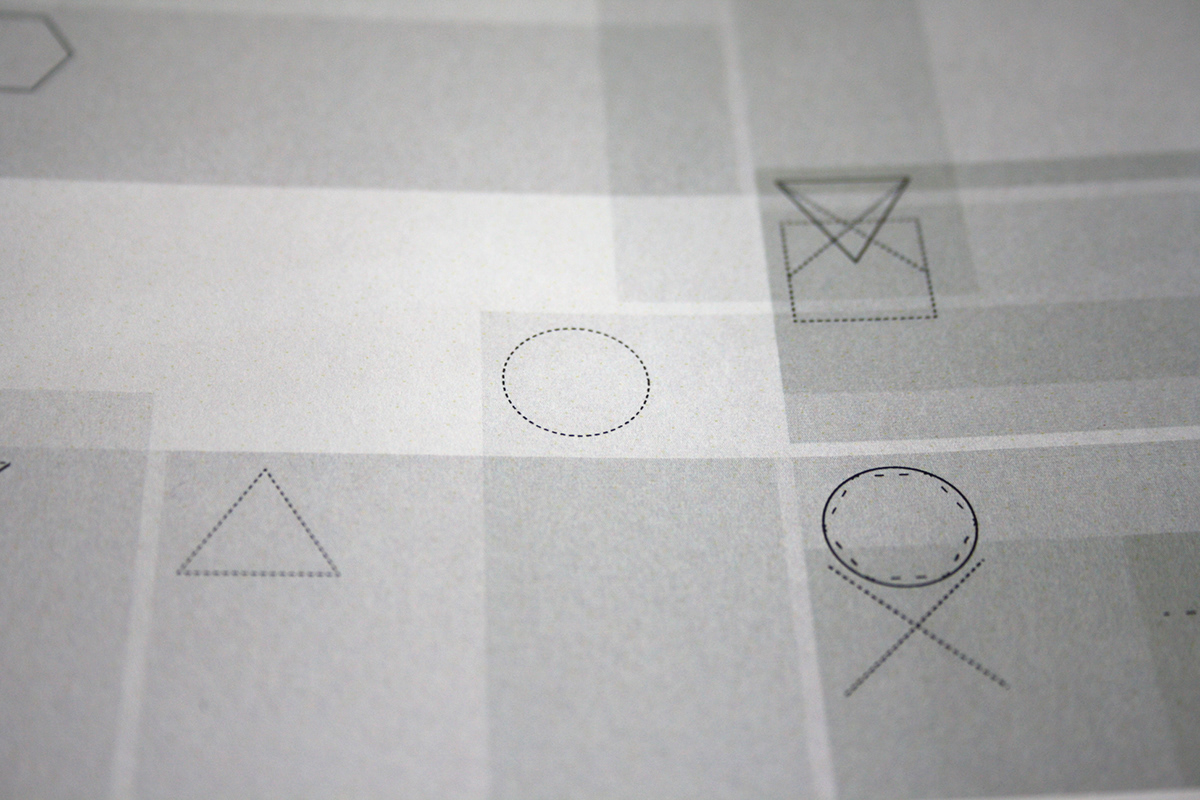
day 14: reading the newspaper
day 14: reading the newspaper (detail)
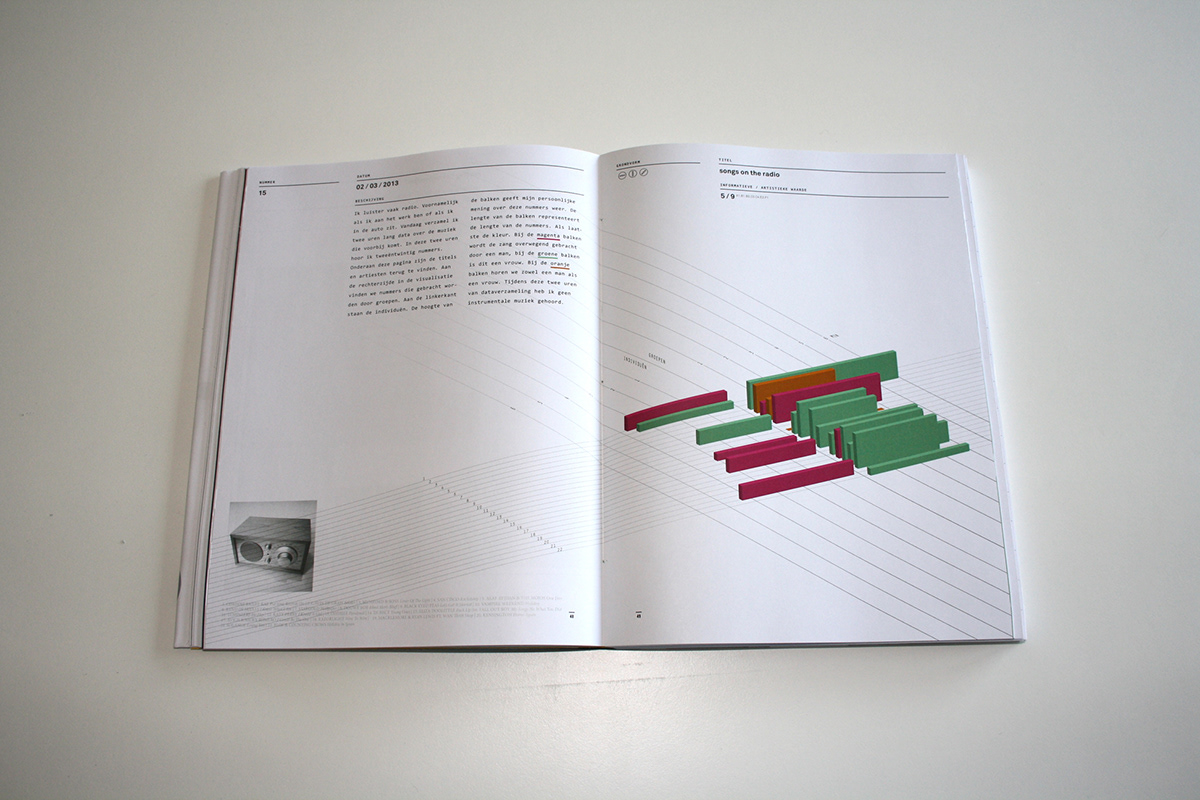
day 15: songs on the radio
day 15: songs on the radio (detail)
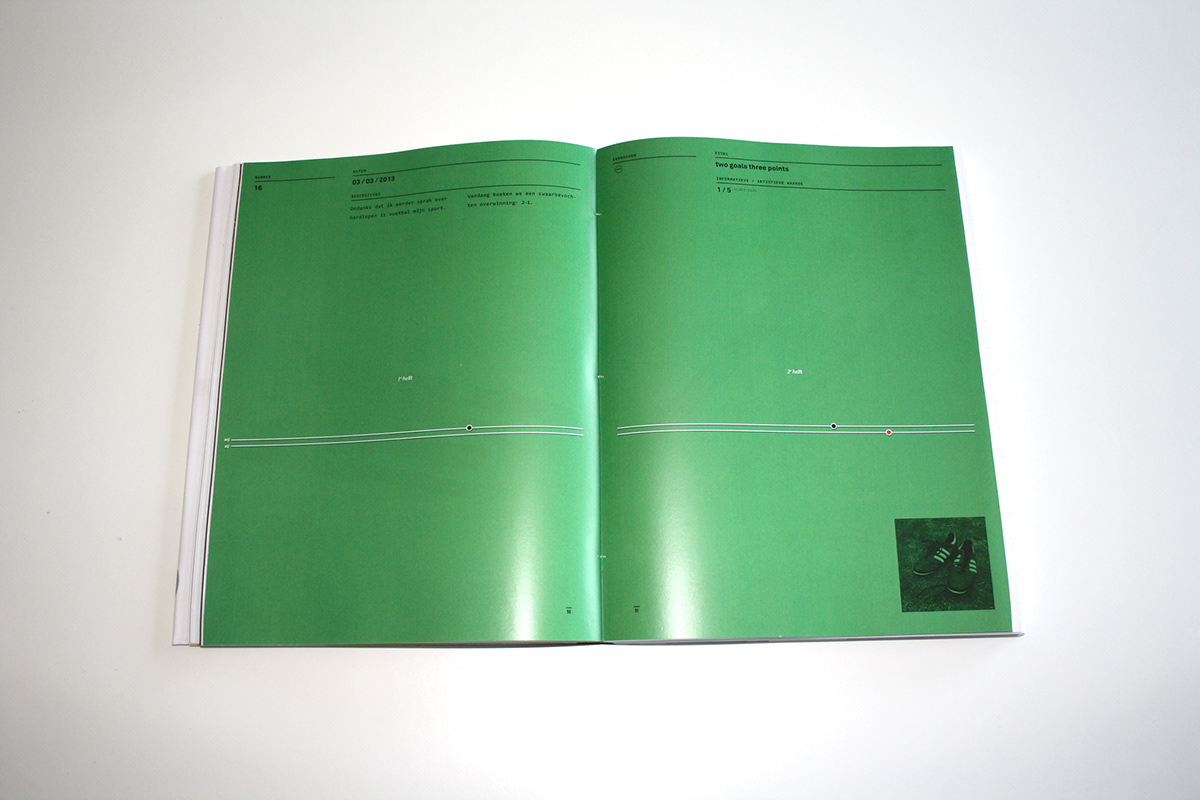
day 16: two goals
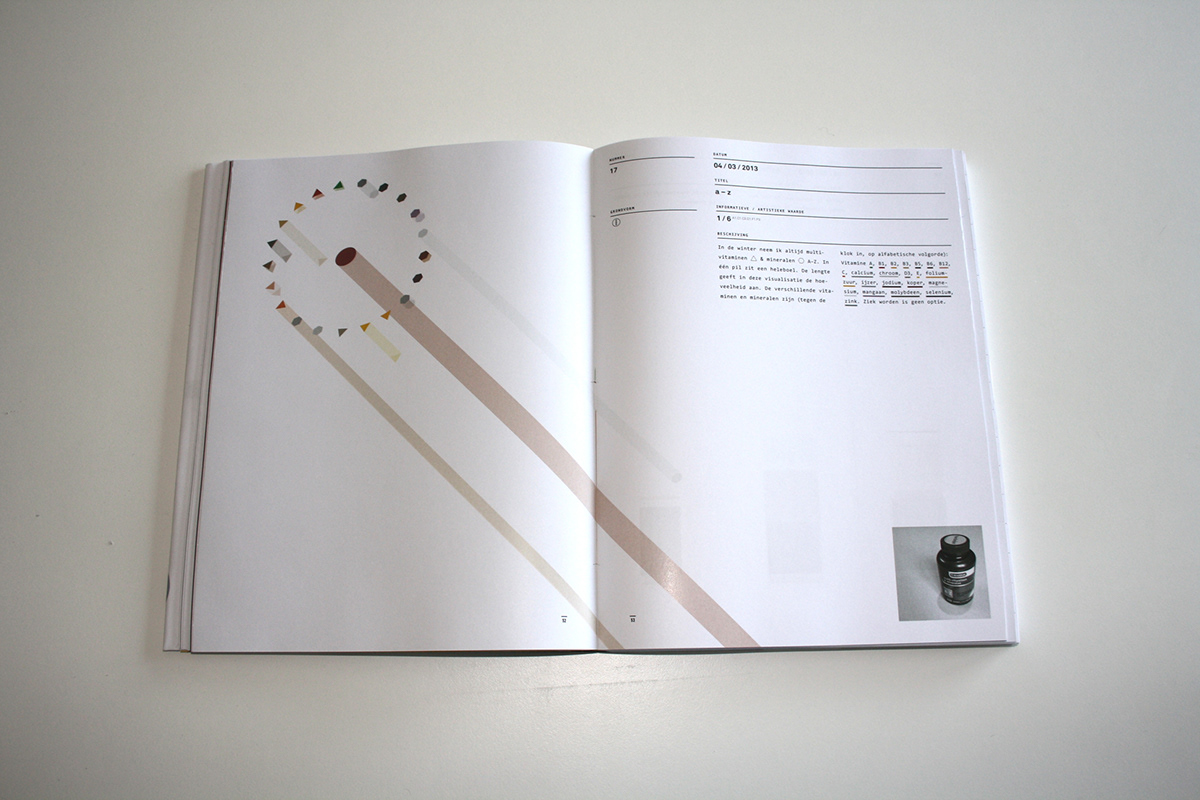
day 17: a-z
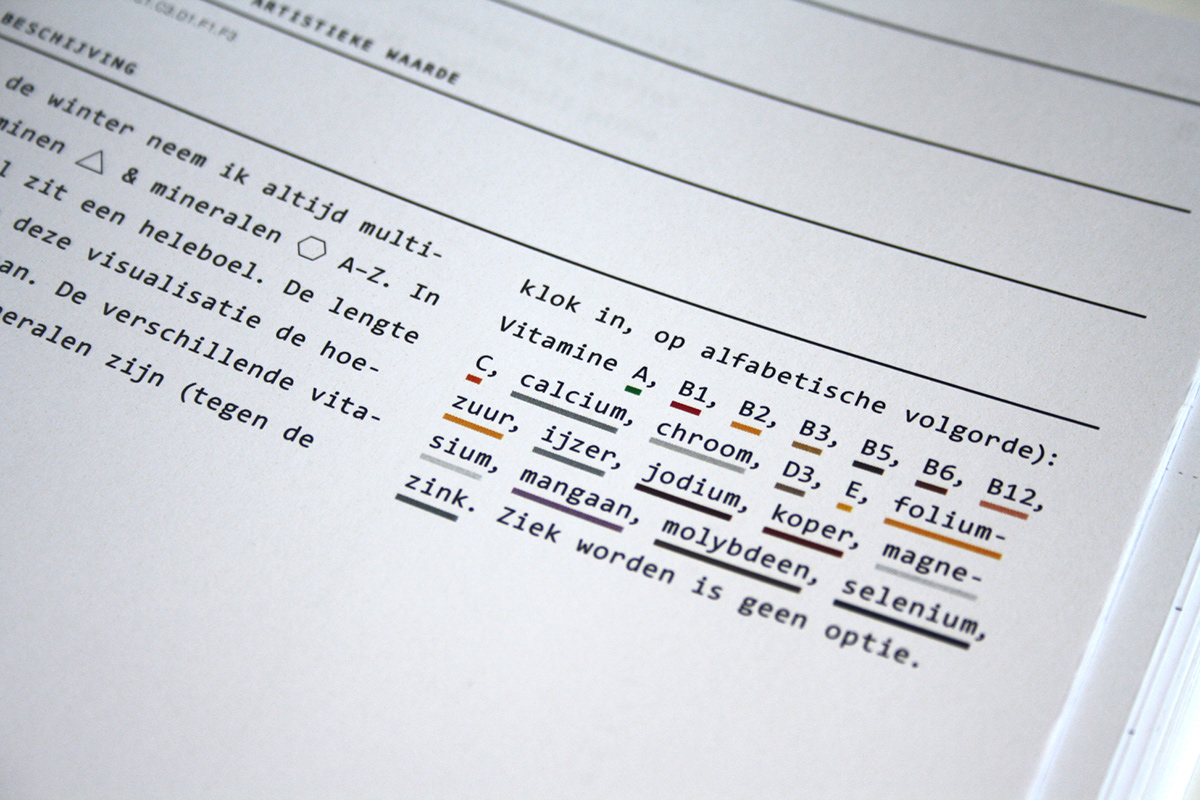
day 17: a-z (detail)
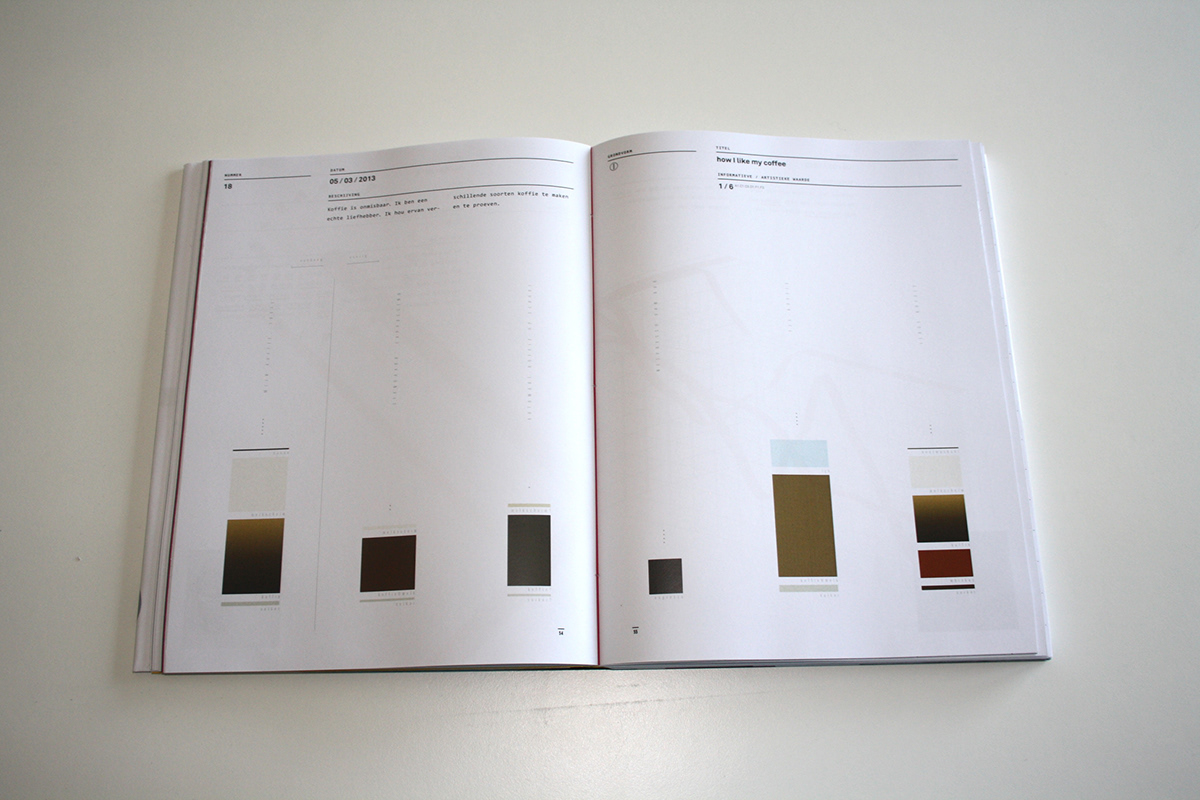
day 18: how I like my coffee
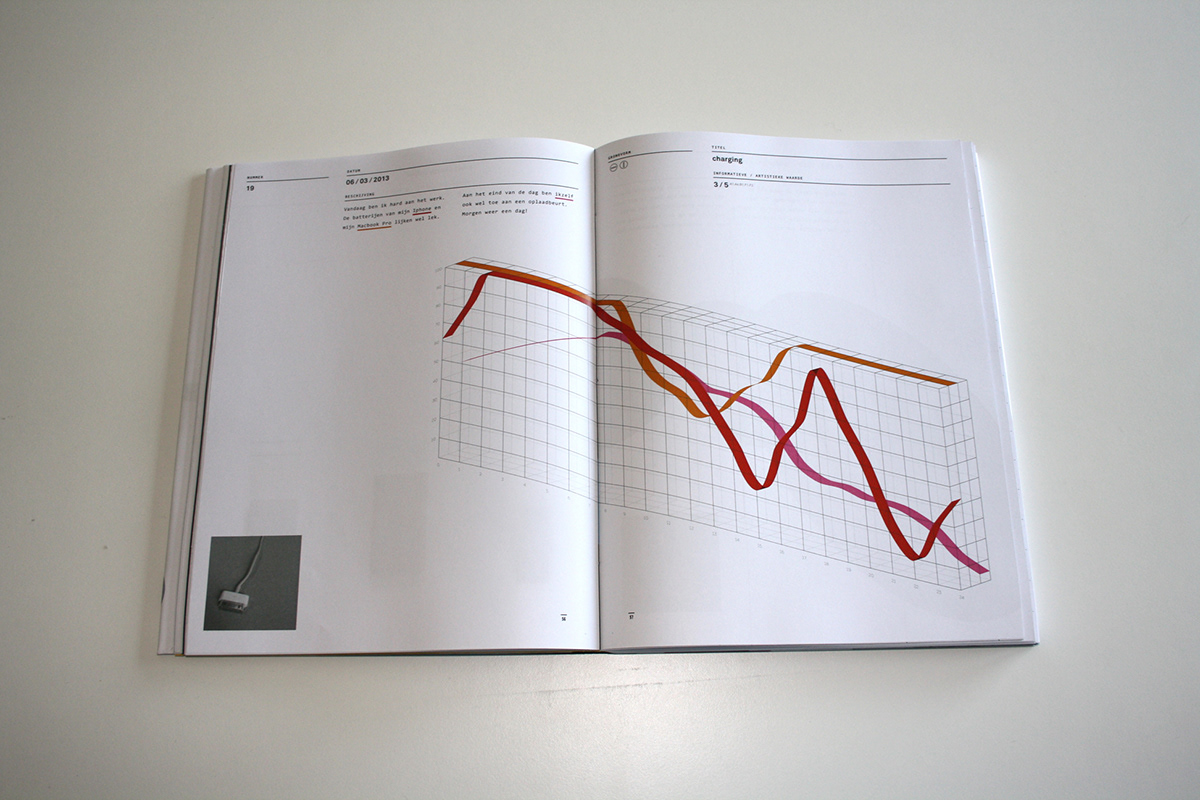
day 19: charging
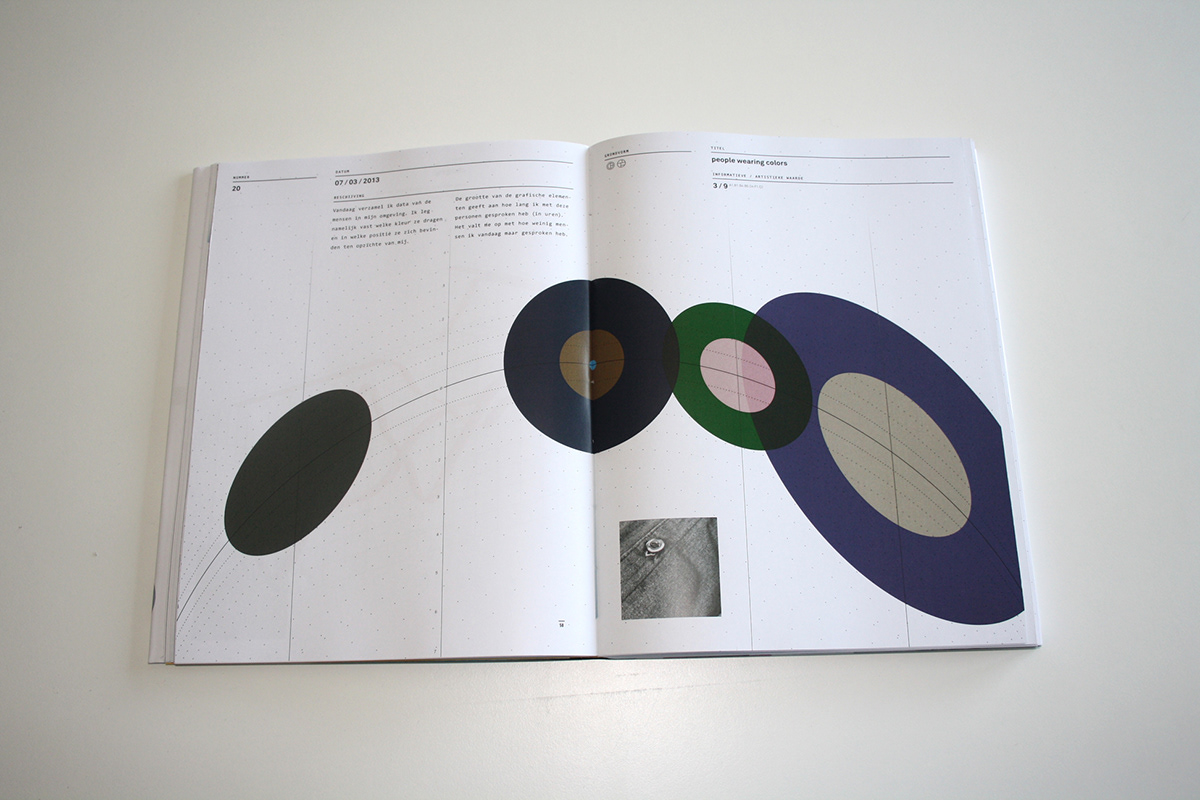
day 20: people wearing clothes
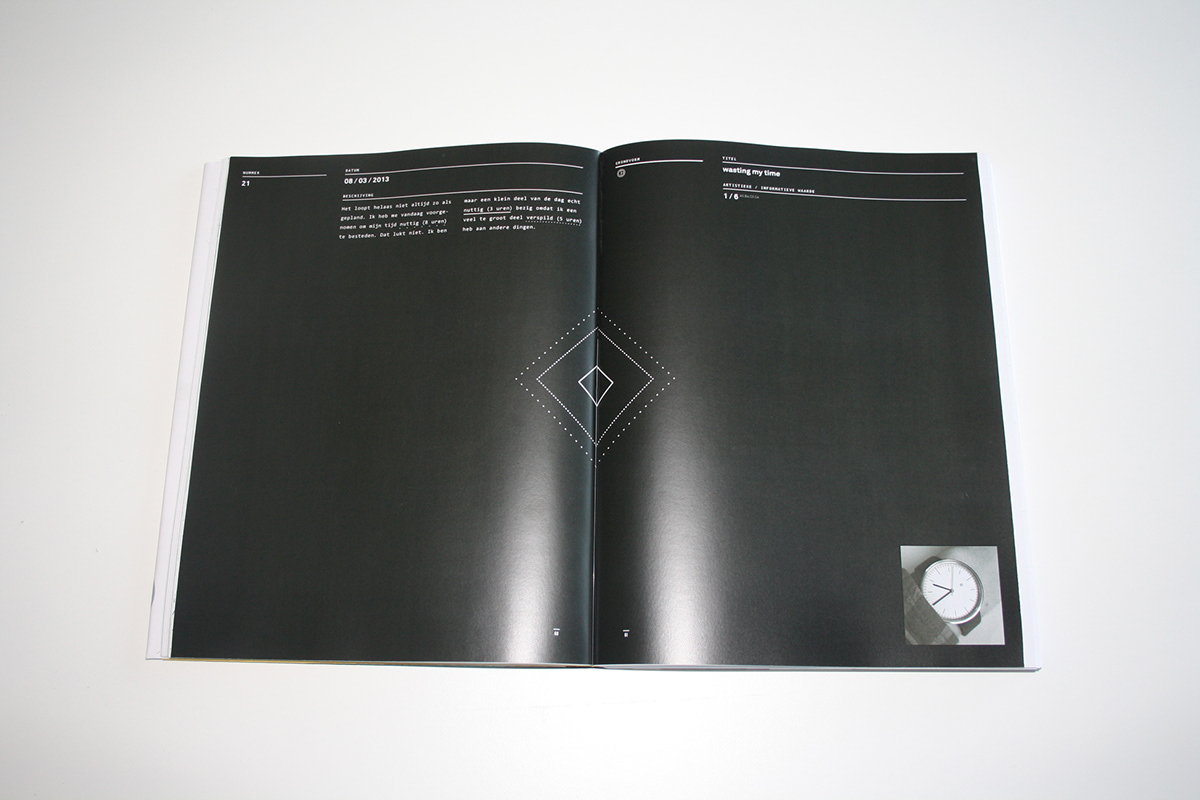
day 21: wasting my time
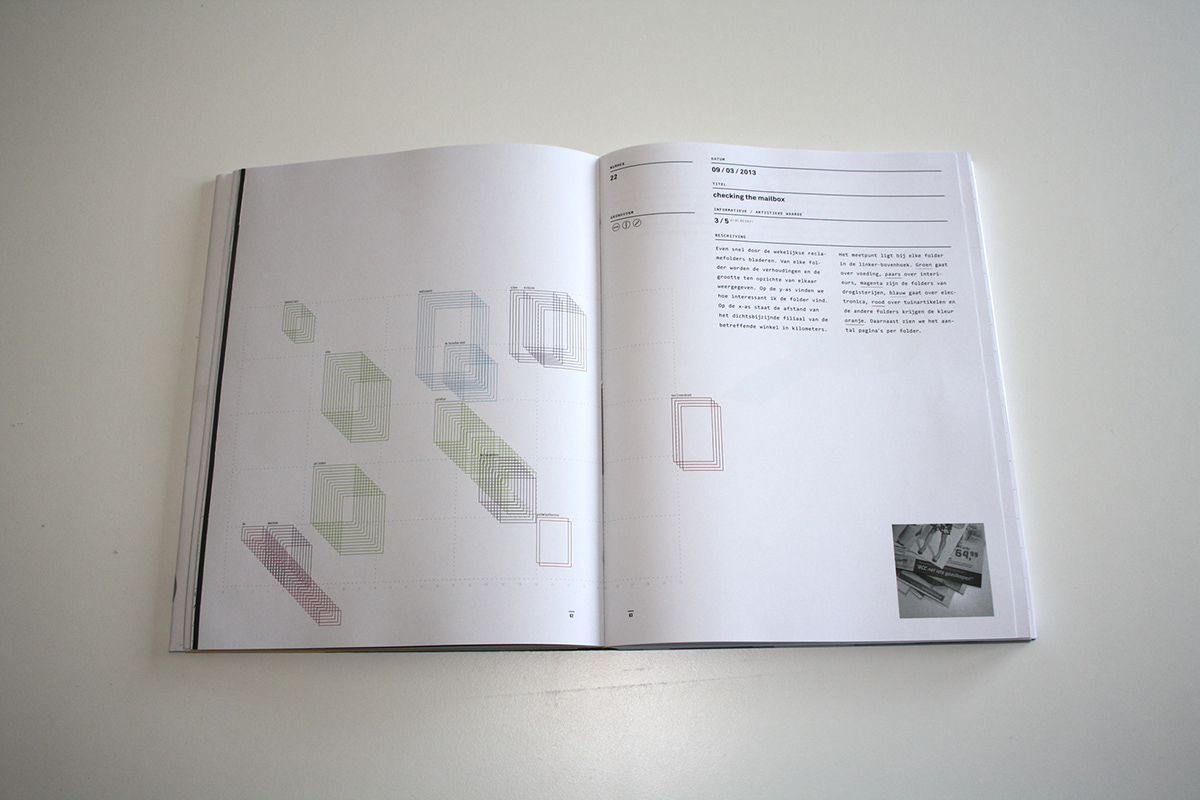
day 22: checking the mail
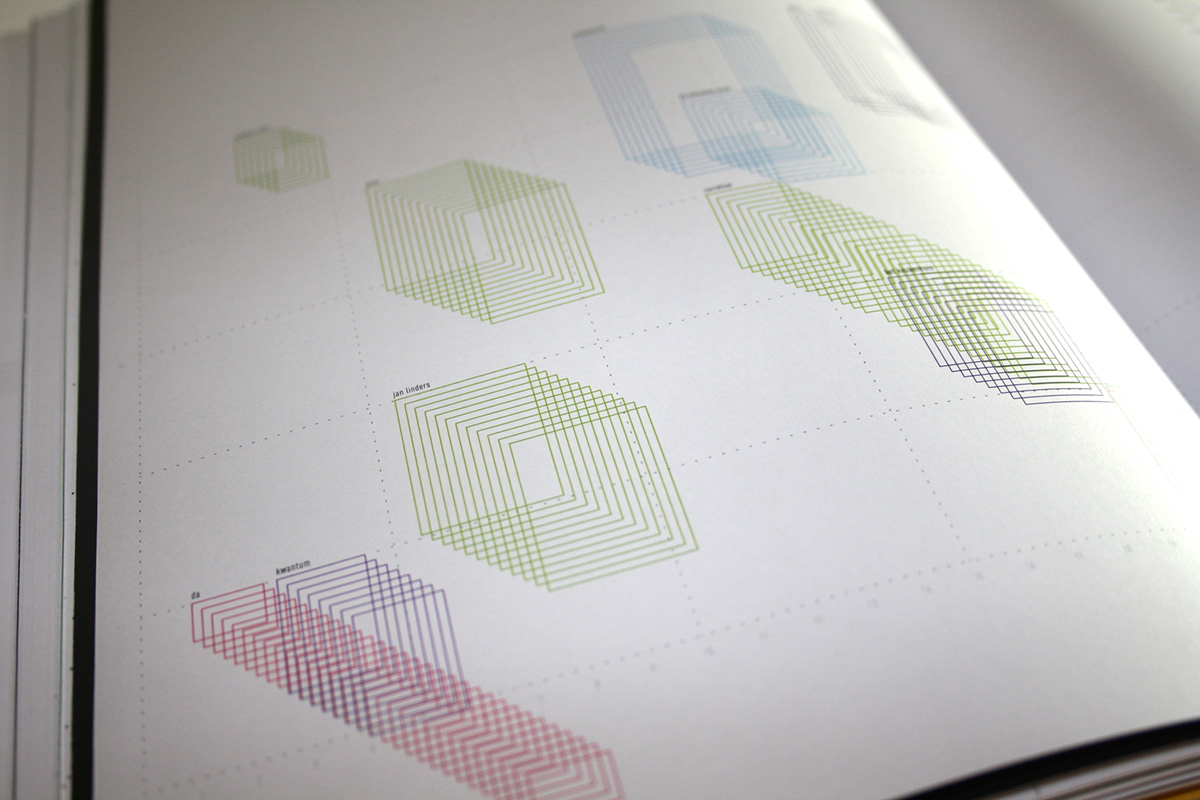
day 22: checking the mail (detail)
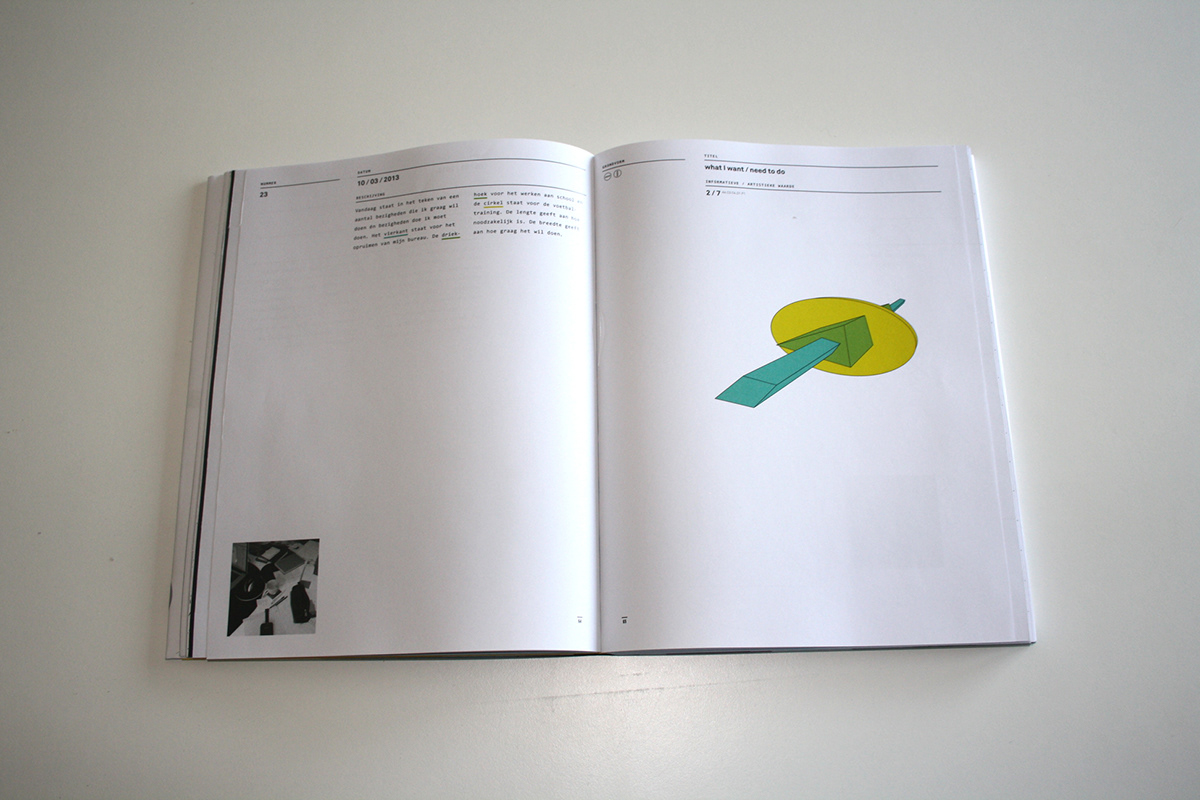
day 23: what I want/need
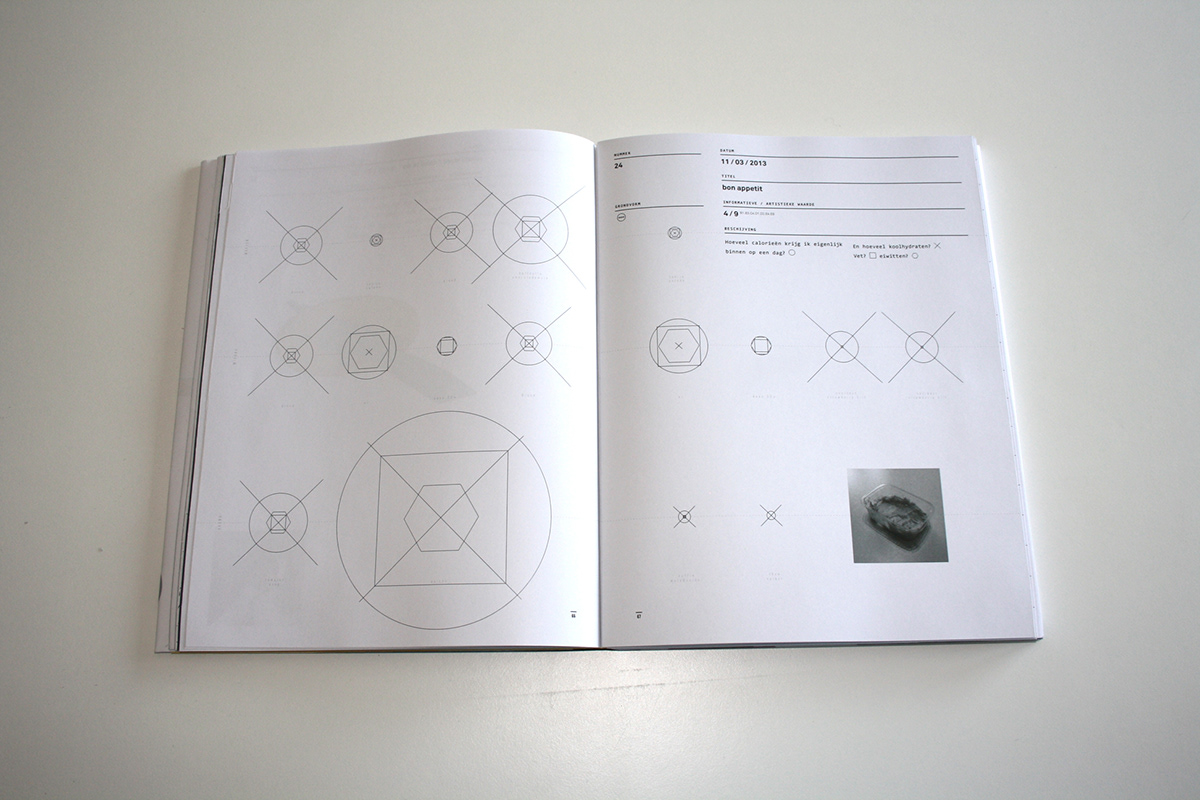
day 24: bon appetit
day 24: bon appetit (detail)
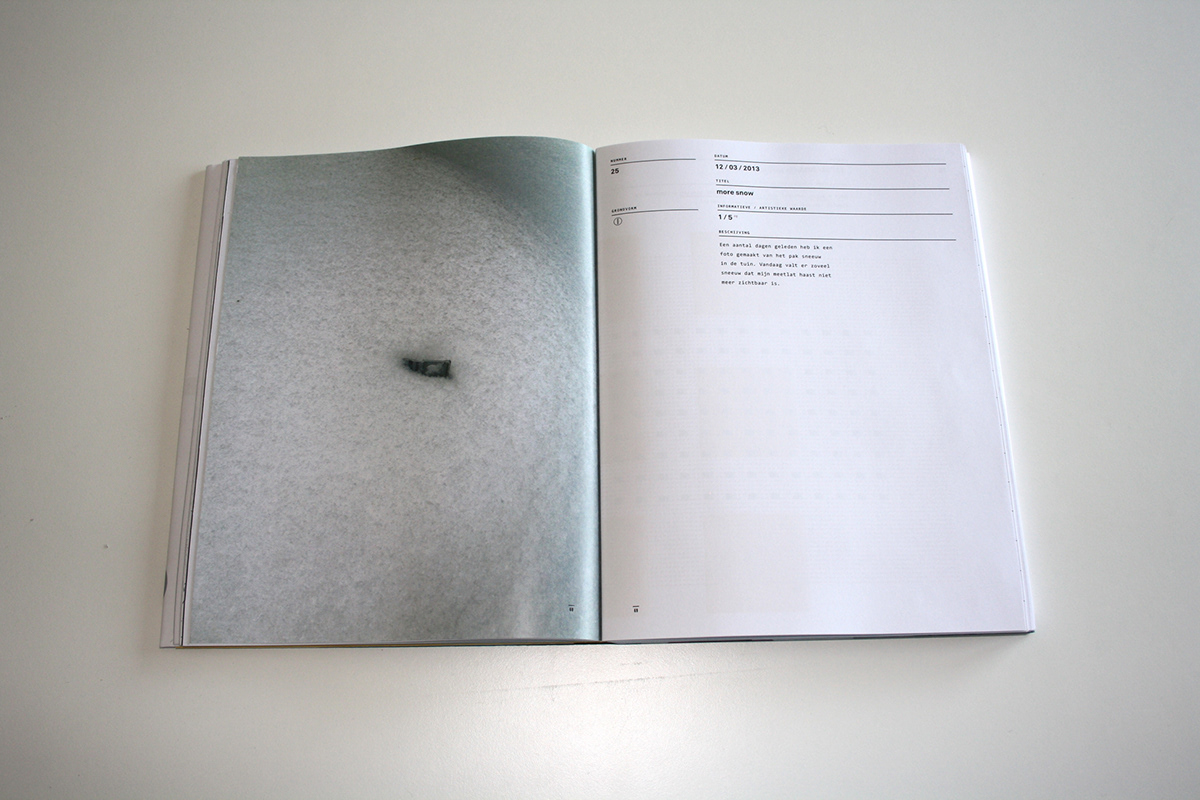
day 25: more snow
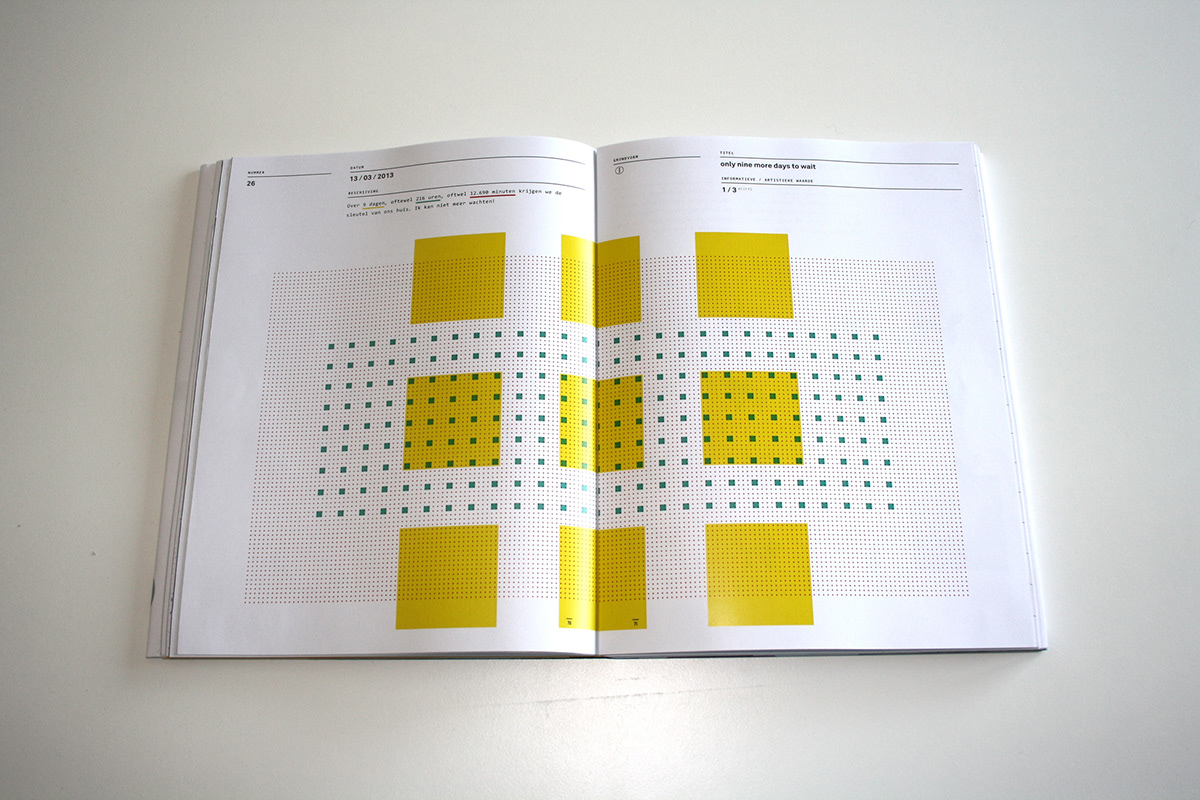
day 26: only nine more days
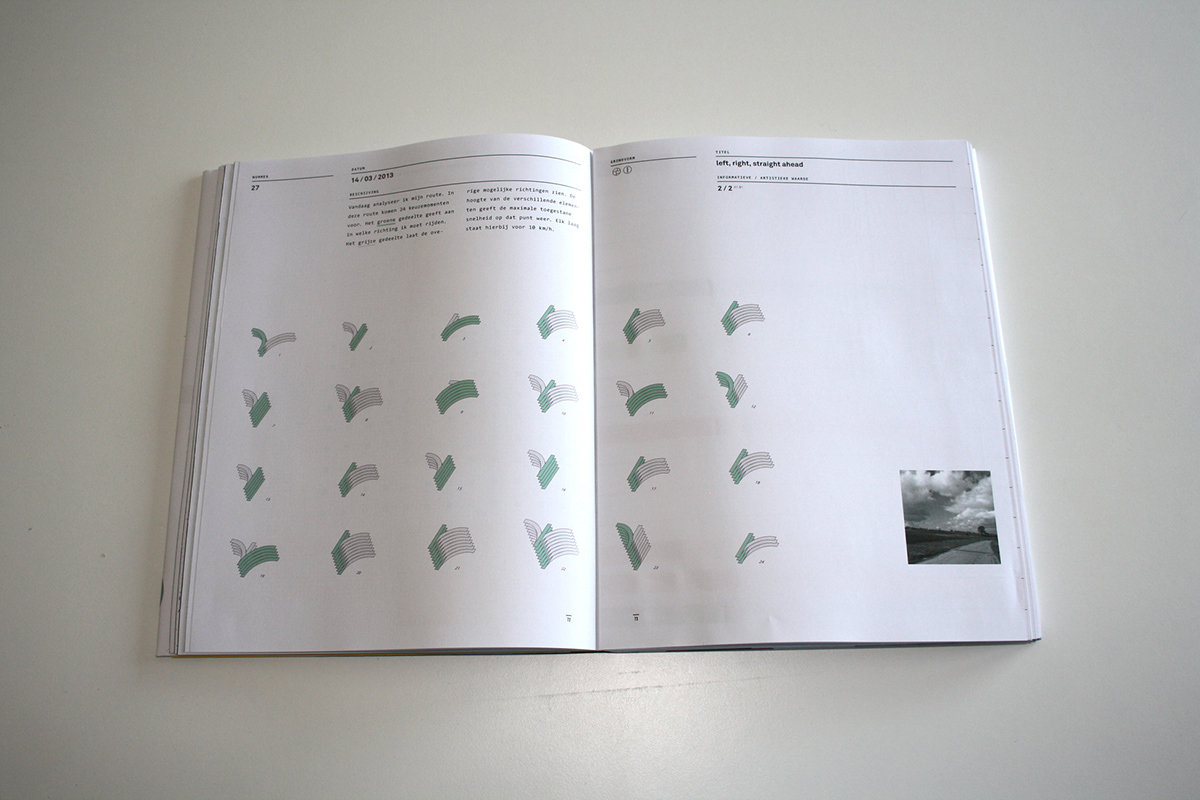
day 27: left, right, straight ahead
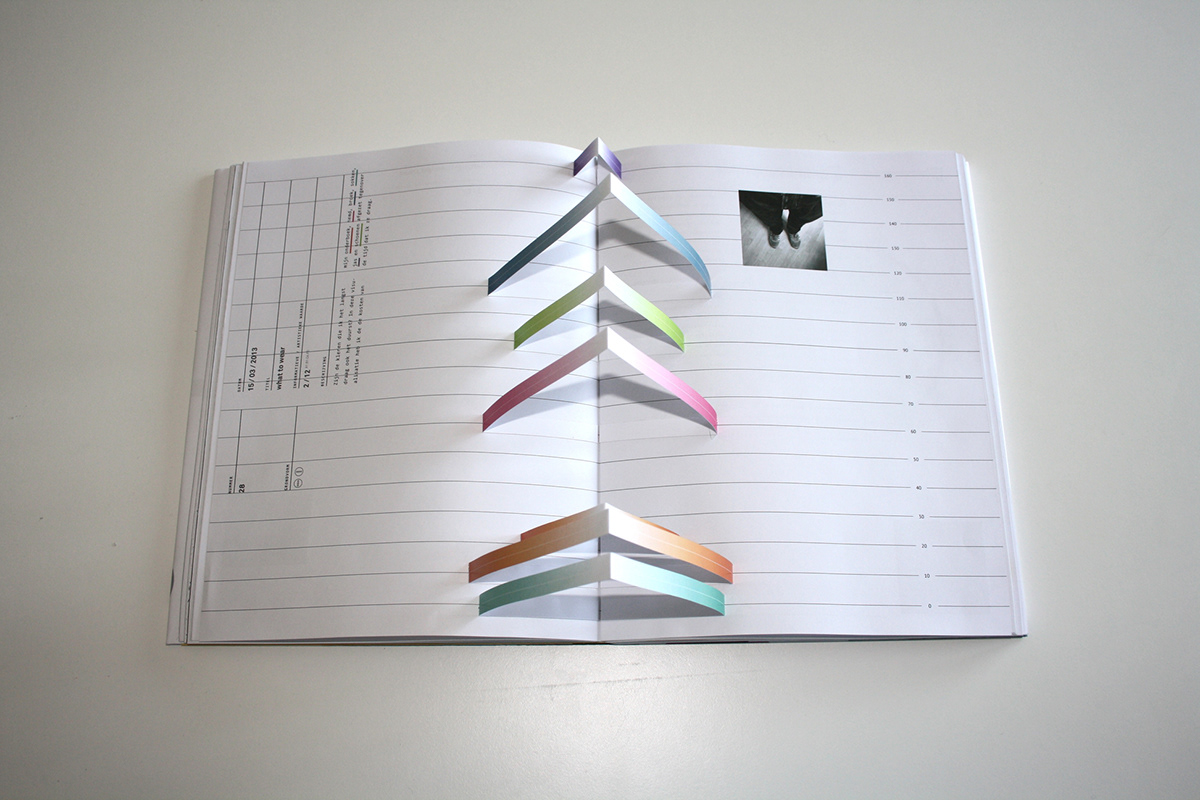
day 28: what to wear
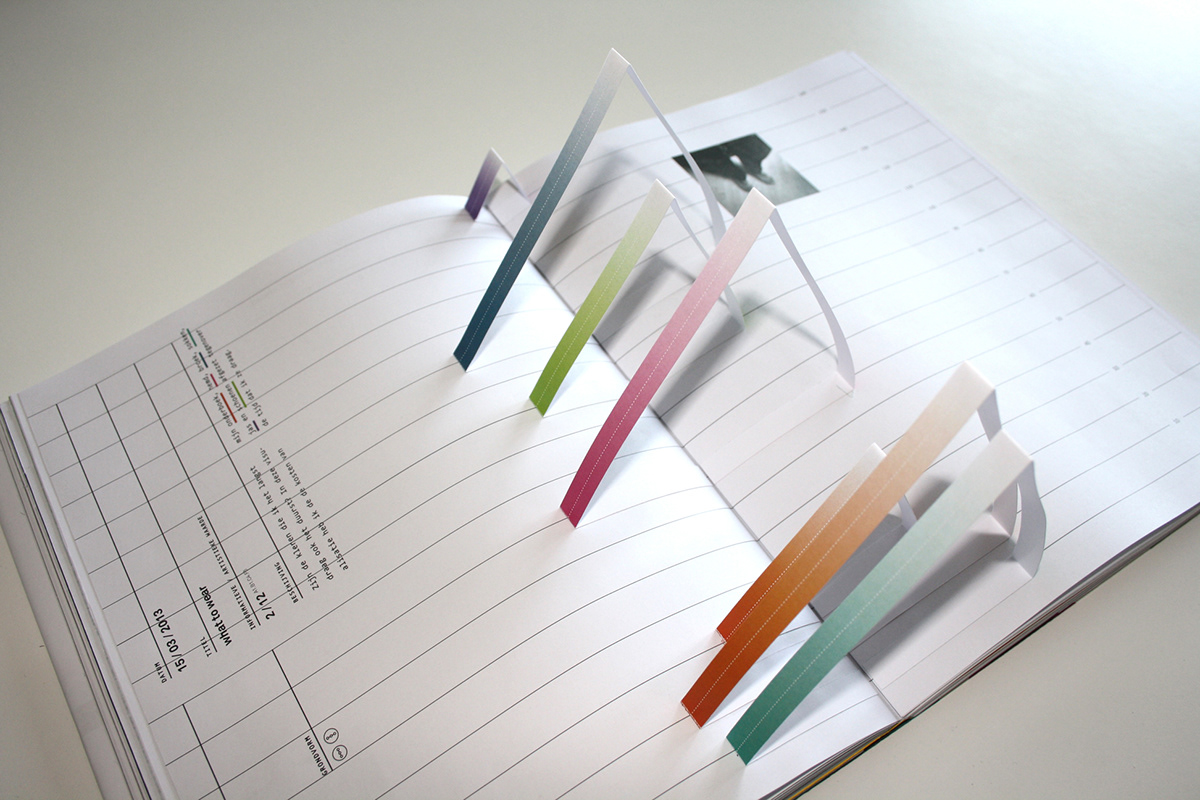
day 28: what to wear (datails)
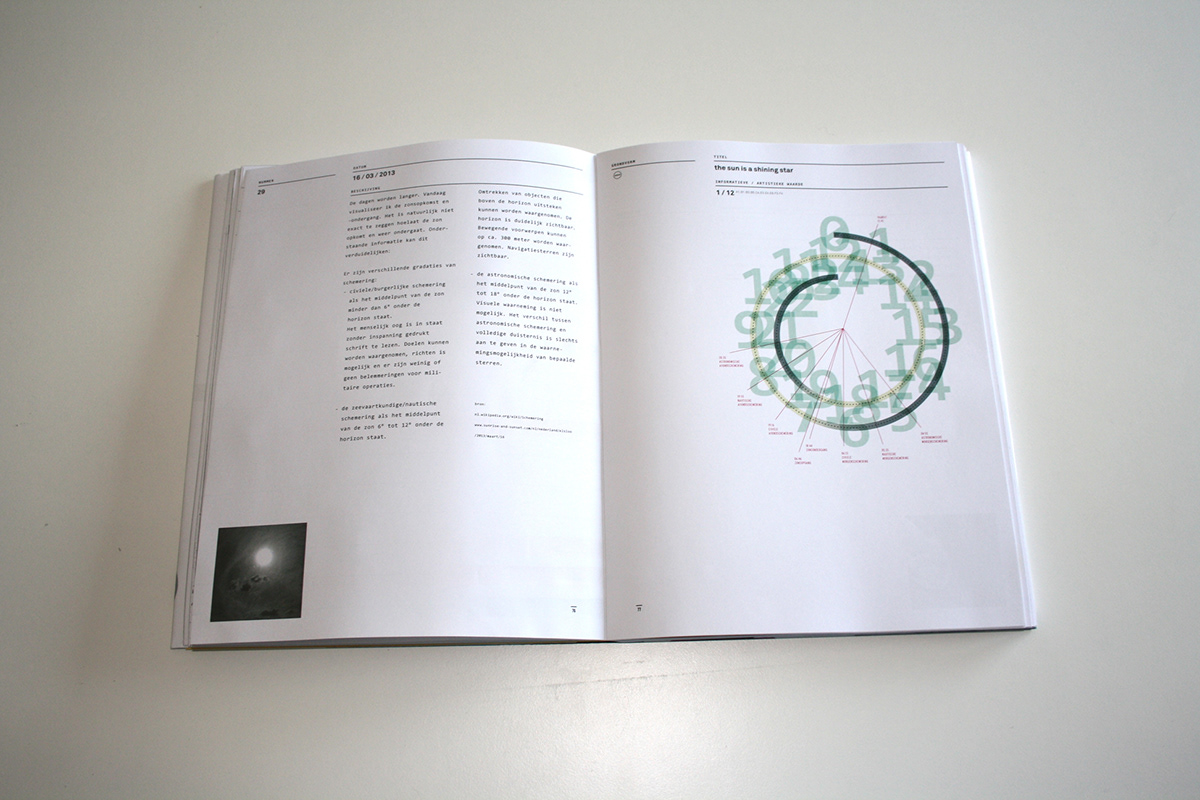
day 29: the sun is a shining star
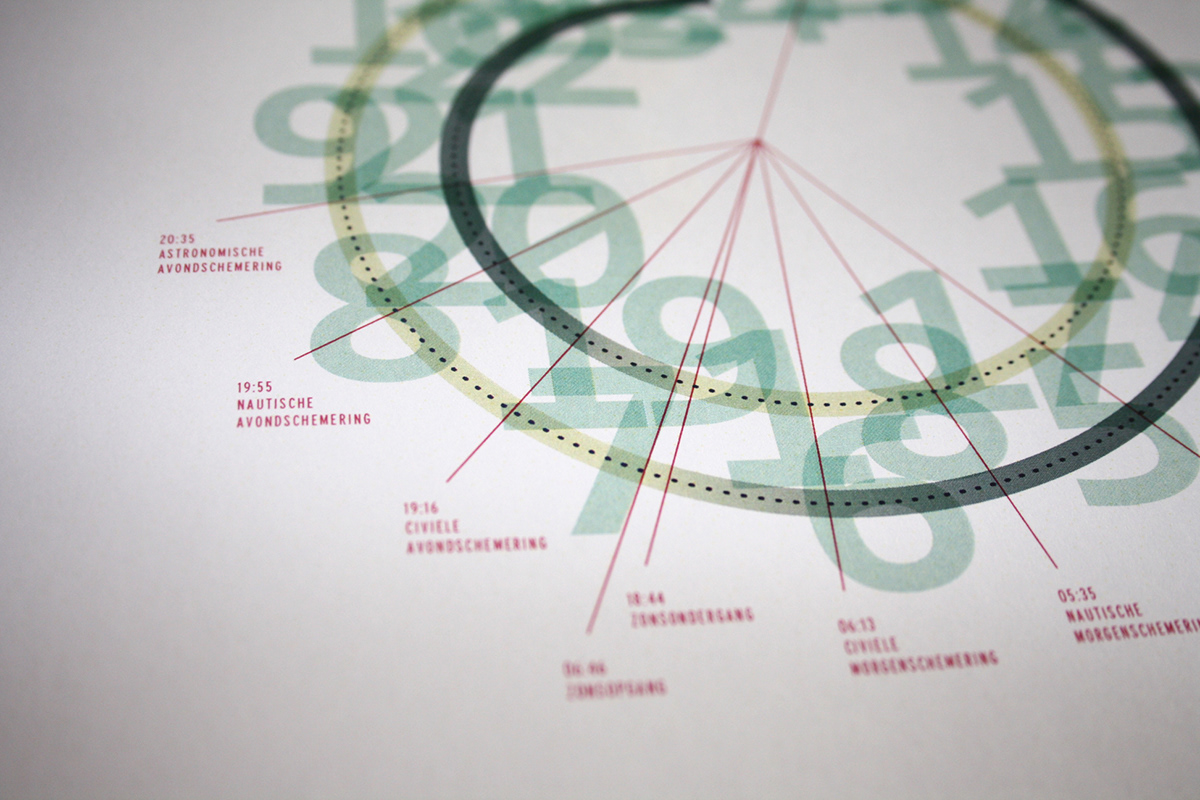
day 29: the sun is a shining star (detail)
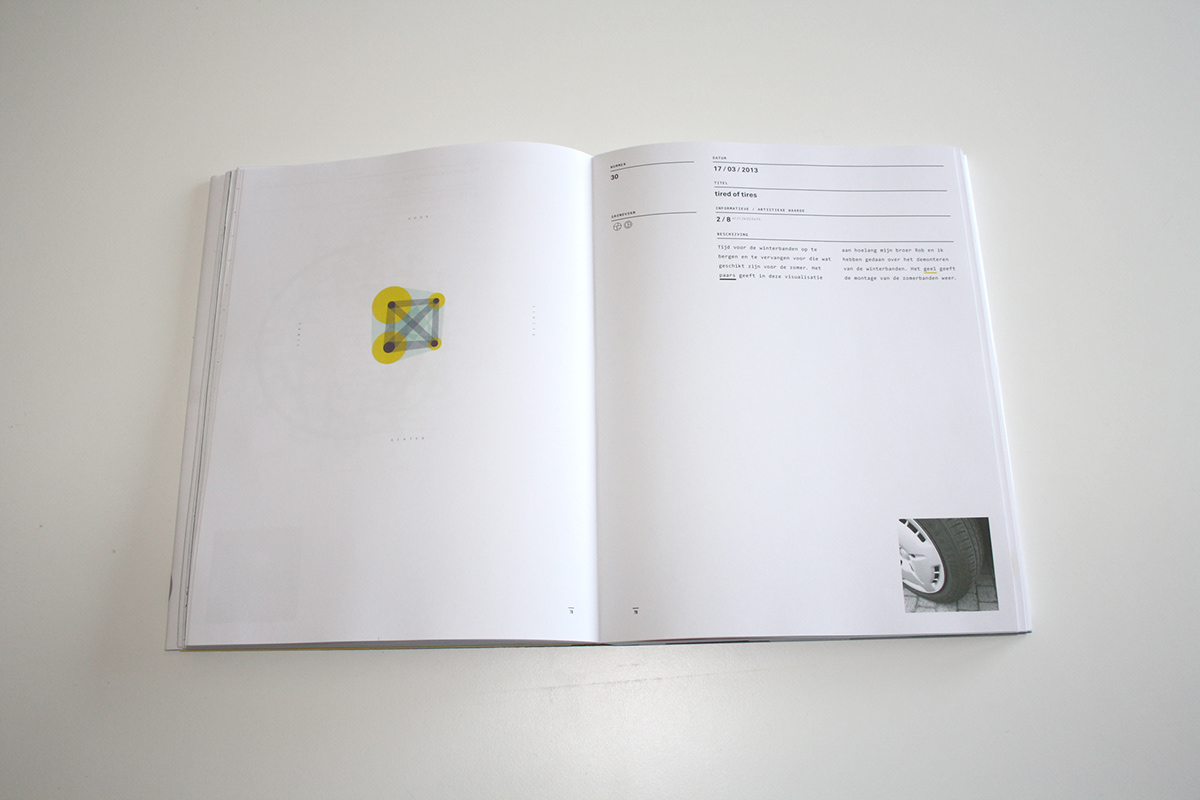
day 30: tired of tires
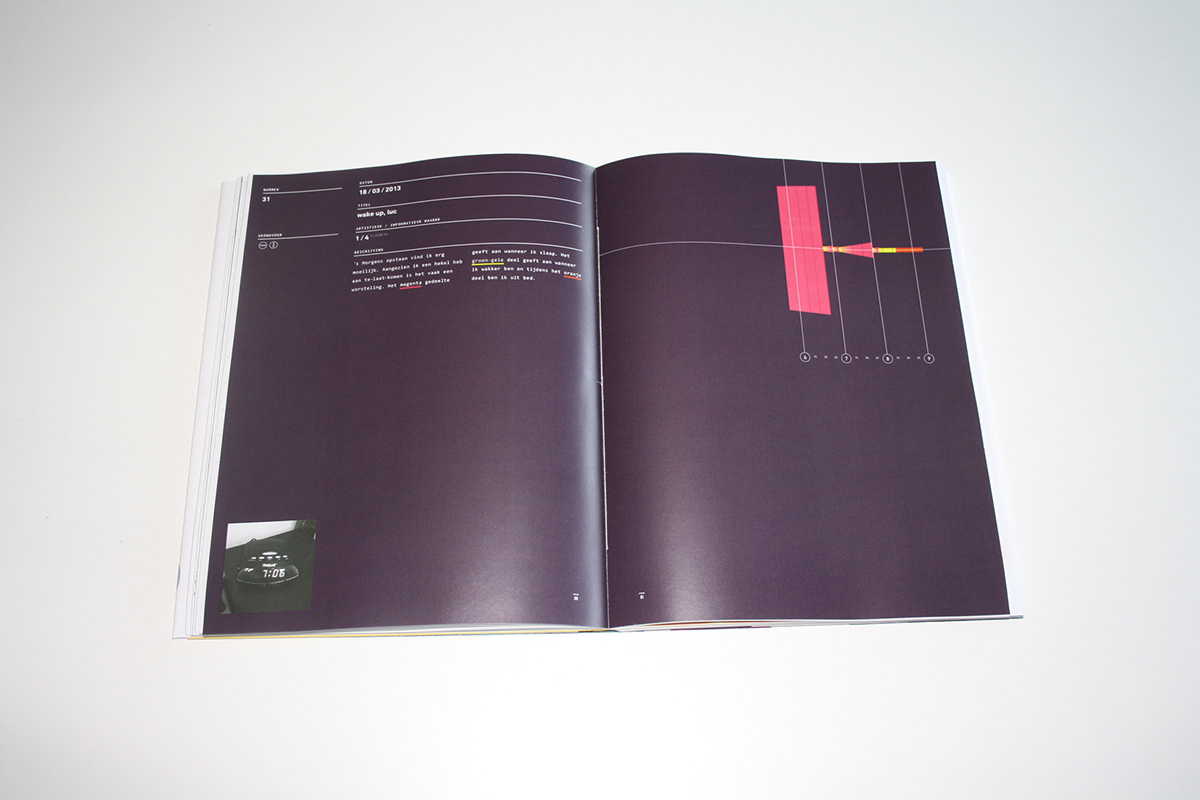
day 31: wake up, luc
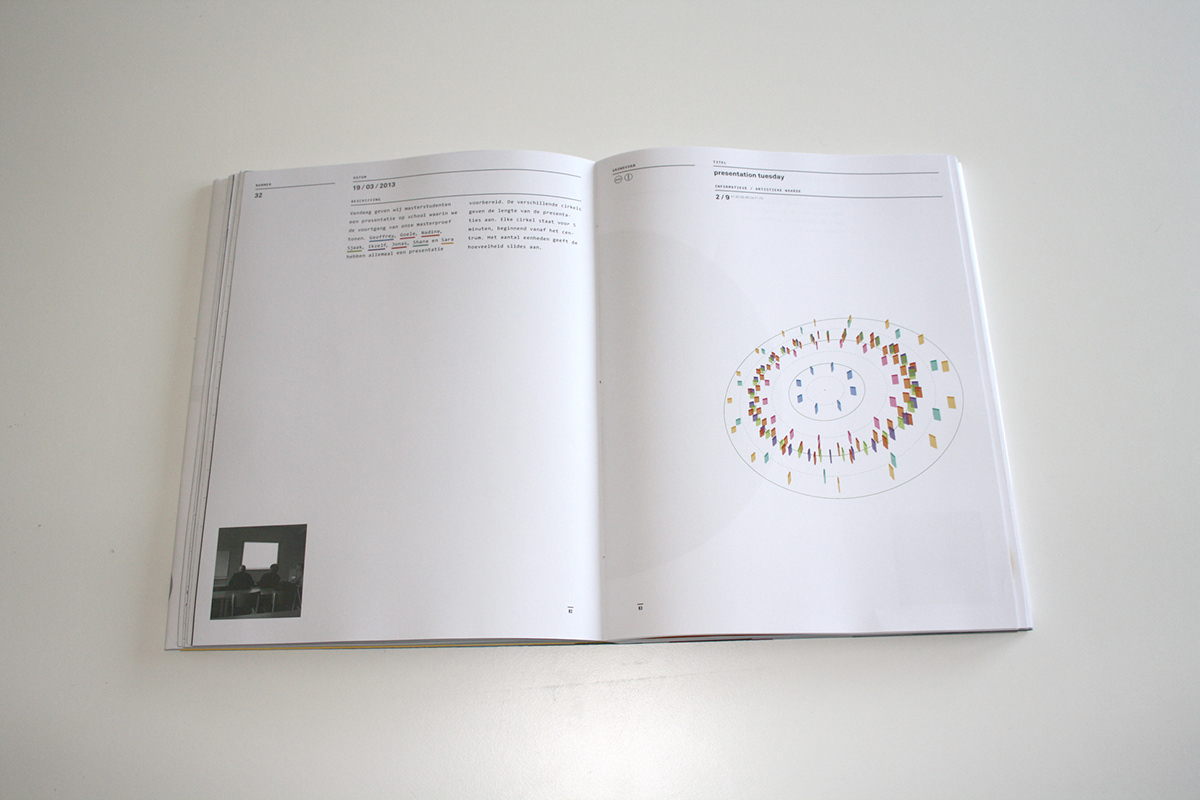
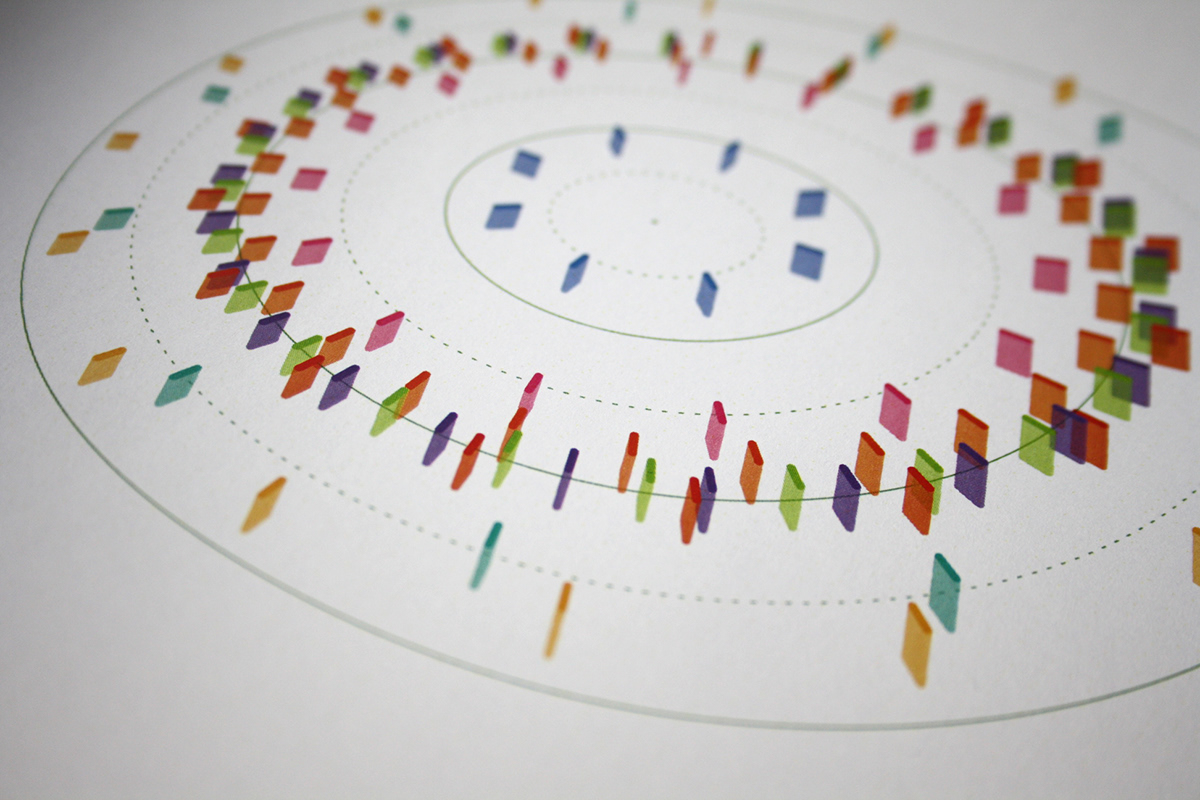
day 32: presentation tuesday
day 32: presentation tuesday (detail)
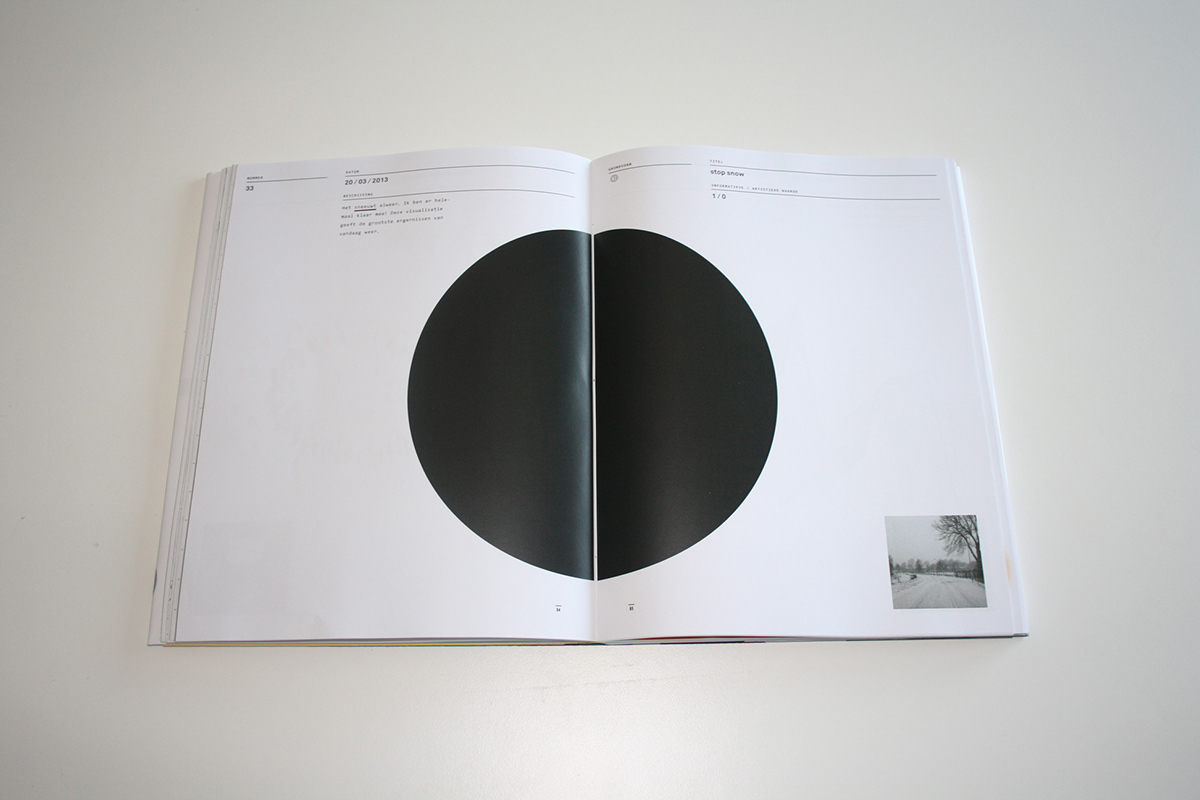
day 33: stop snow
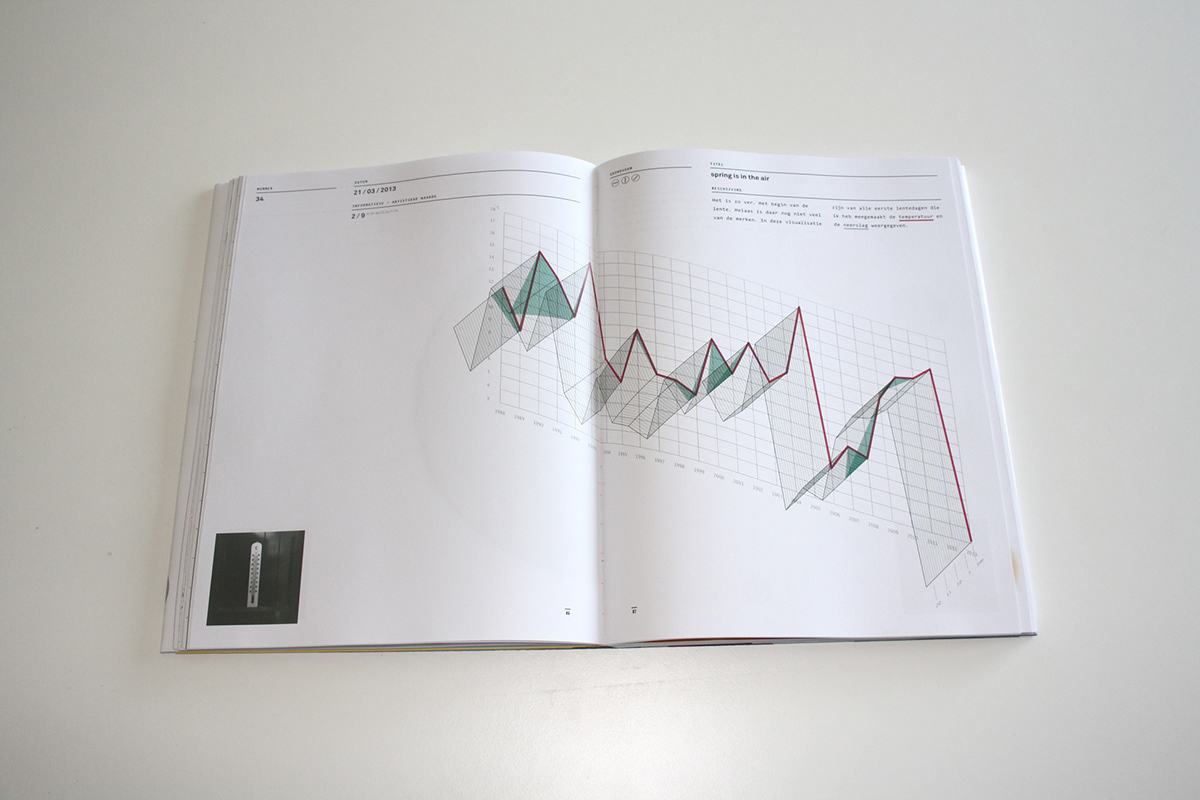
day 34: spring is in the air
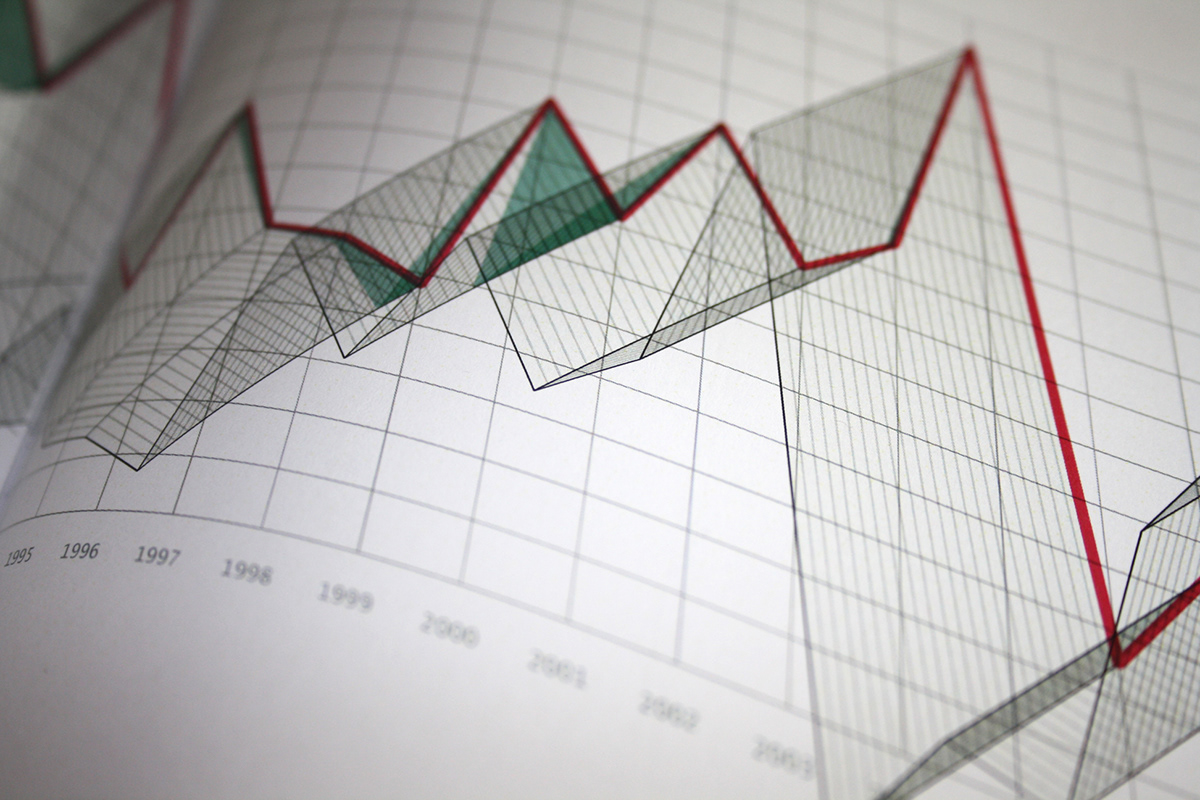
day 34: spring is in the air (detail)
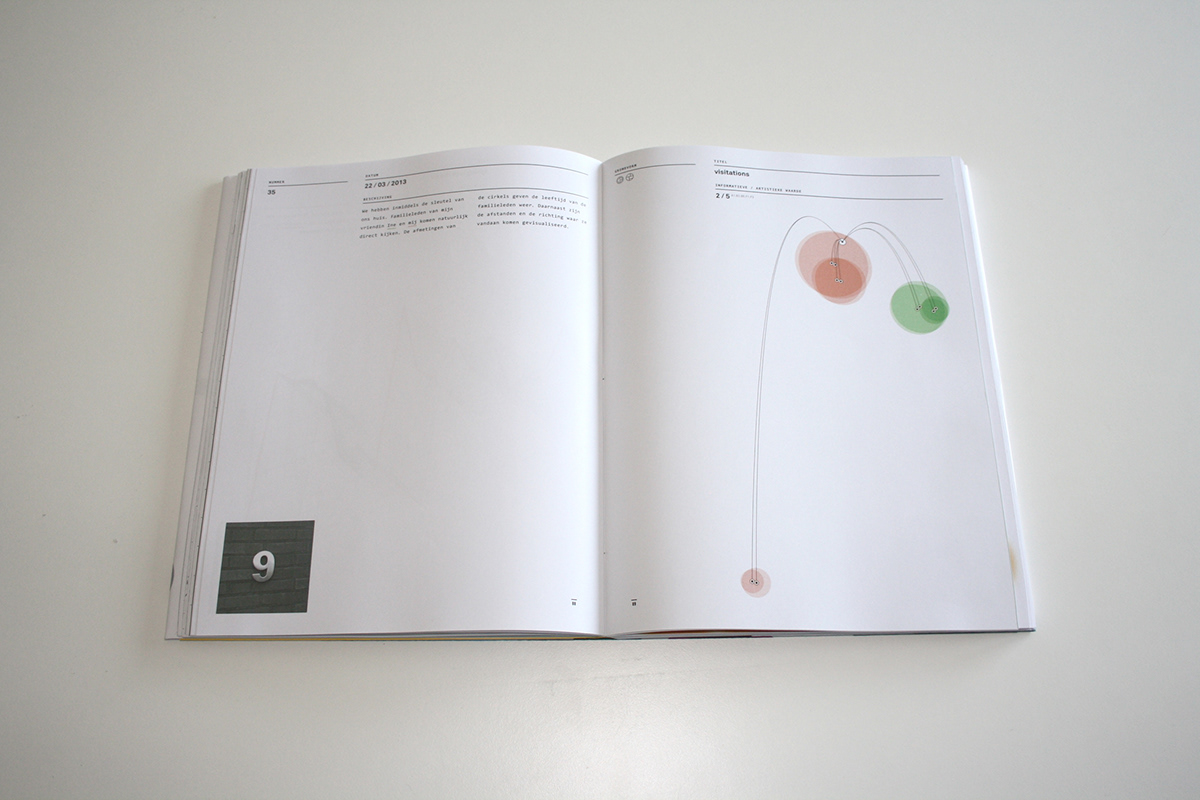
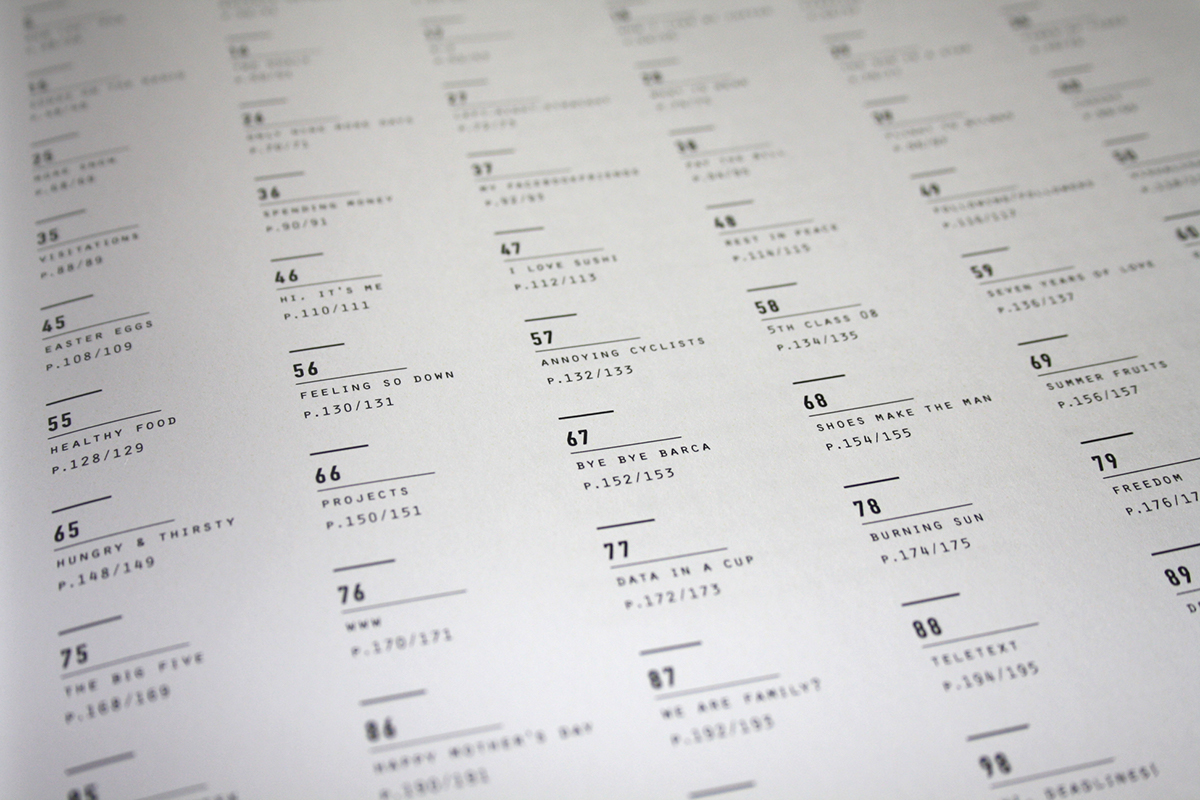
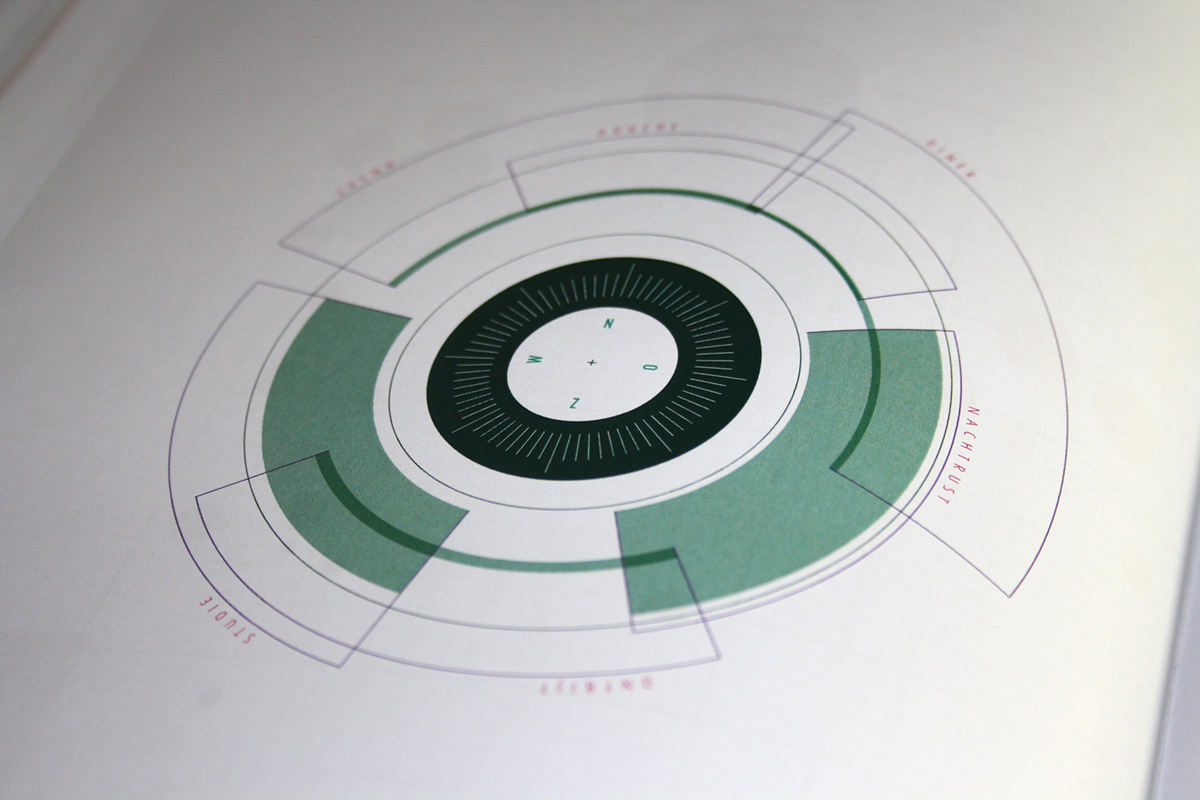
day 35: visitations
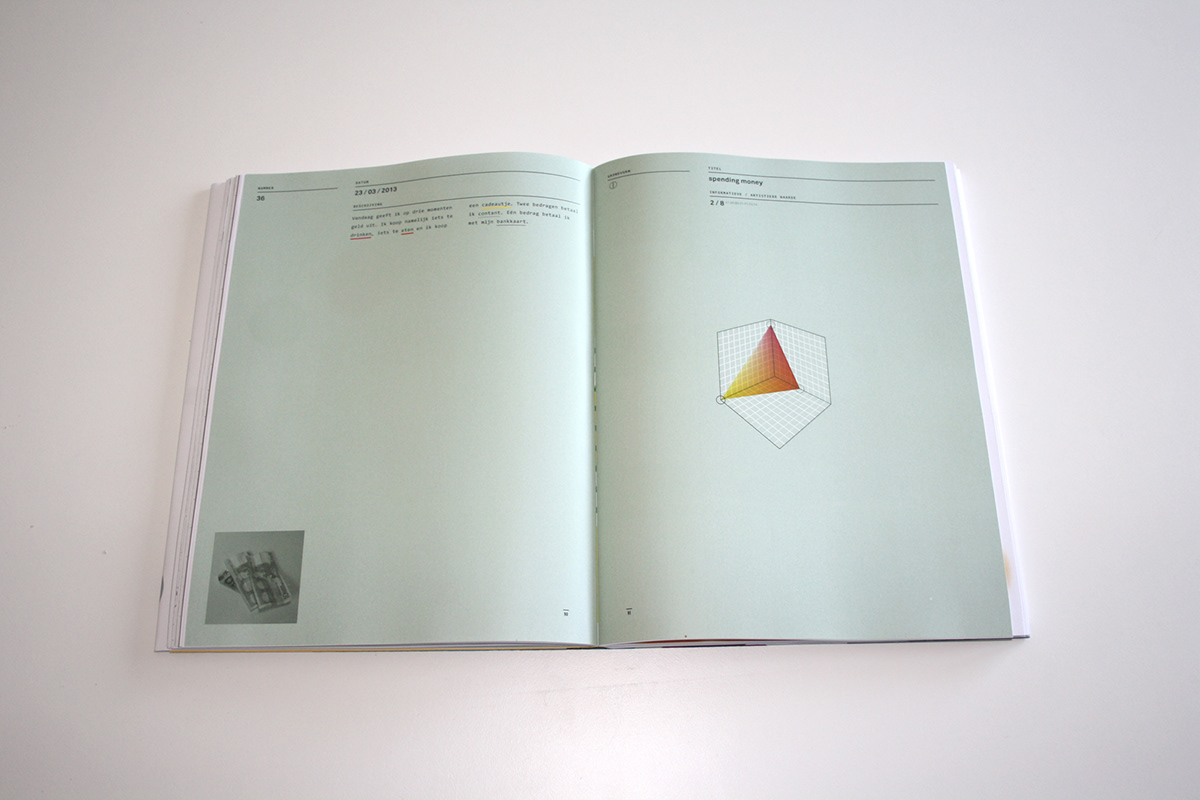
day 36: spending money
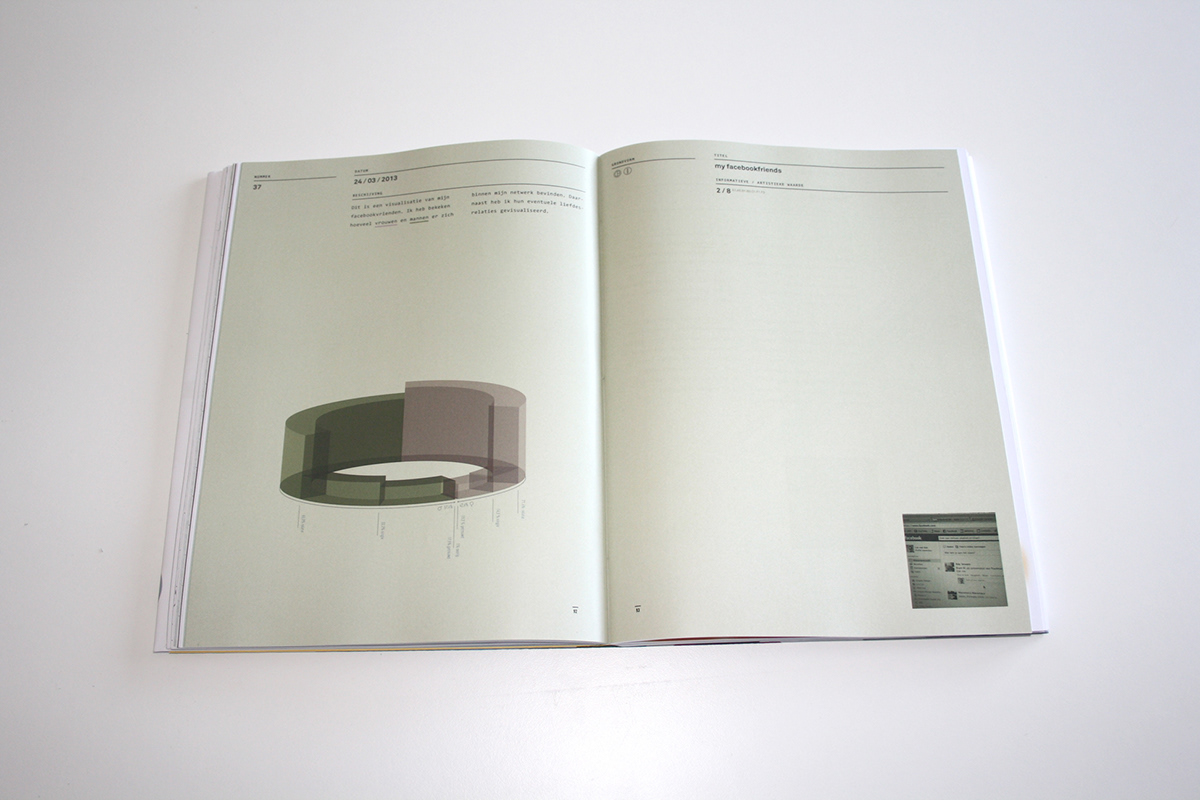
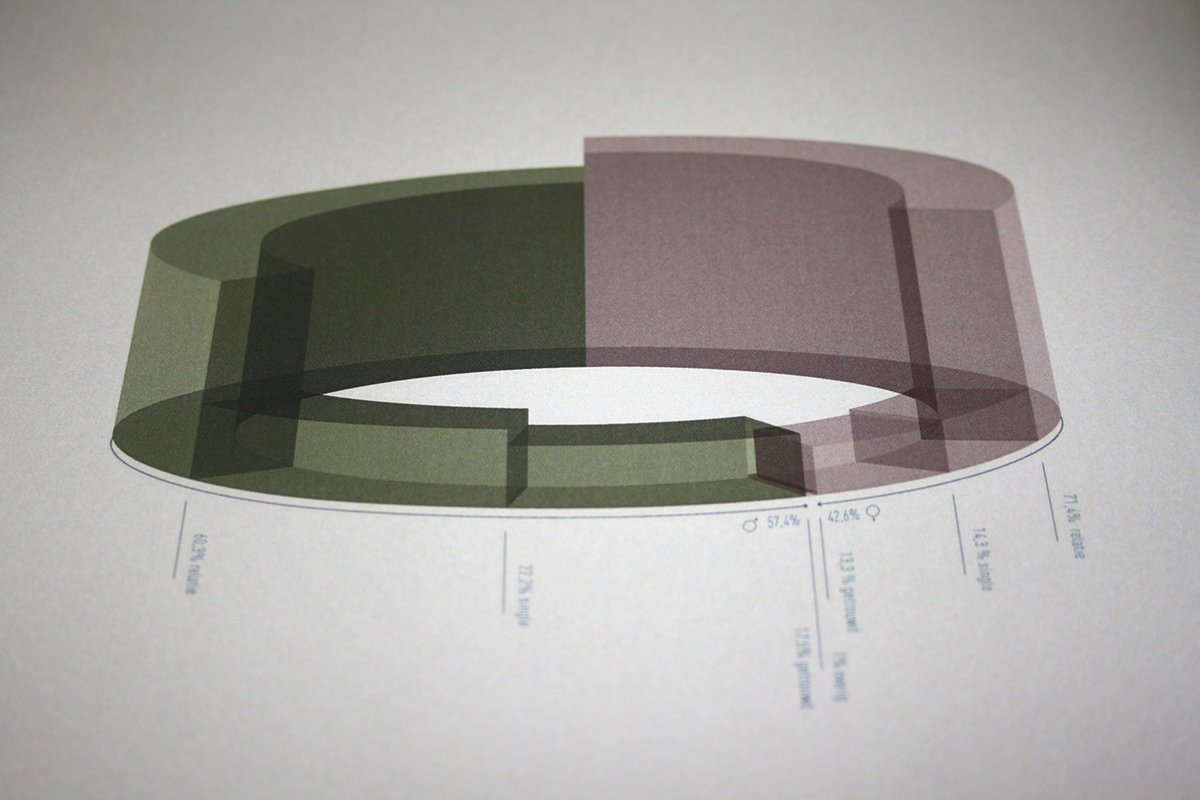
day 37: my facebookfriends
day 37: my facebookfriends (detail)
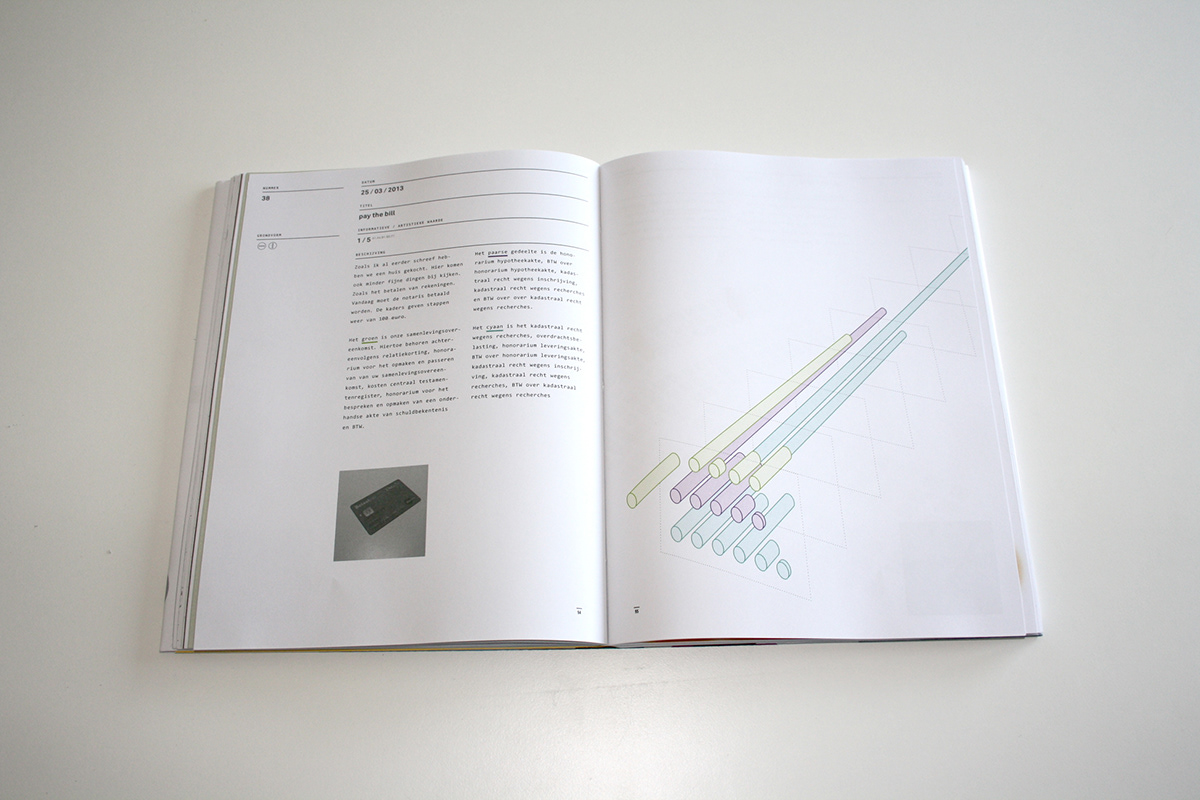
day 38: pay the bill
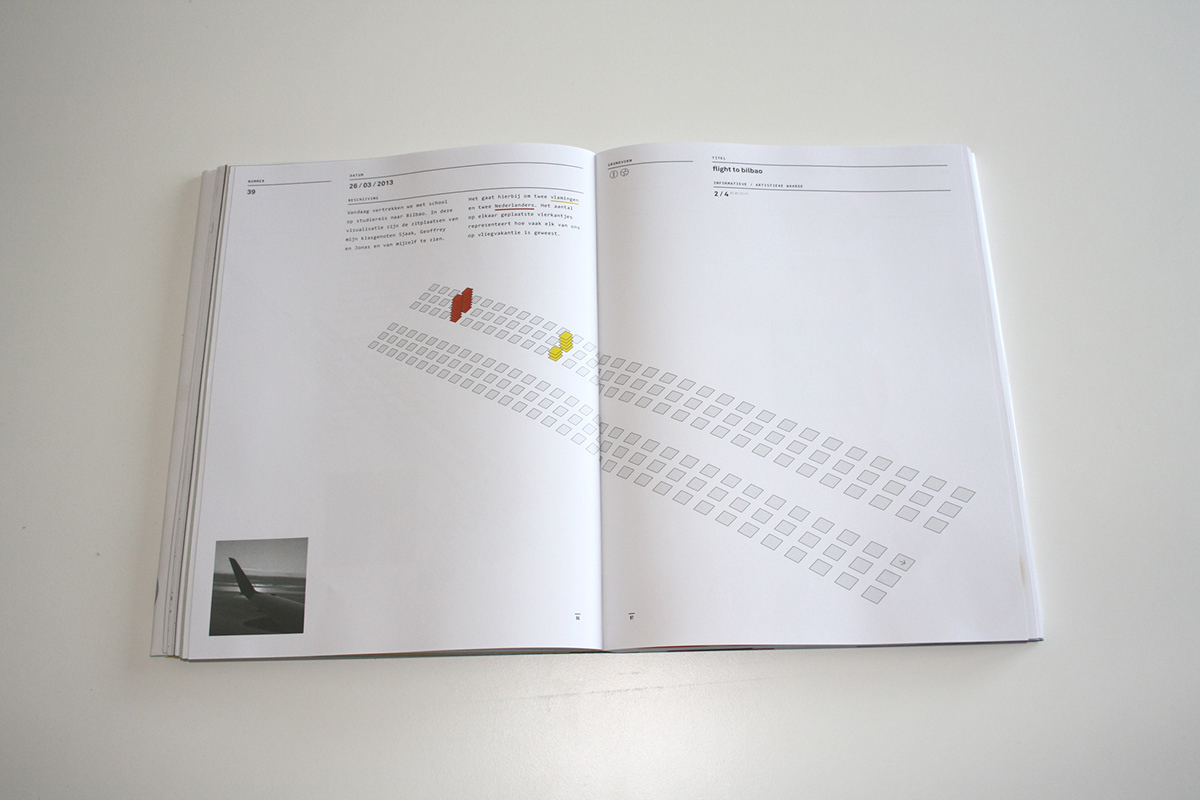
day 39: flight to Bilbao
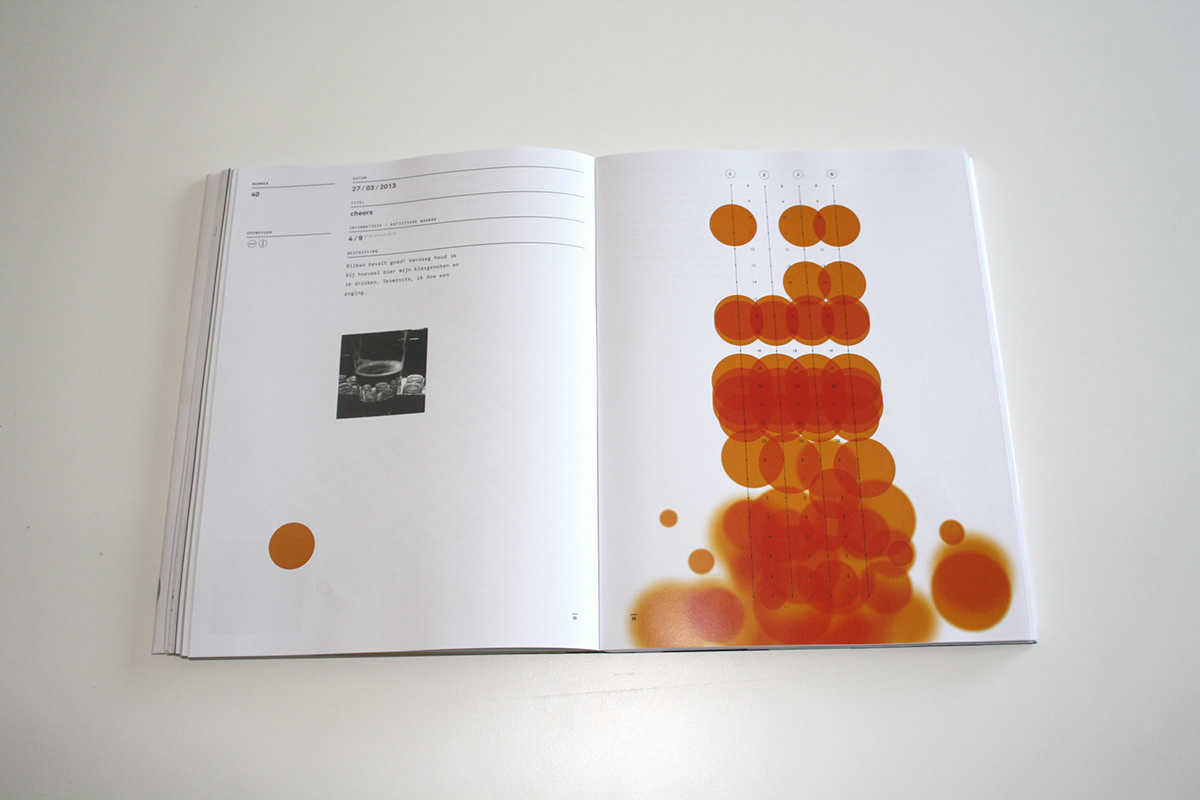
day 40: cheers
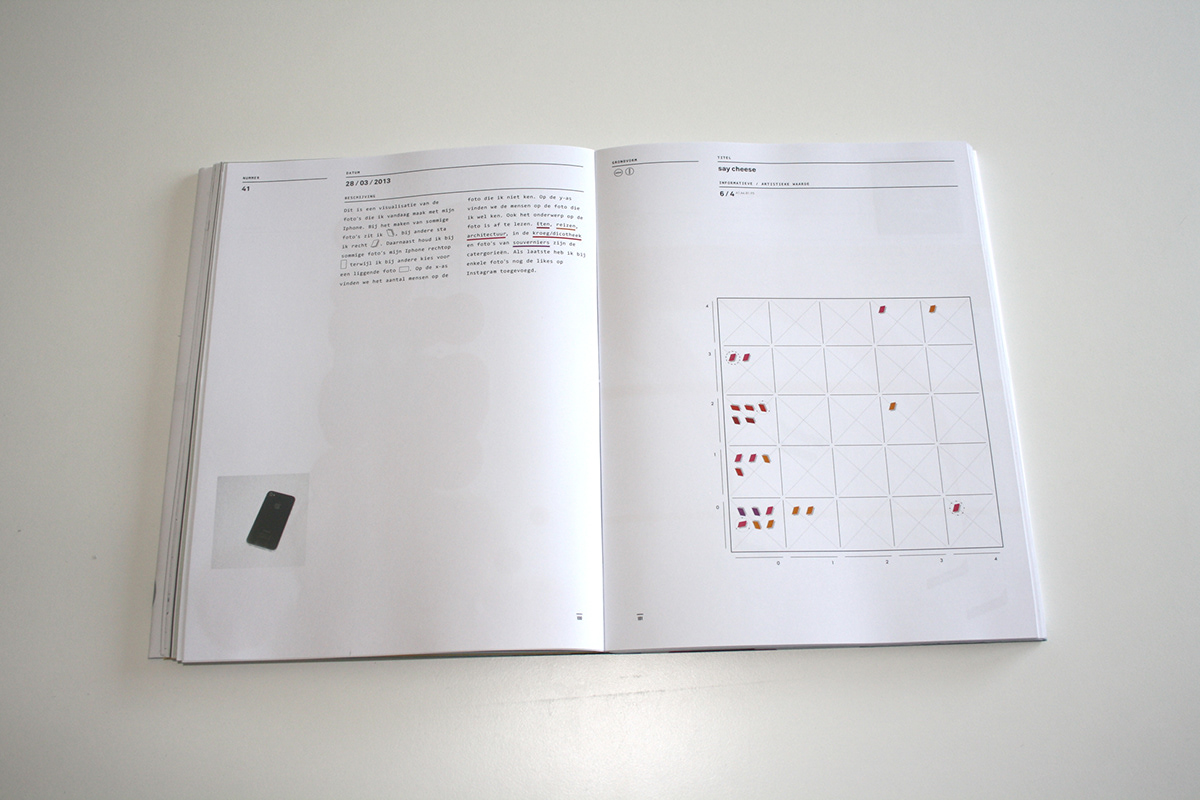
day 41: say cheese
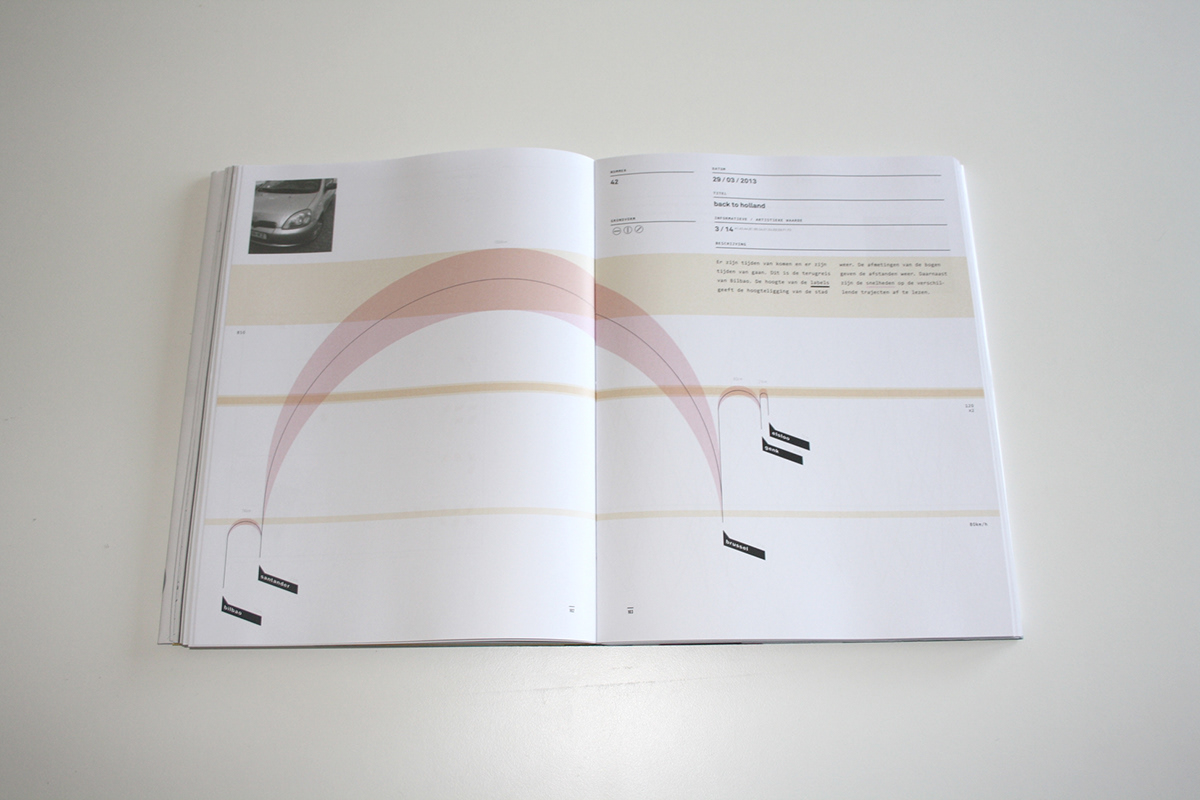
day 42: back to Holland
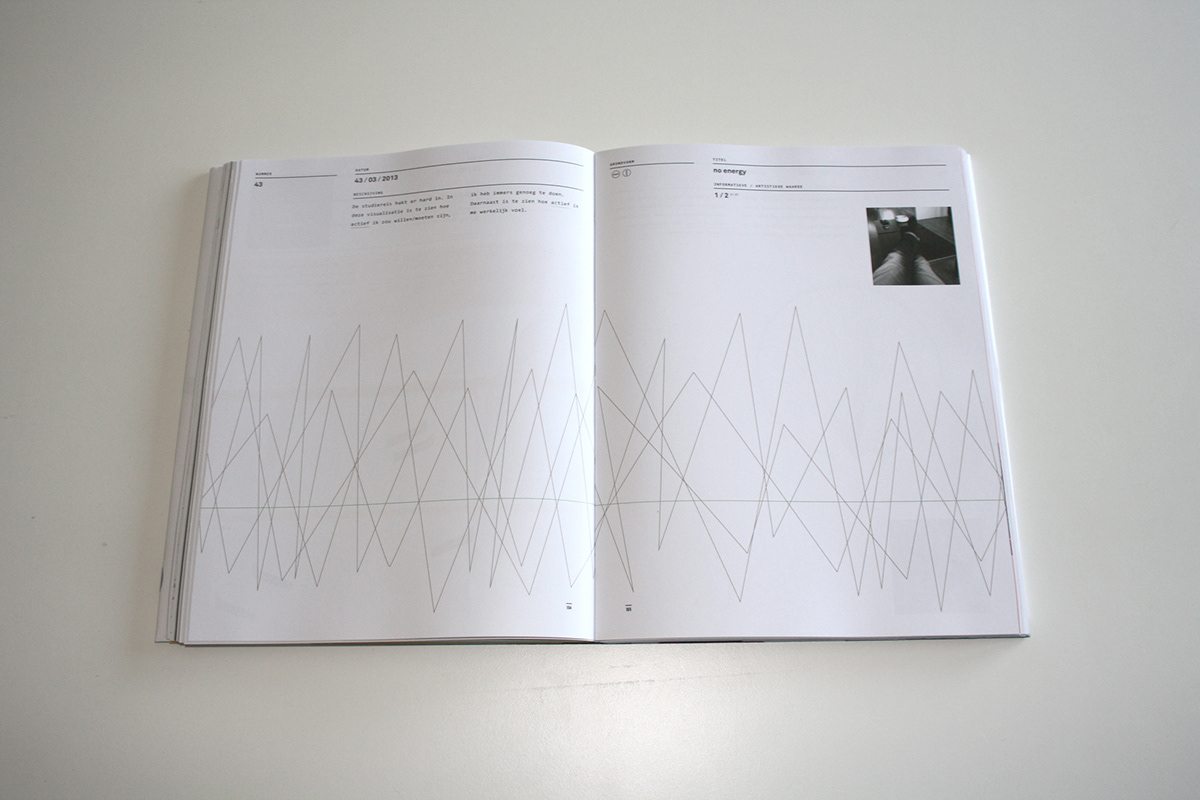
day 43: no energy
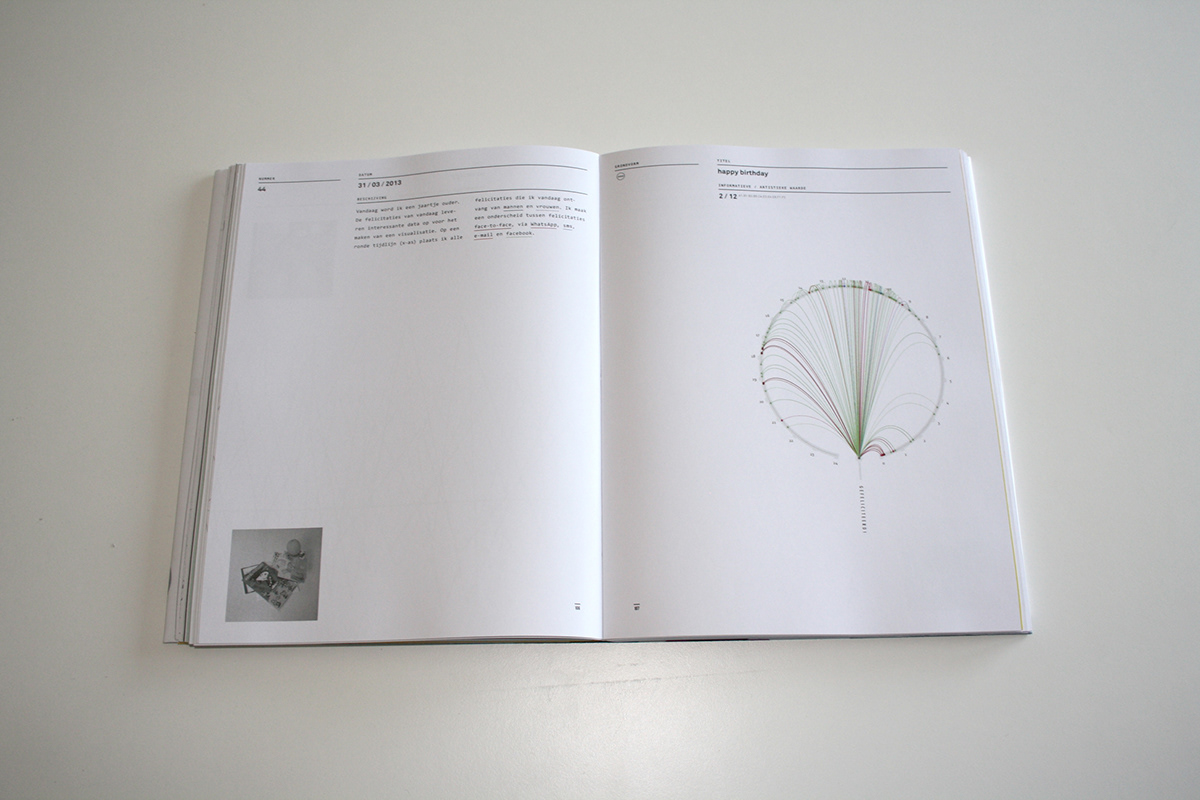
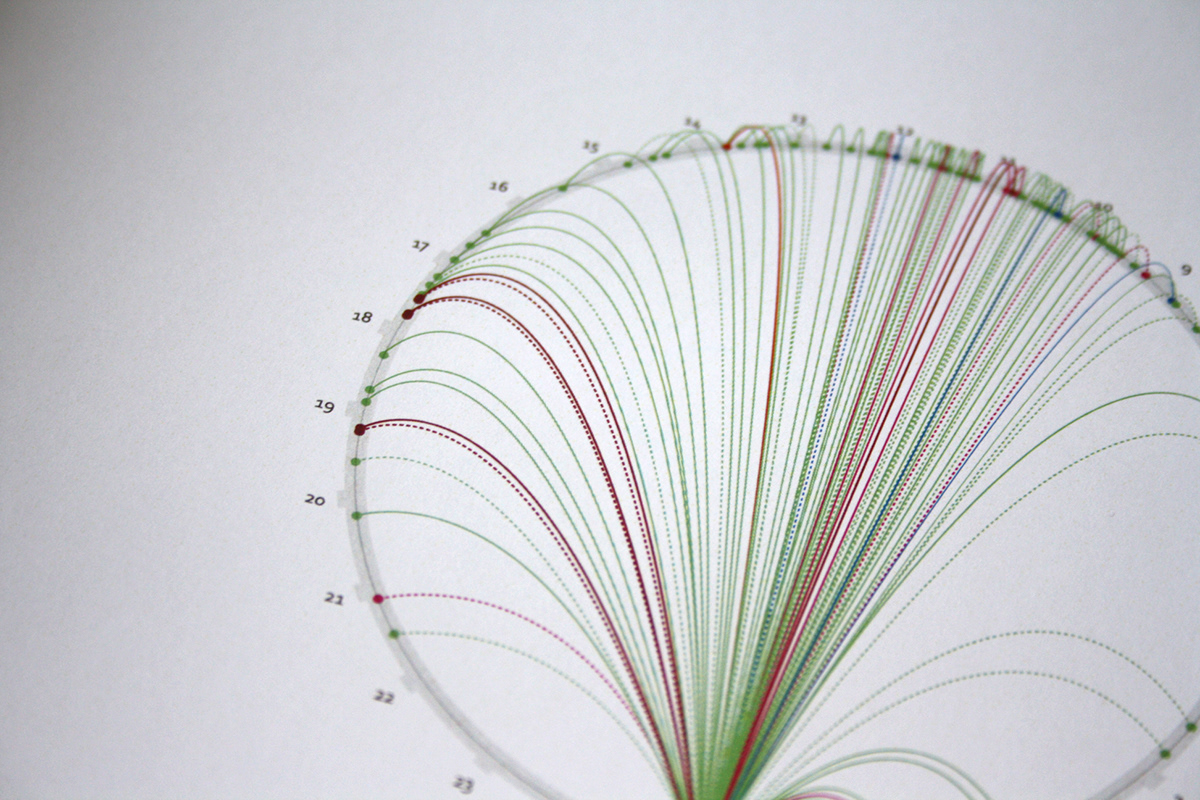
day 44: happy birthday
day 44: happy birthday (datail)
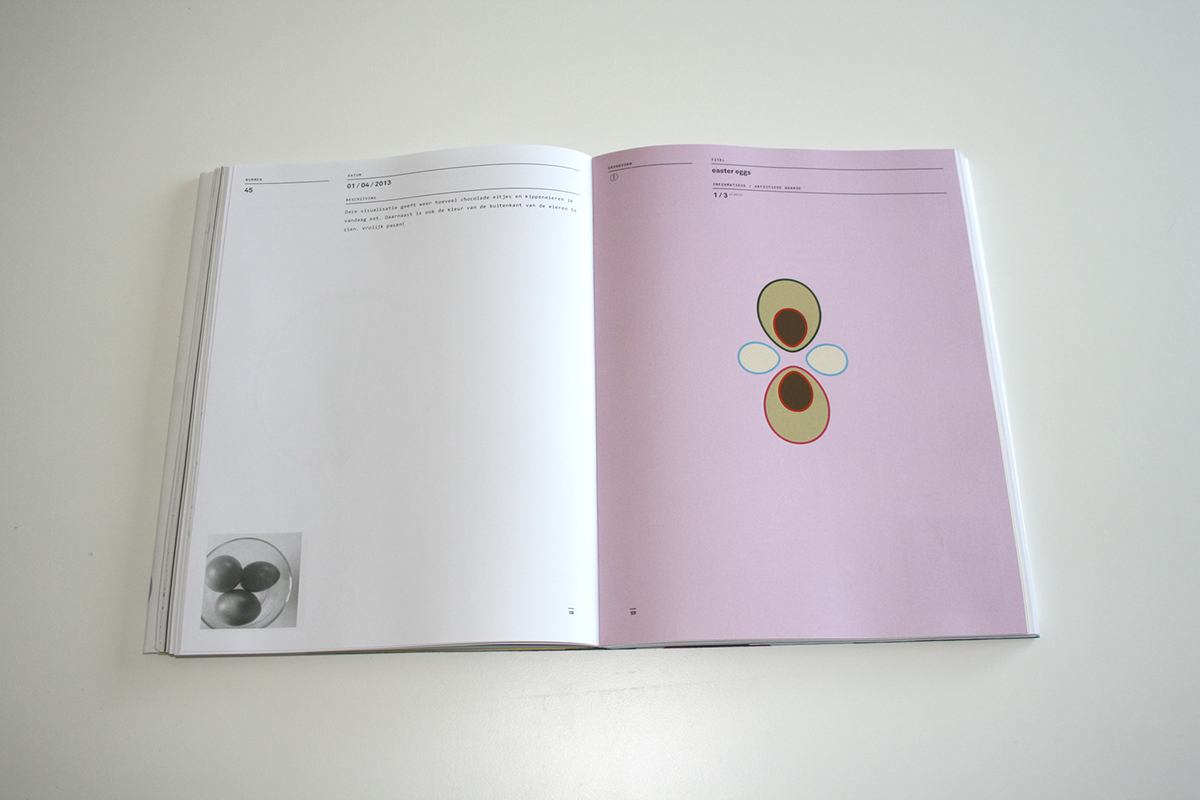
day 45: easter eggs
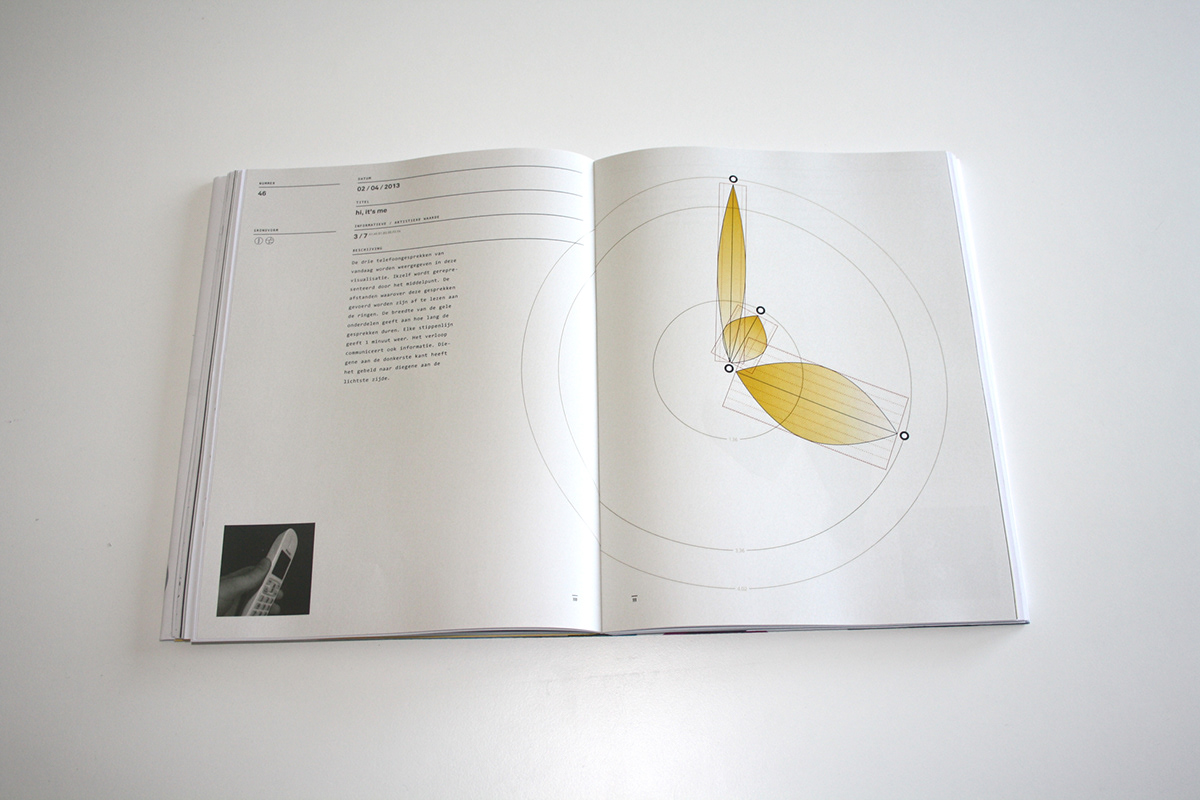
day 46: hi, it's me
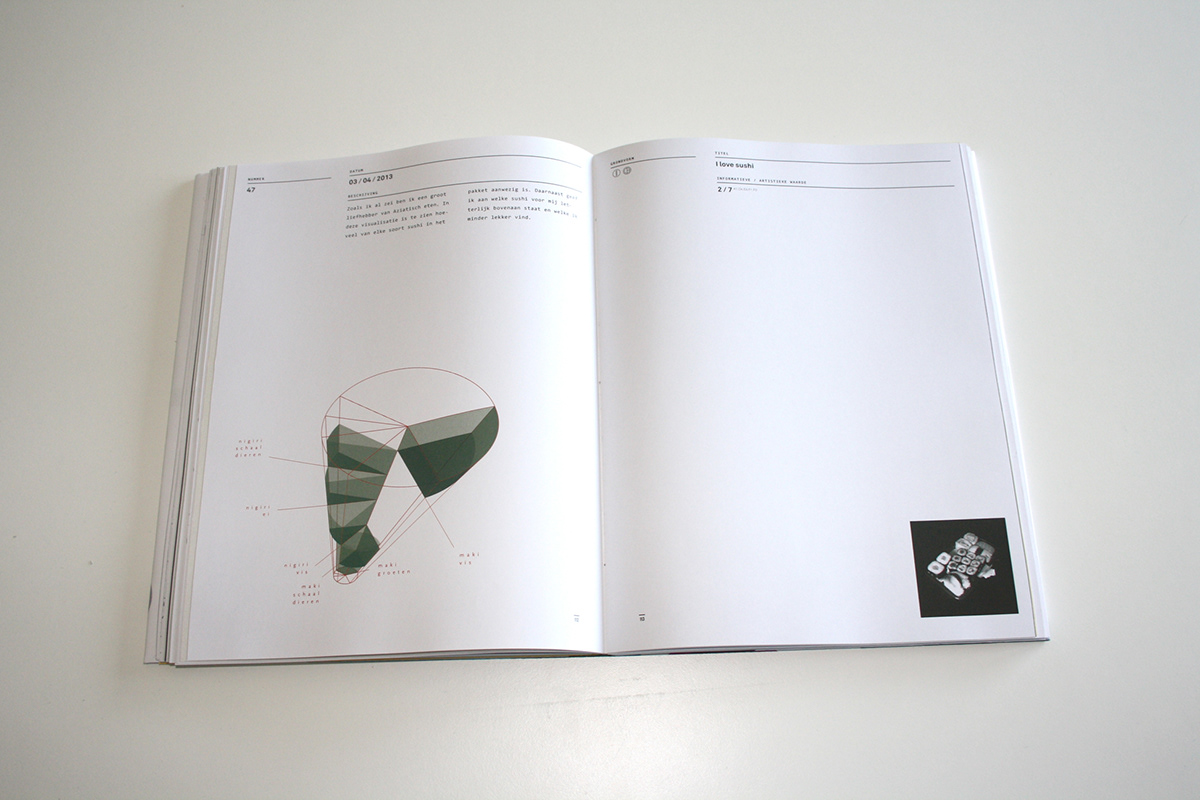
day 47: I love sushi
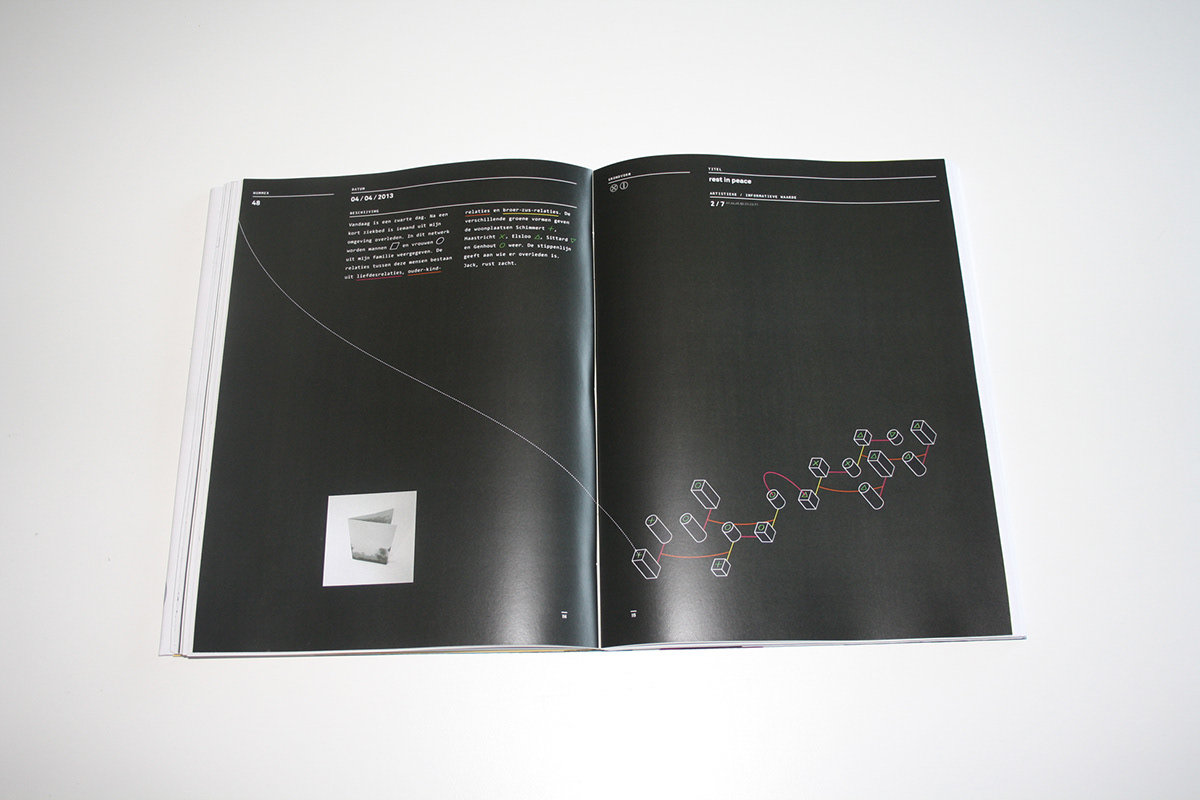
day 48: rest in peace
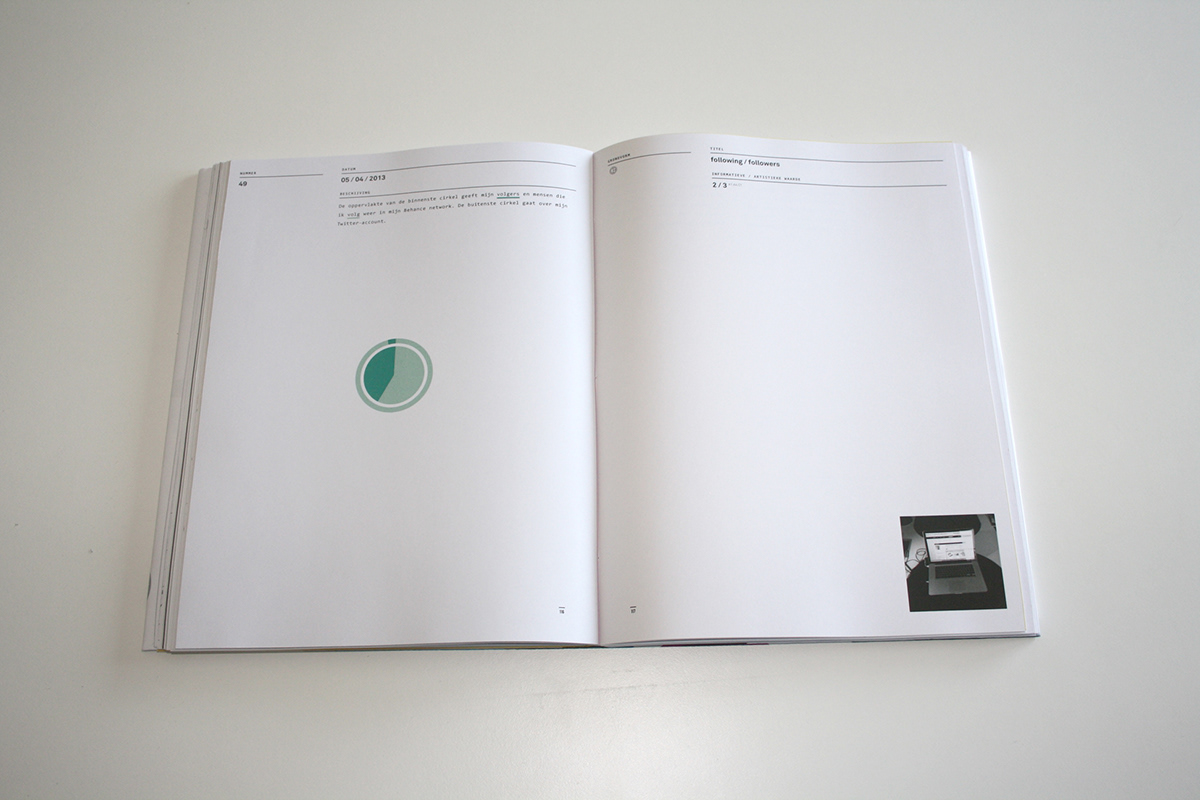
day 49: following/followers
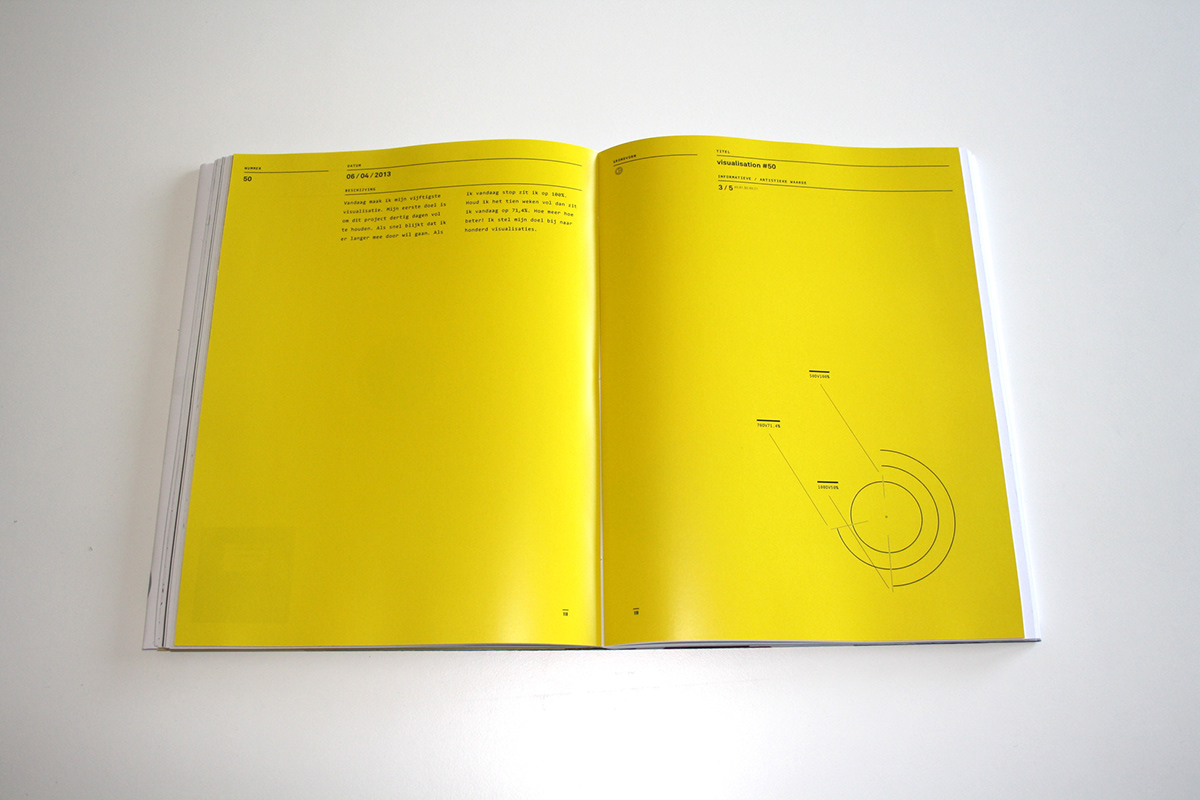
day 50: visualisation #50
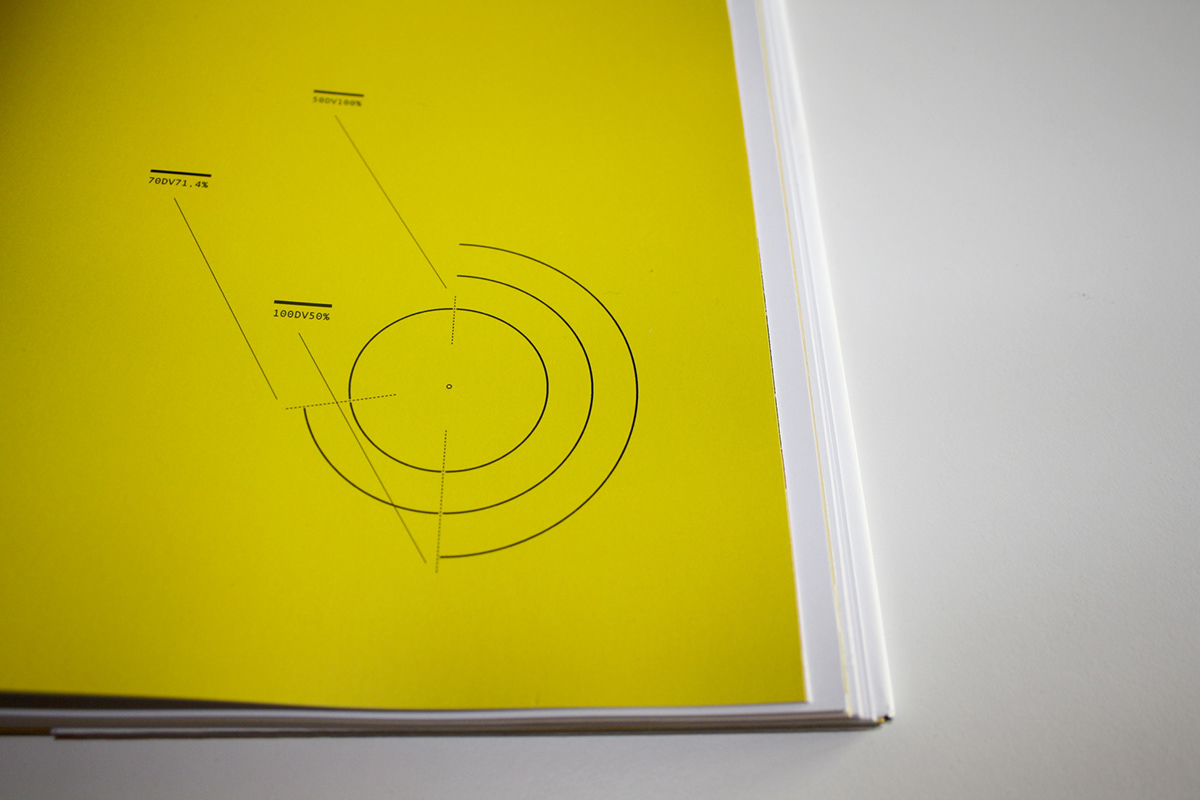
day 50: visualisation #50 (detail)
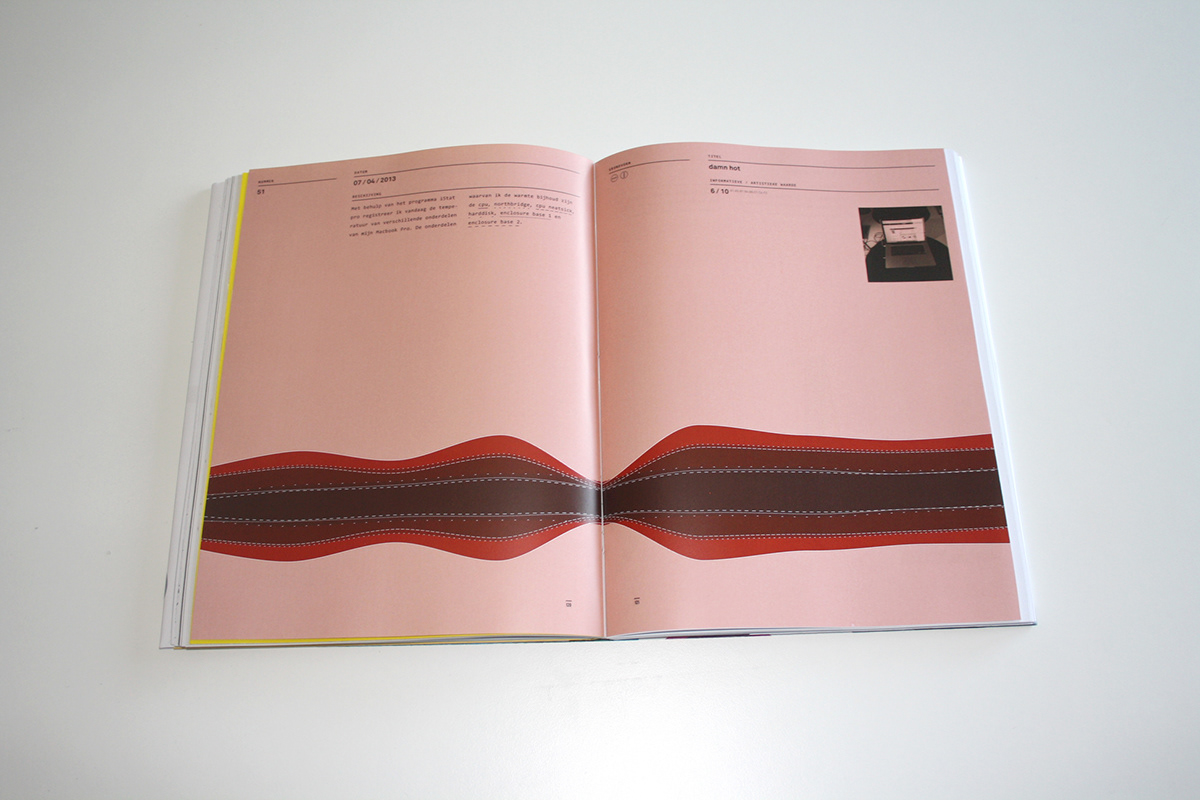
day 51: damn hot
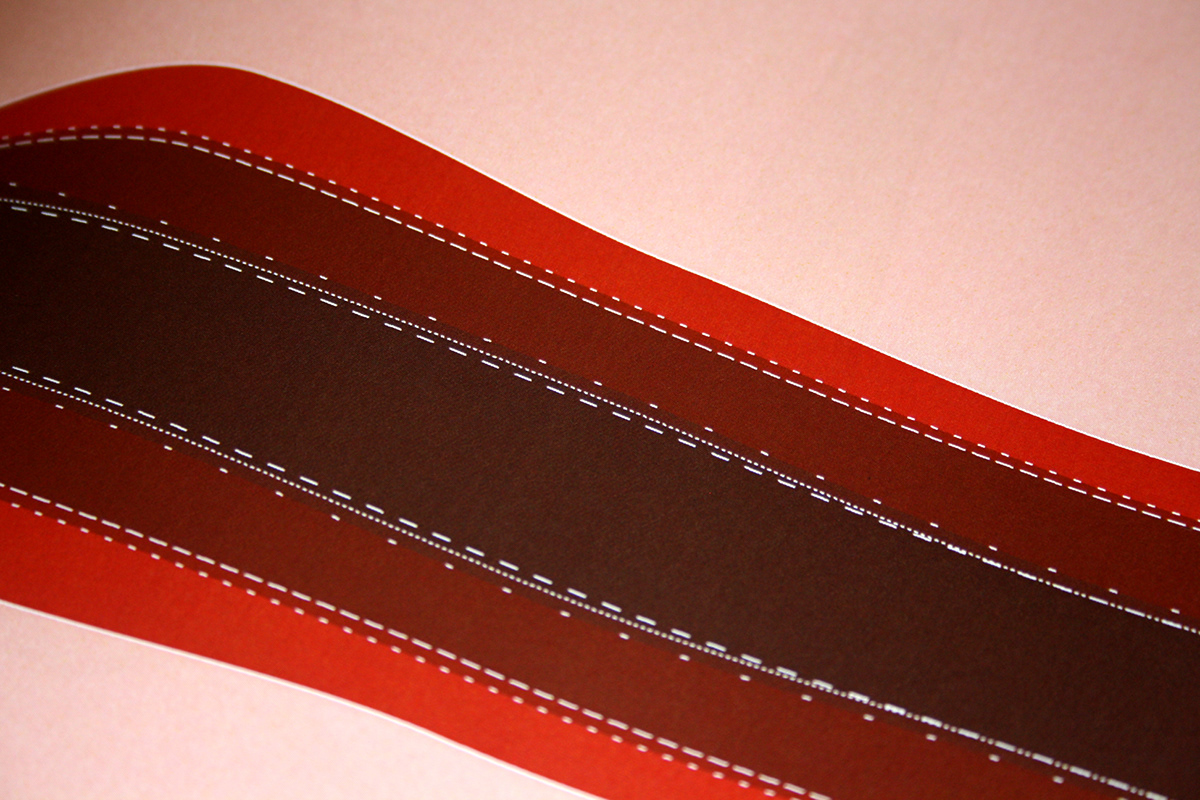
day 51: damn hot (detail)
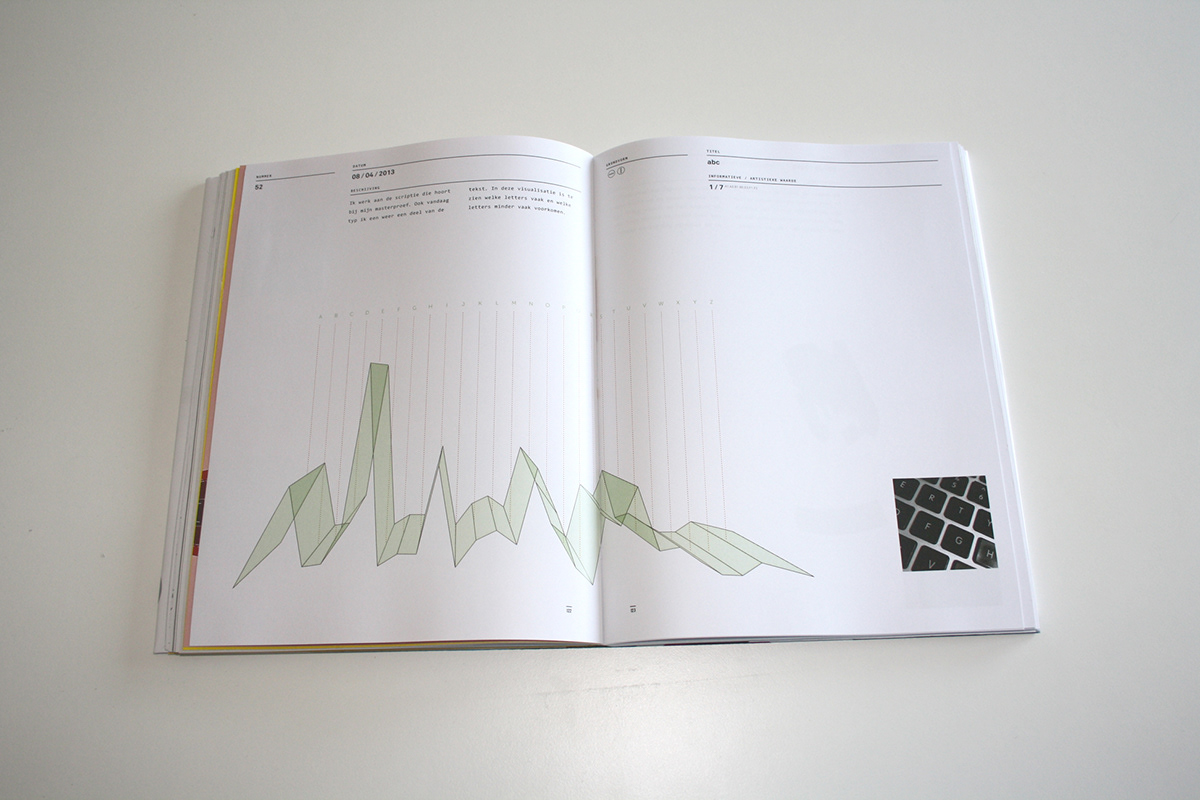
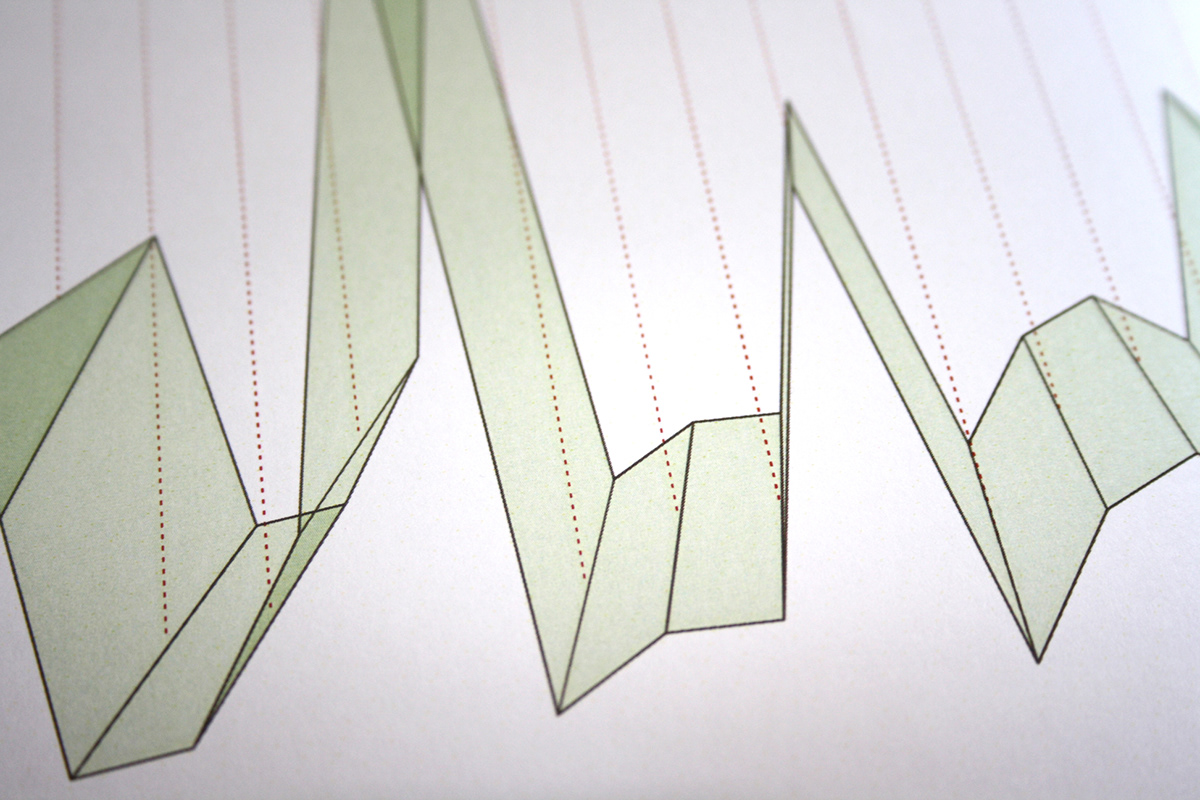
day 52: abc
day 52: abc (detail)
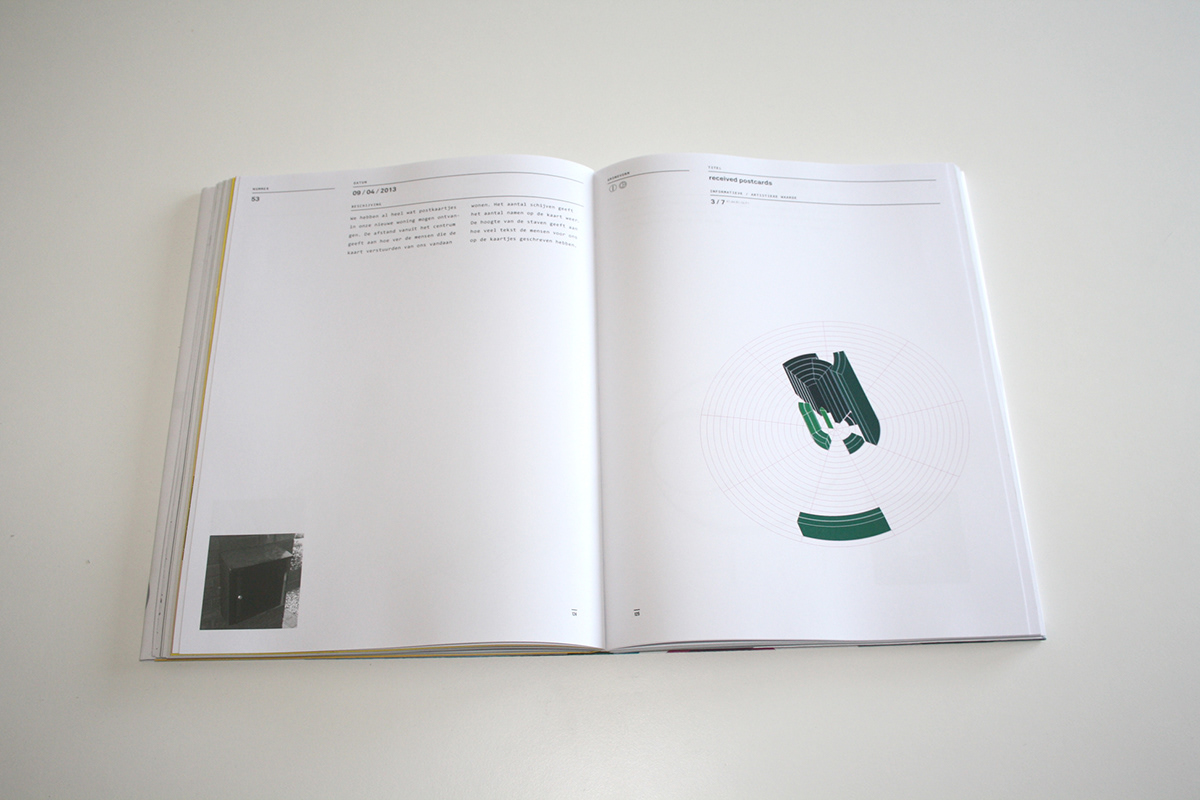
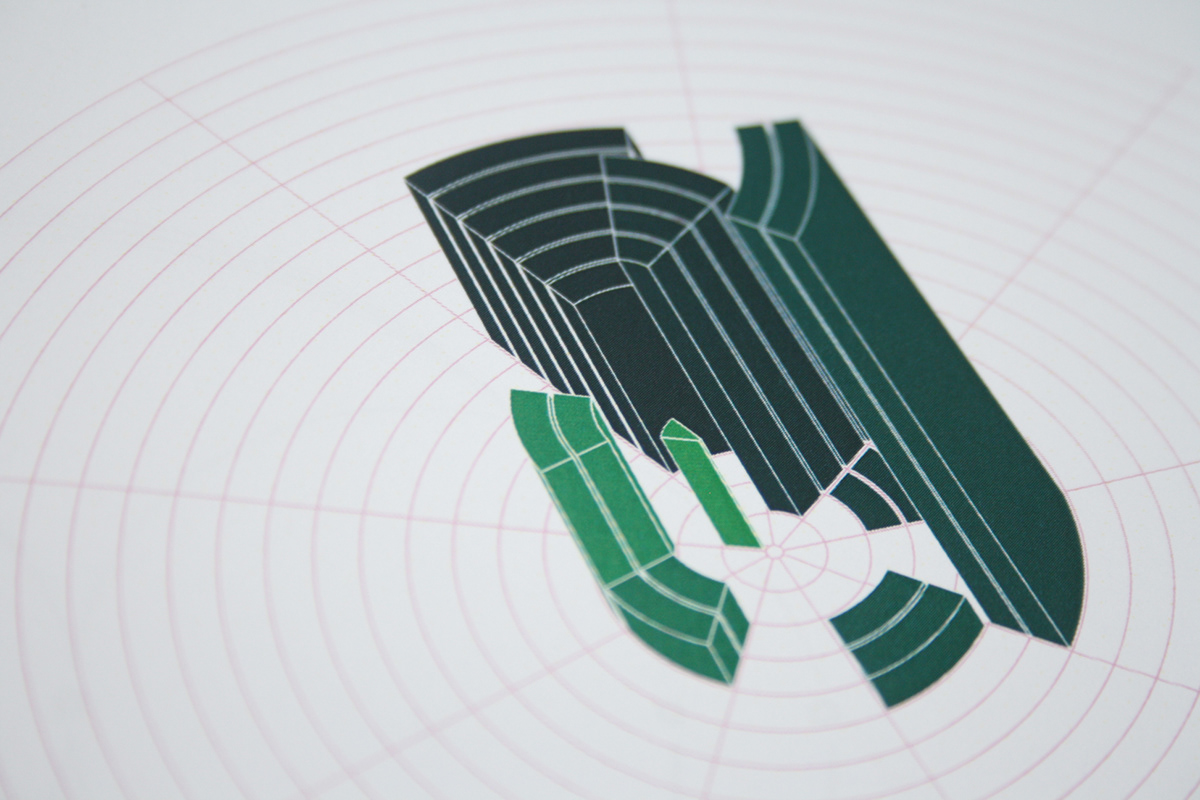
day 53: received postcards
day 53: received postcards (detail)
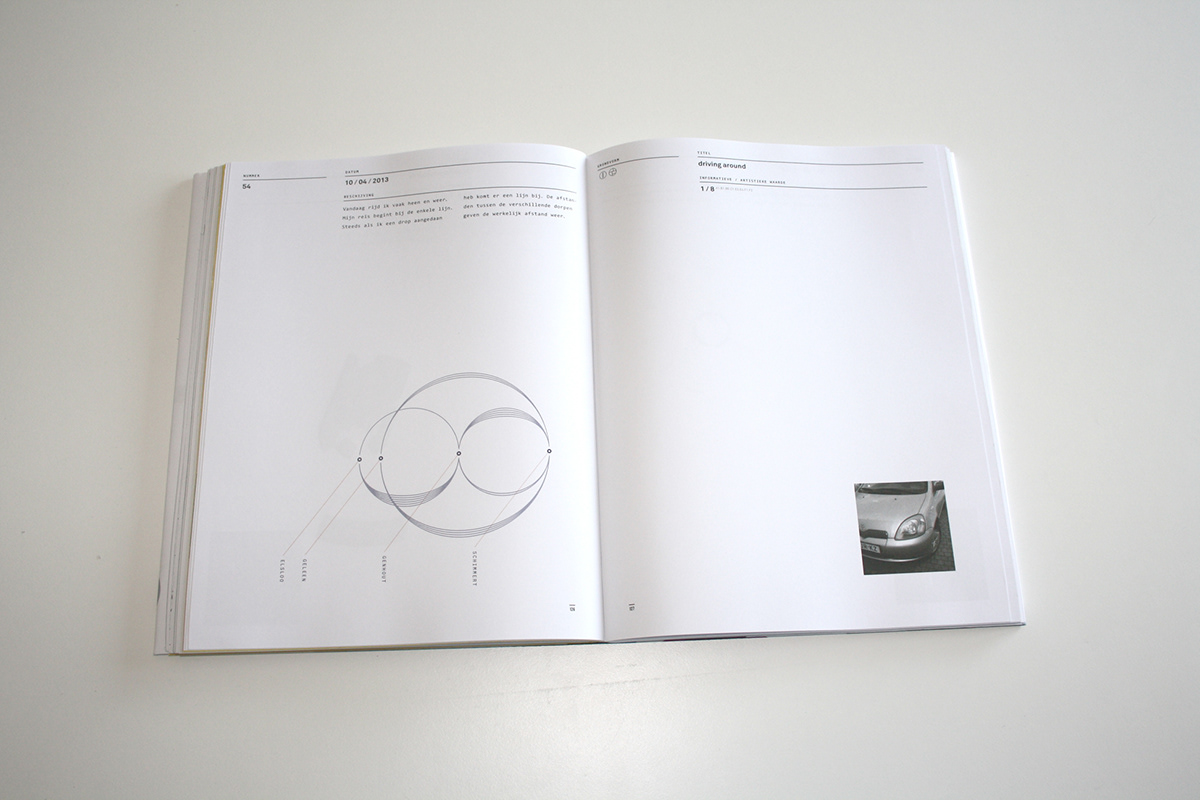
day 54: driving around
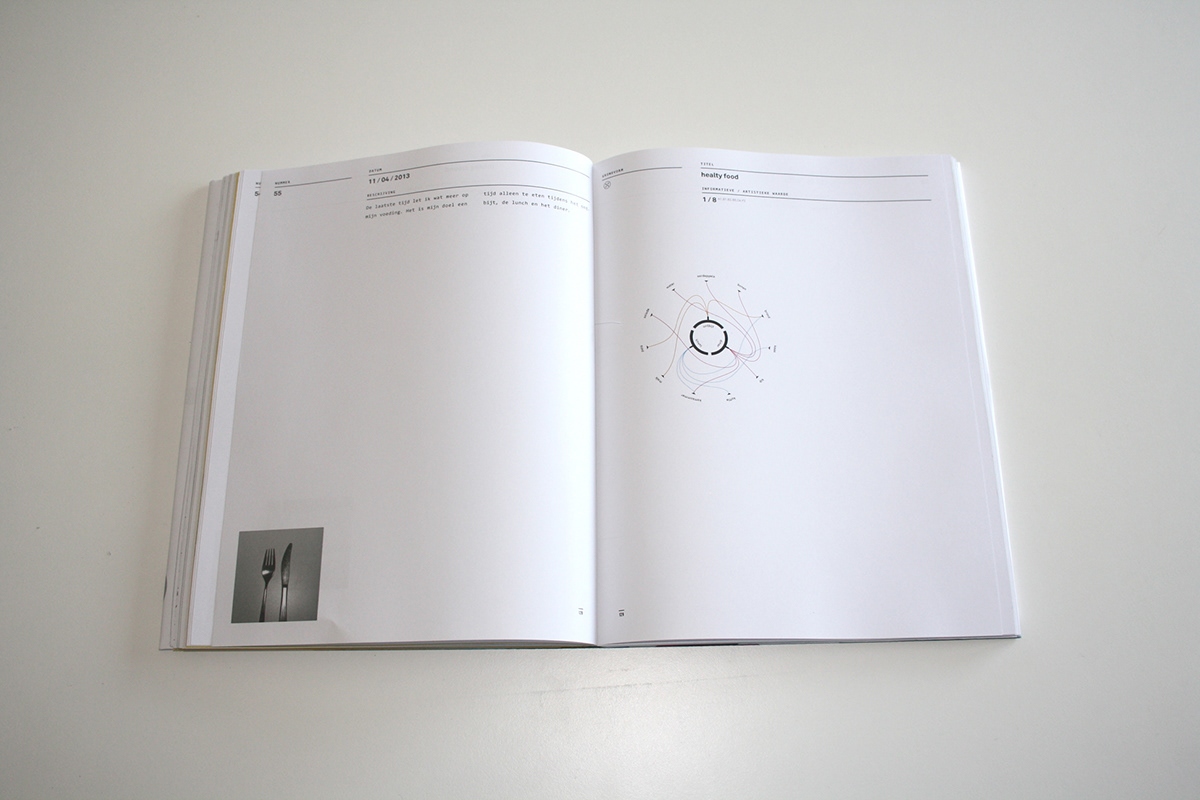
day 55: healty food
day 56: feeling so down
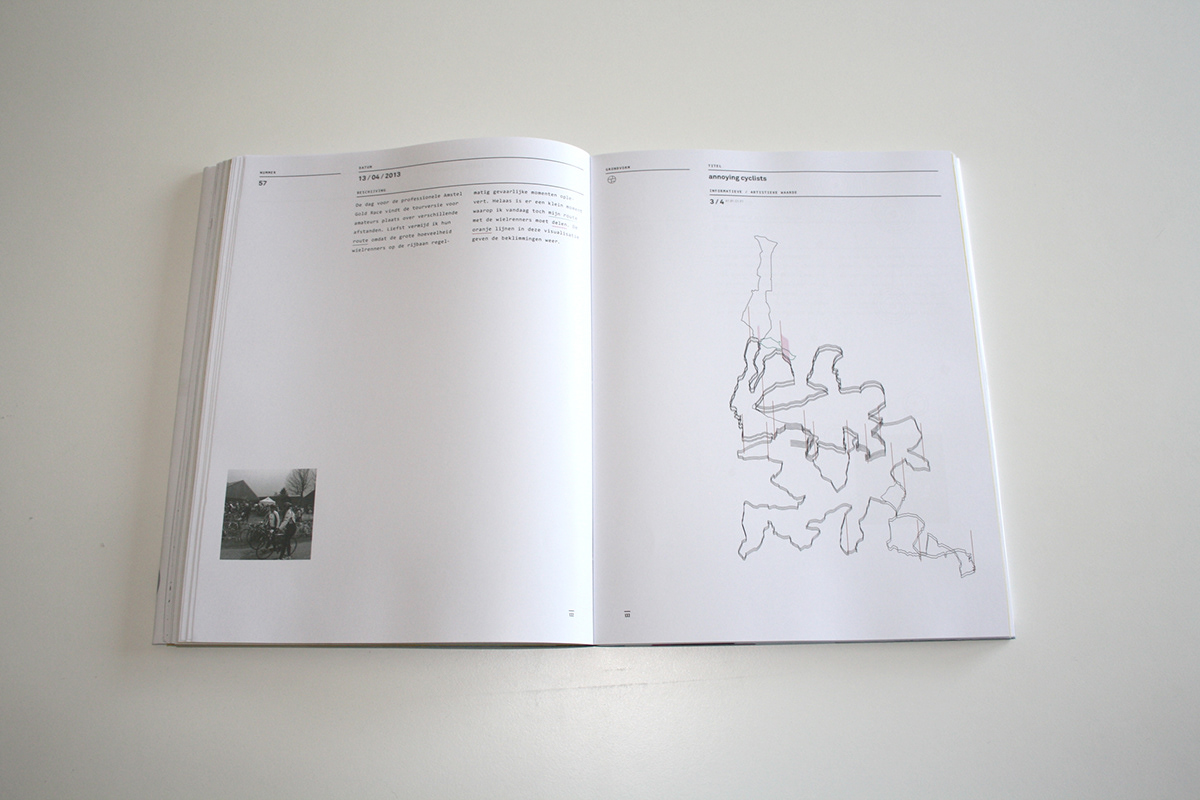
day 57: annoying cyclists
day 57: annoying cyclists (detail)
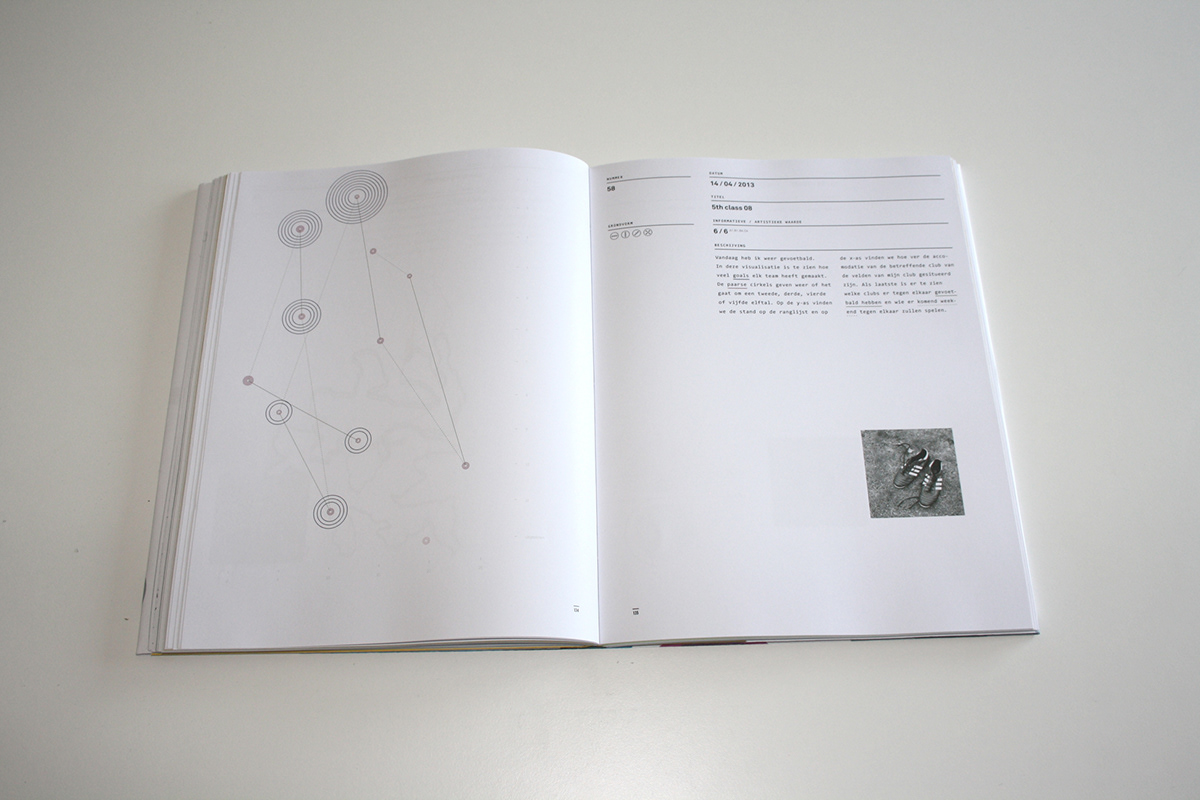
day 58: 5th class 08
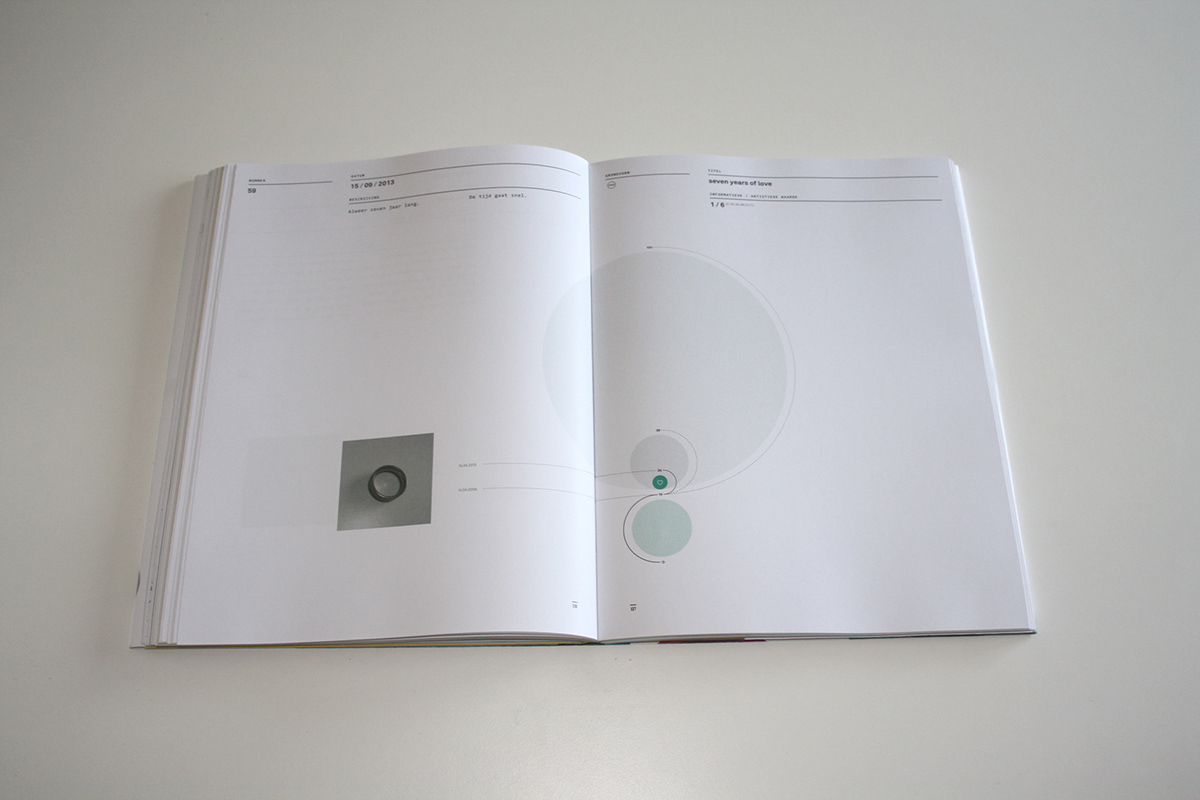
day 59: seven years of love
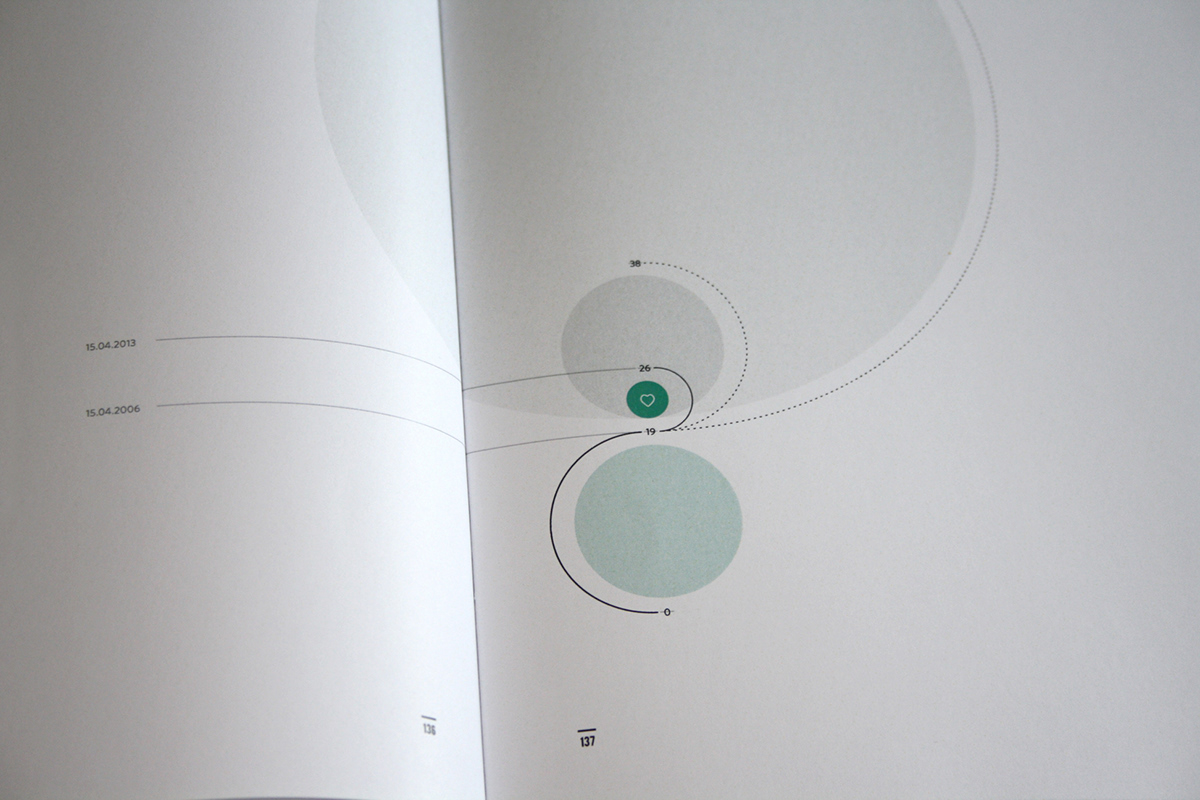
day 59: seven years of love (detail)

day 60: emoticons
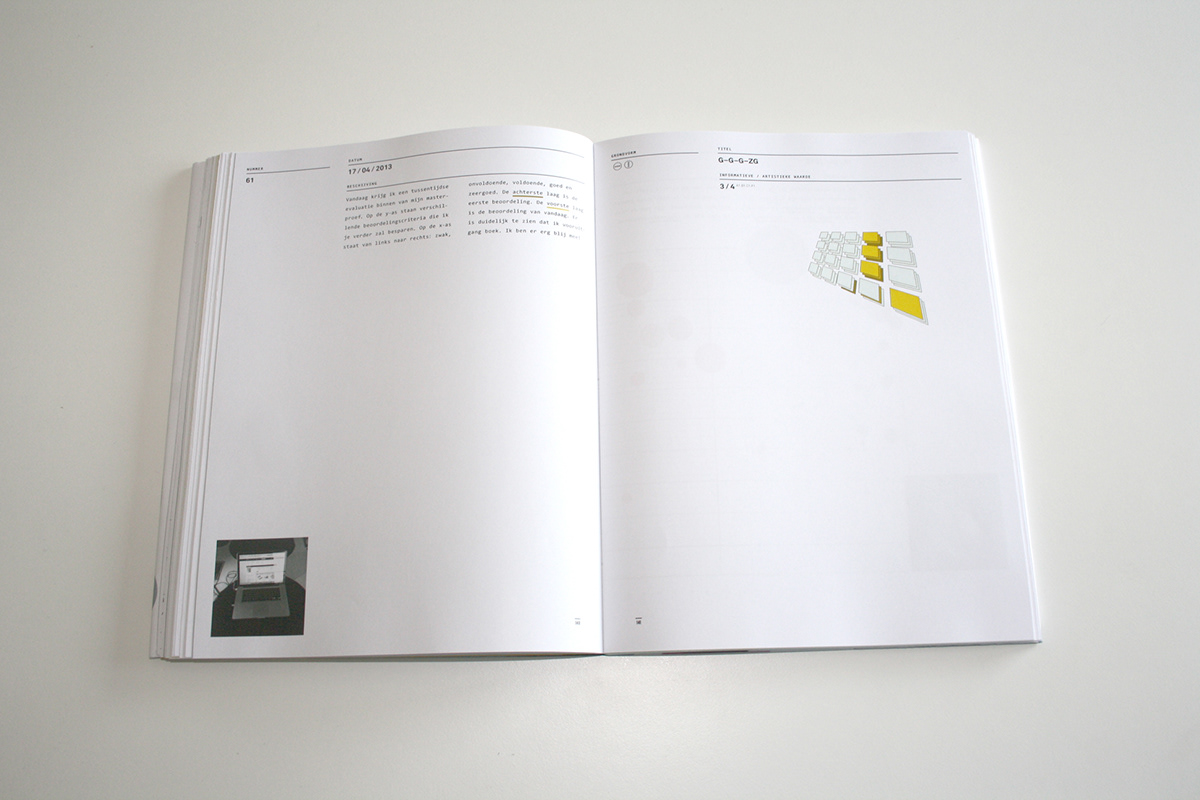
day 61: g-g-g-zg
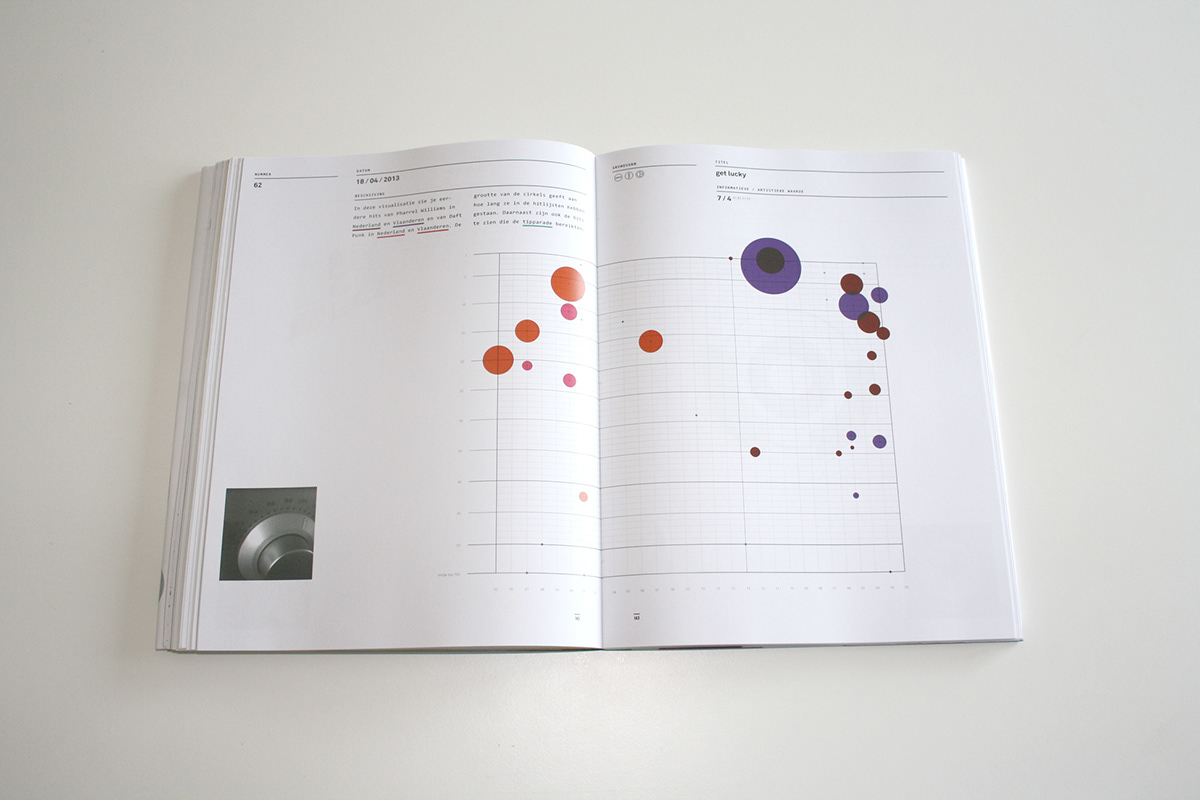
day 62: get lucky
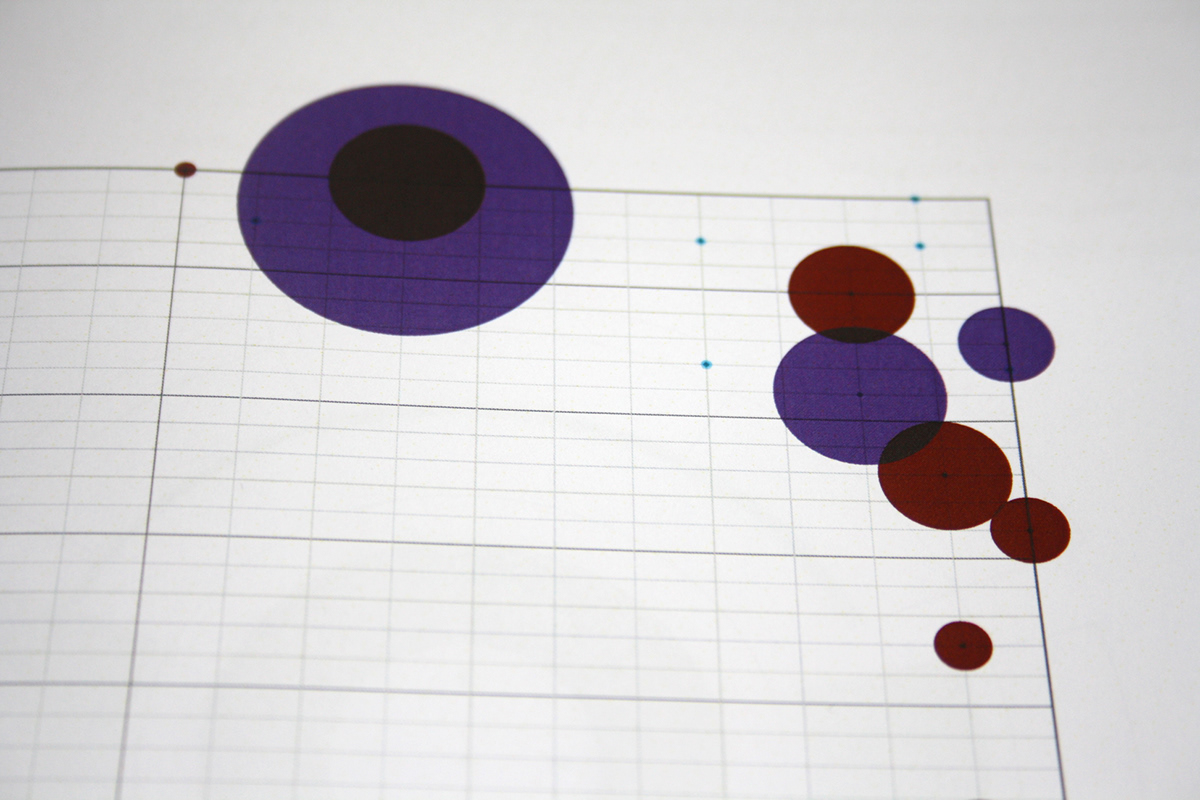
day 62: get lucky (detail)
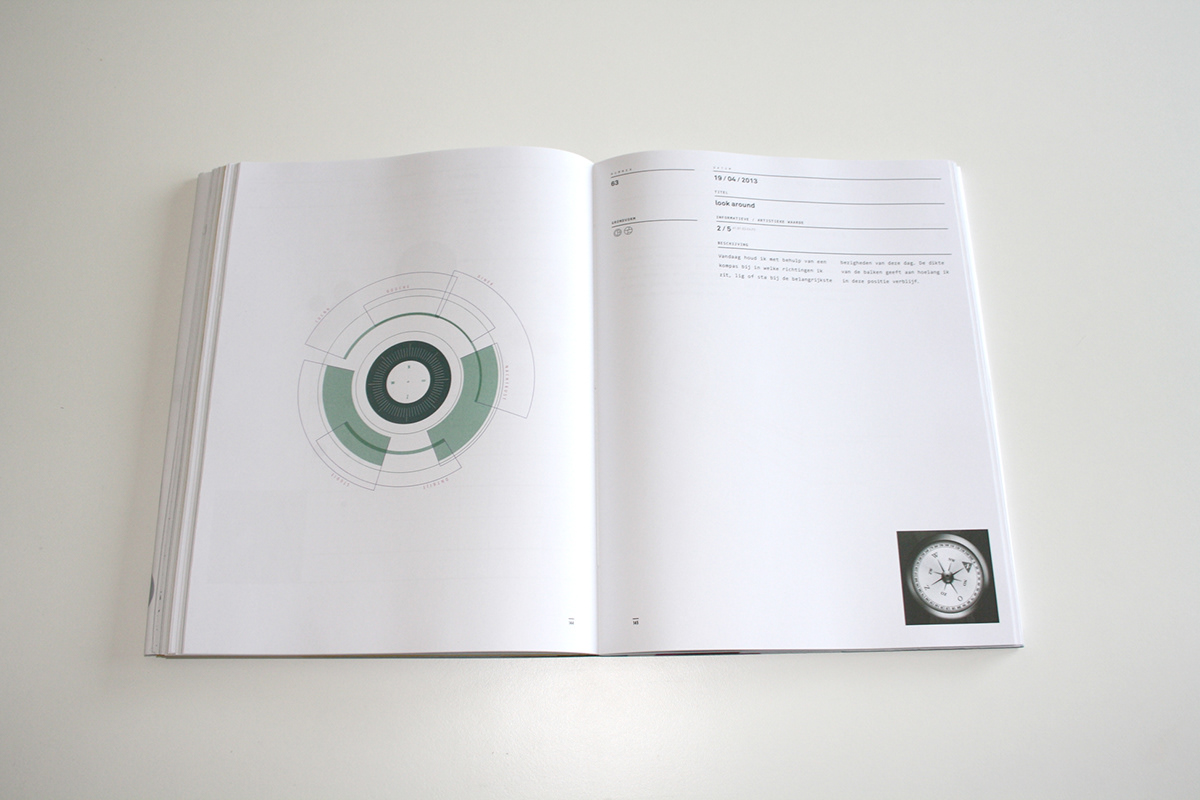
day 63: look around
day 63: look around (detail)
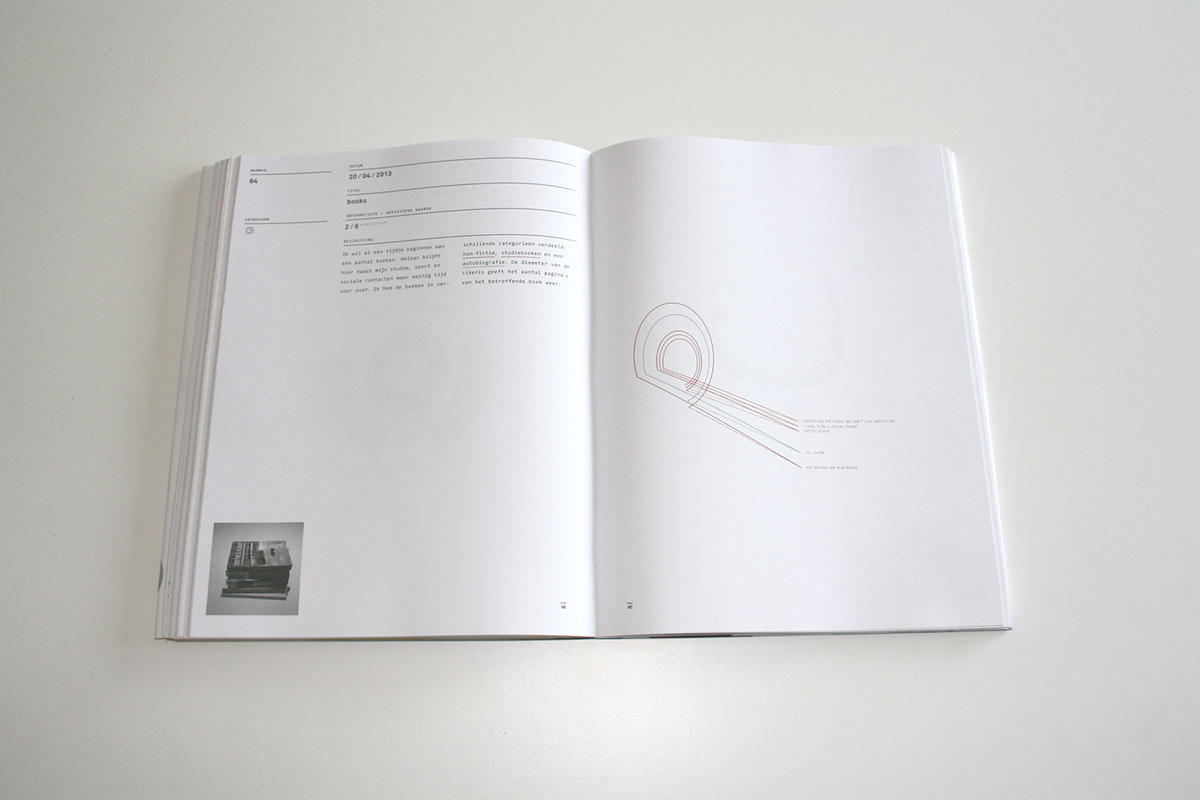
day 64: books
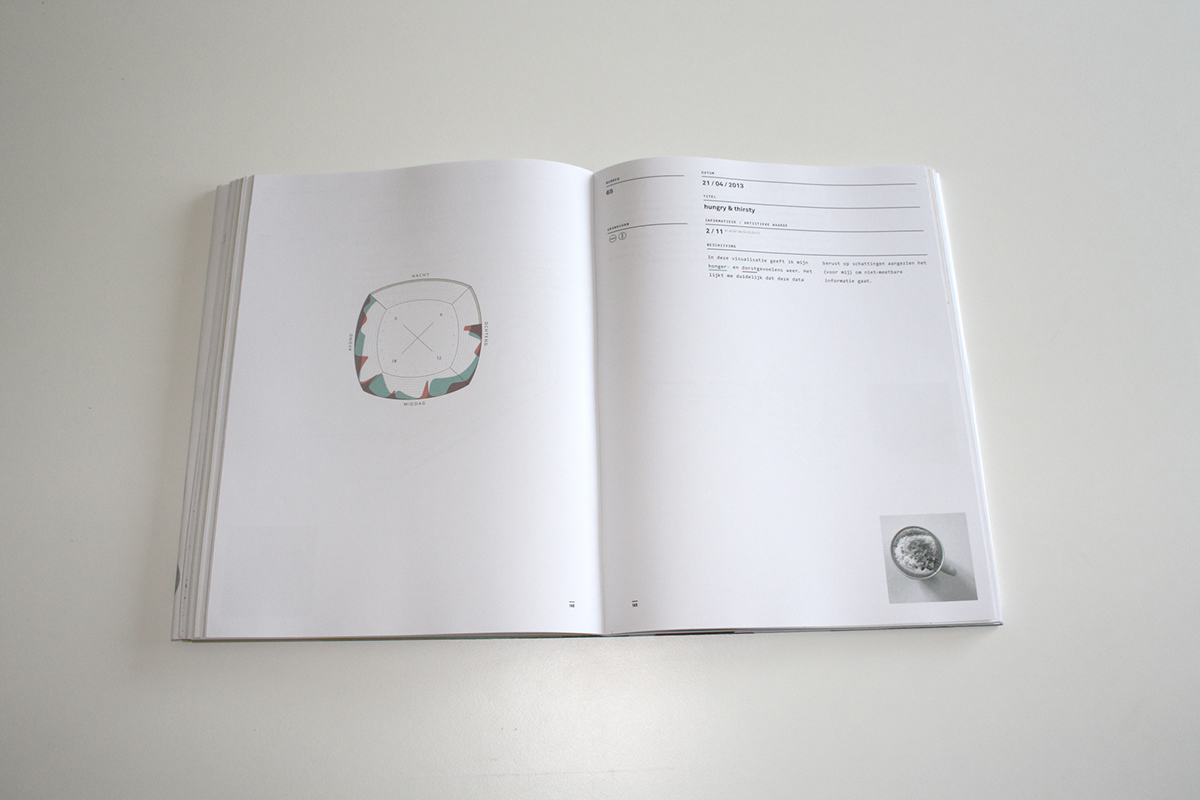
day 65: hungry & thirsty
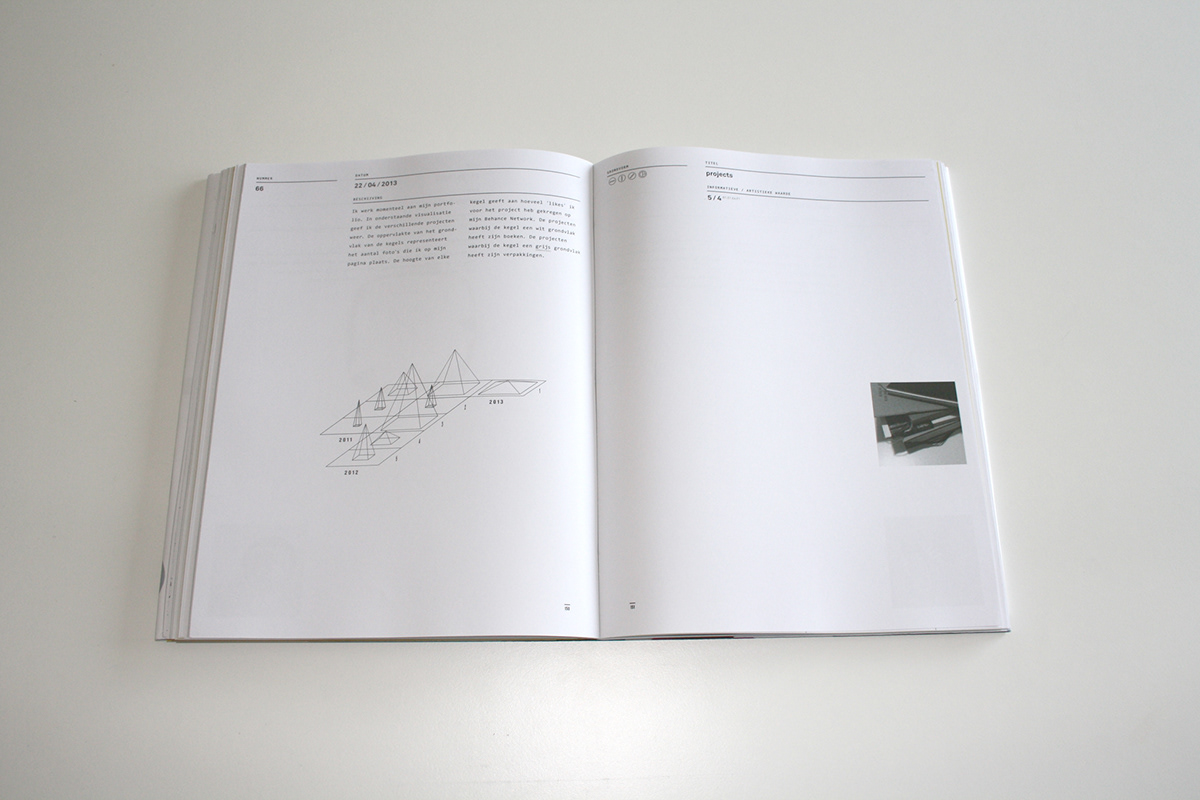
day 66: projects
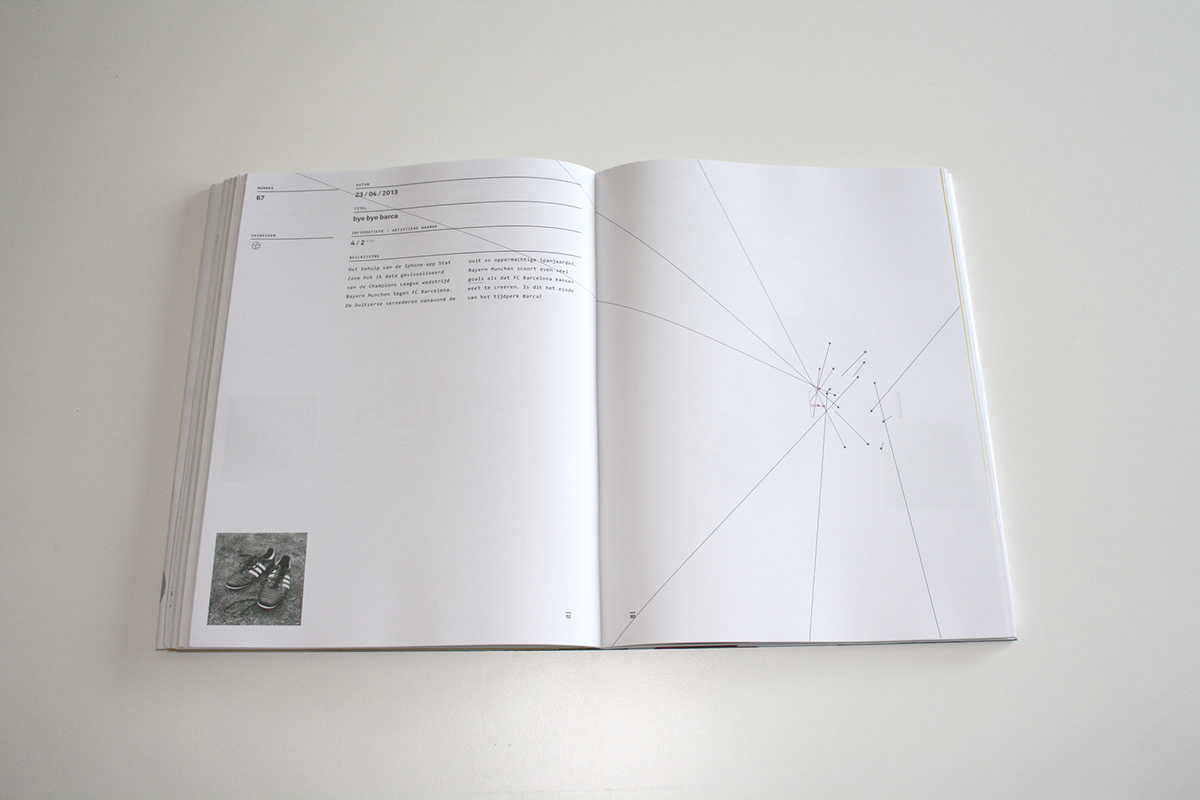
day 67: bye bye barca
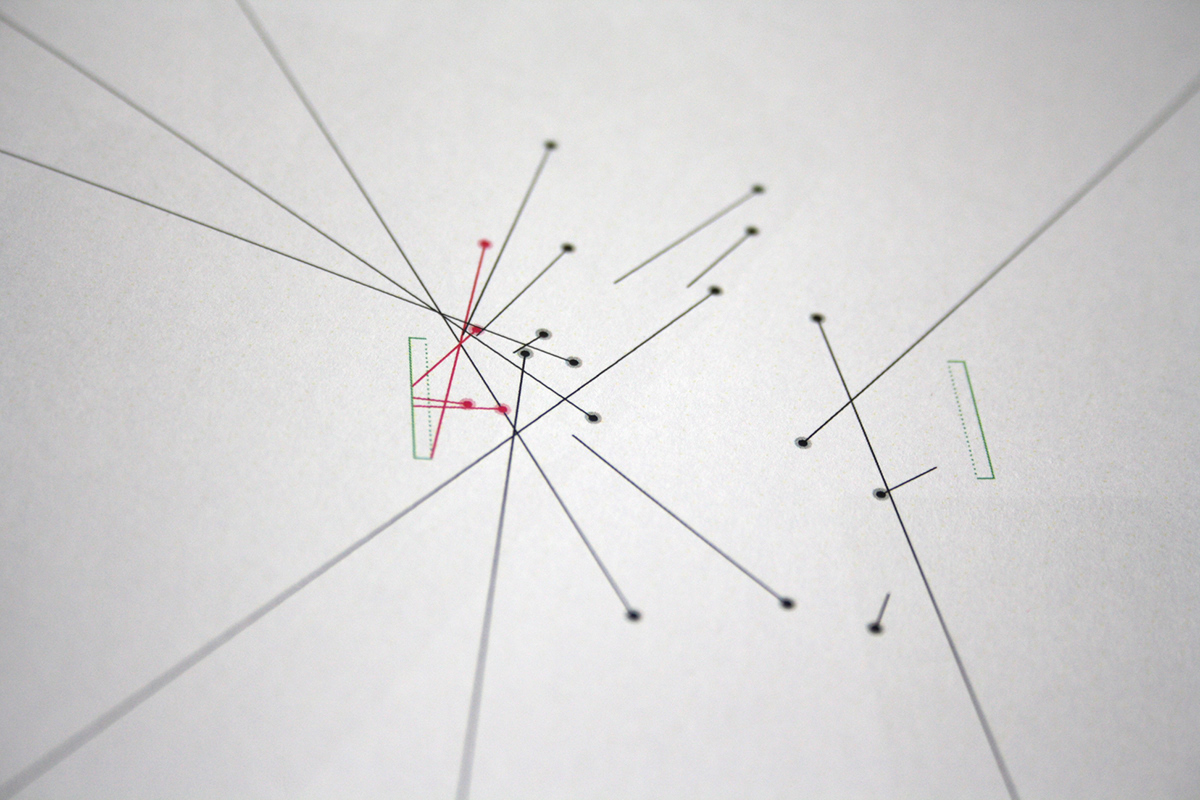
day 67: bye bye barca (detail)
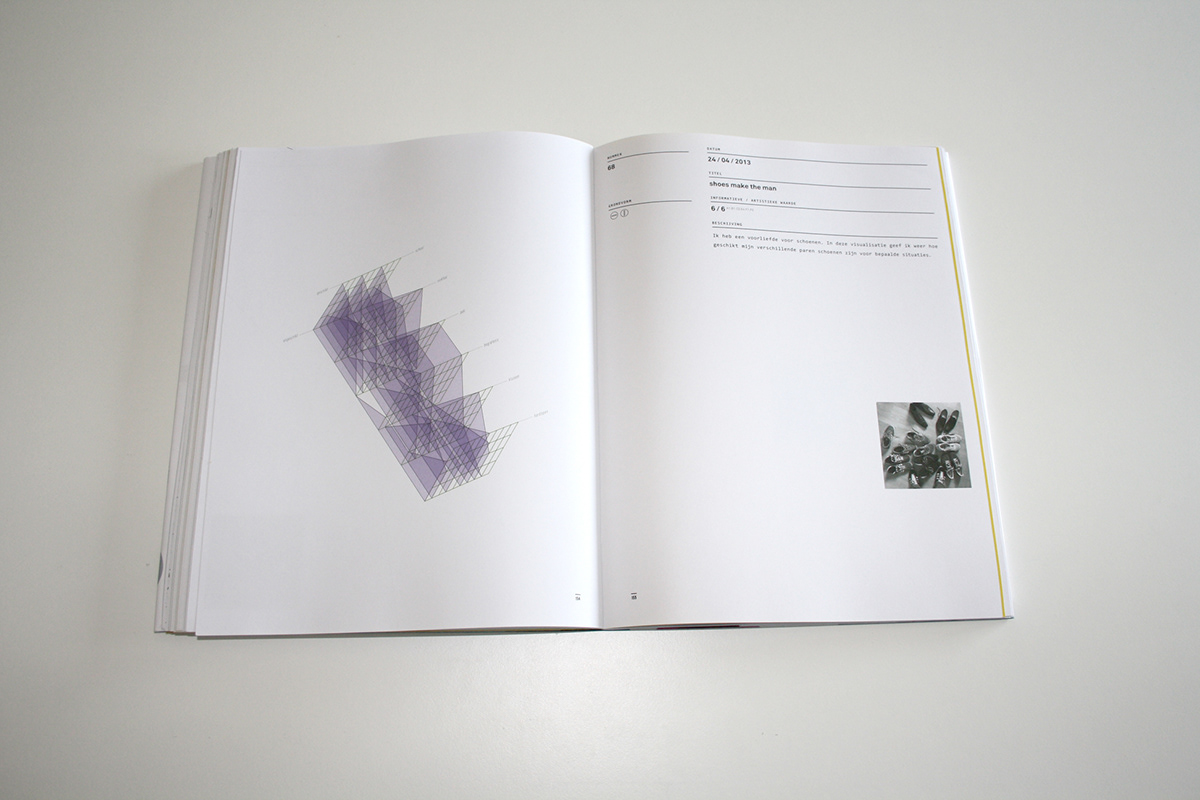
day 68: shoes make the man
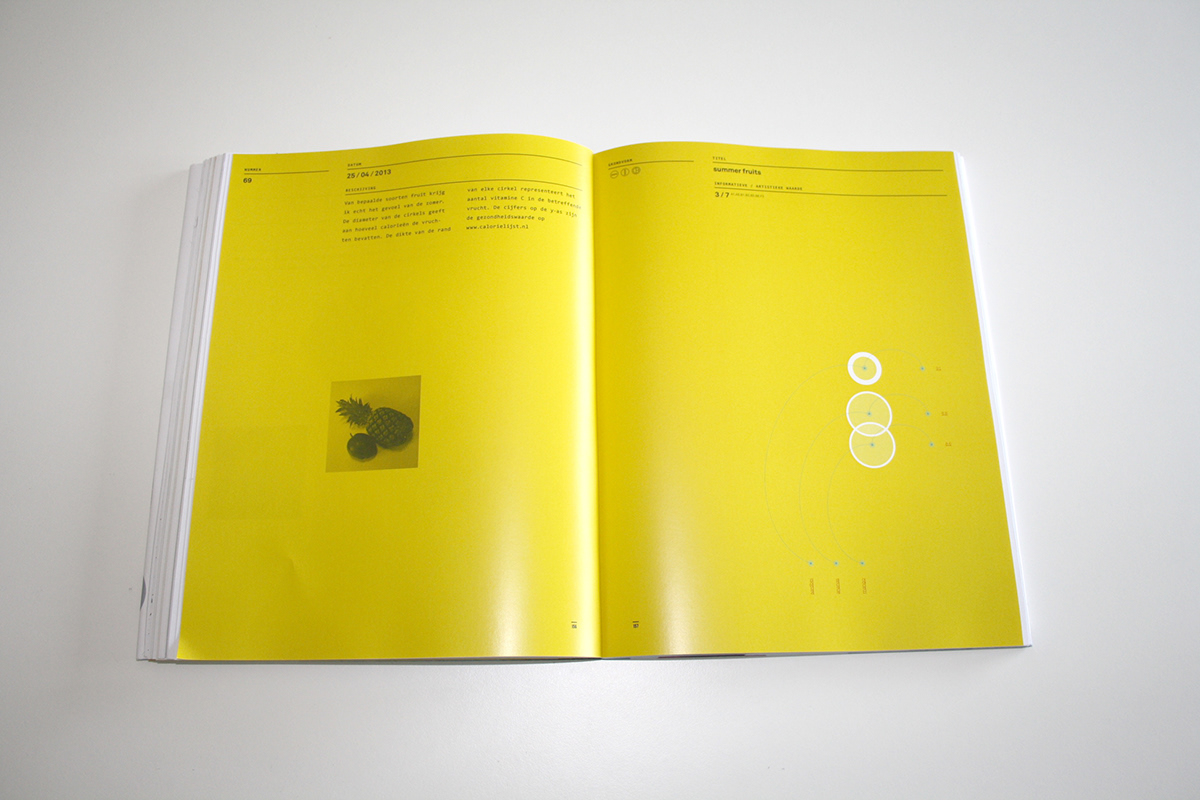
day 69: summer fruits
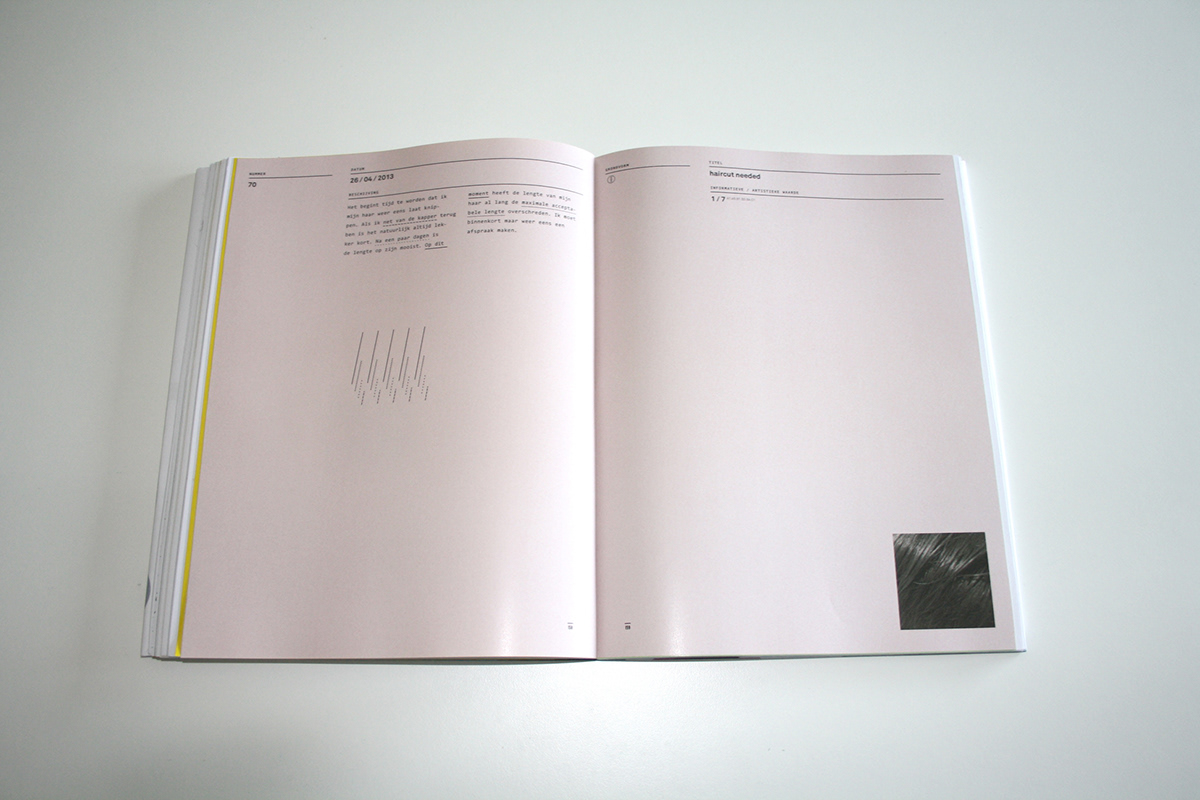
day 70: haircut needed
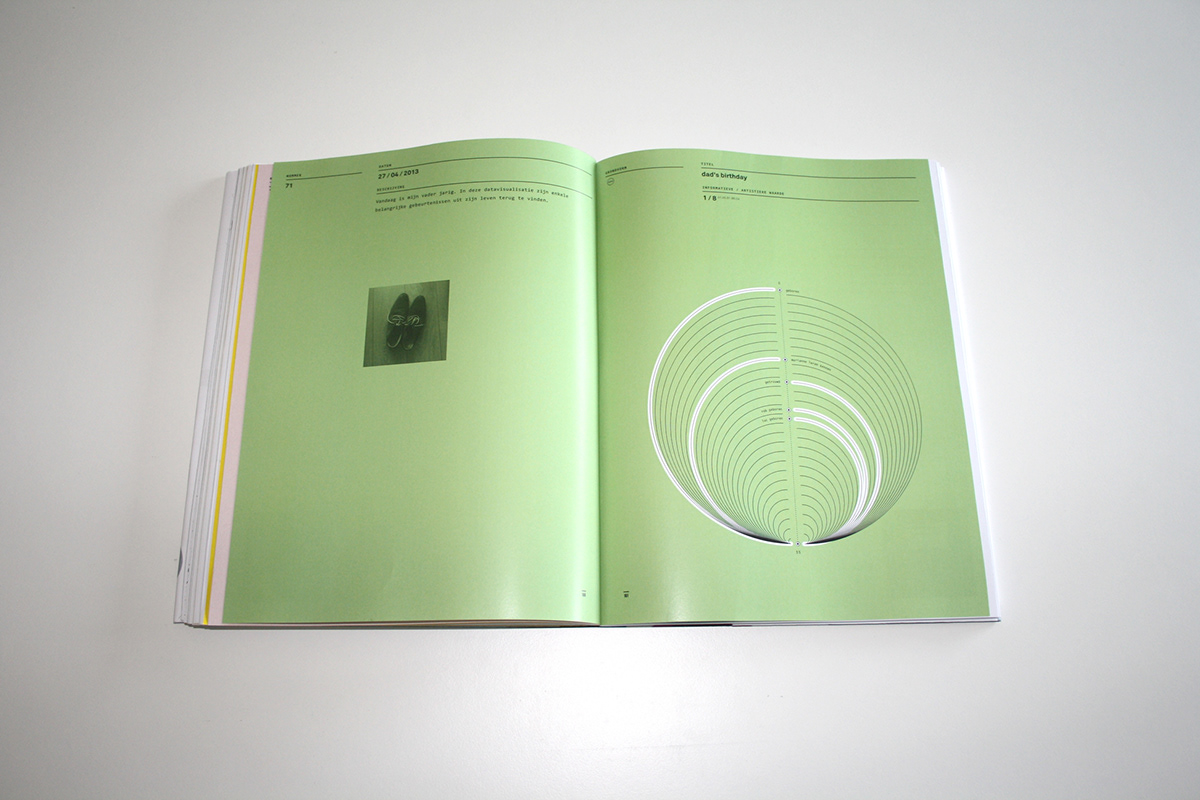
day 71: dad's birthday
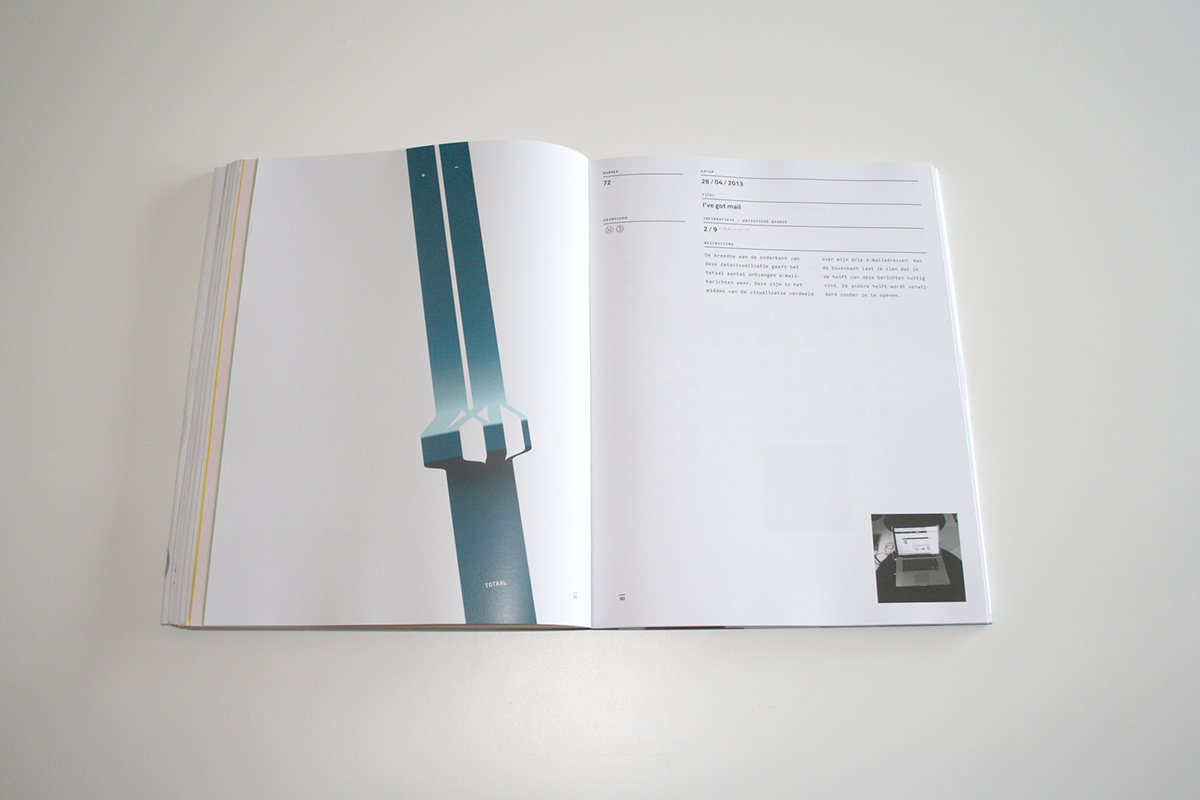
day 72: I've got mail
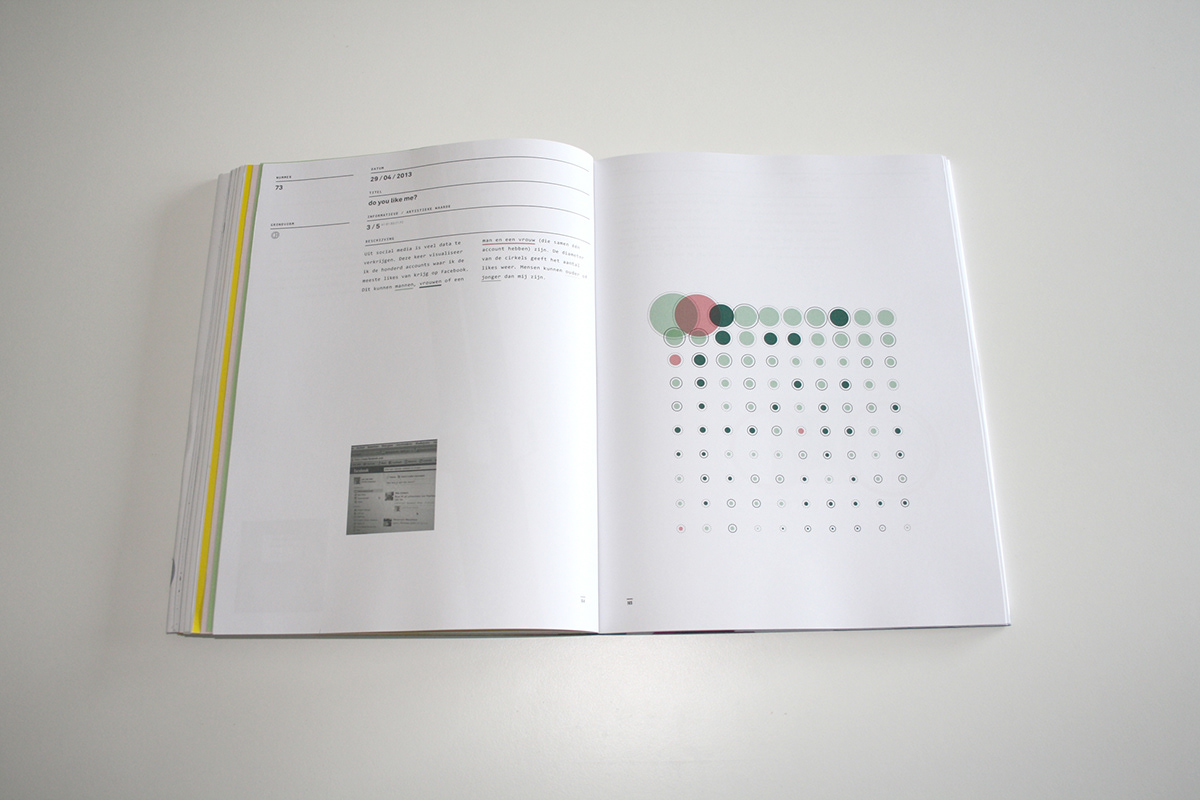
day 73: do you like me?
day 73: do you like me? (detail)
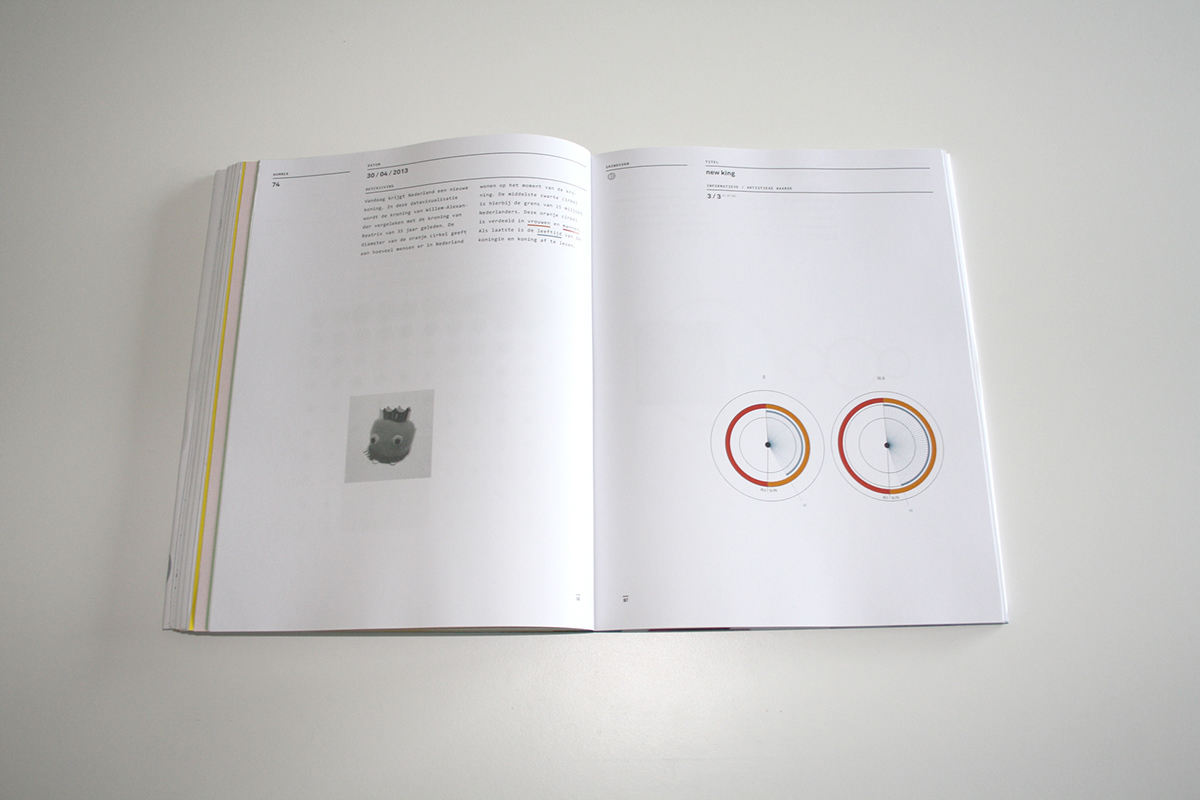
day 74: new king
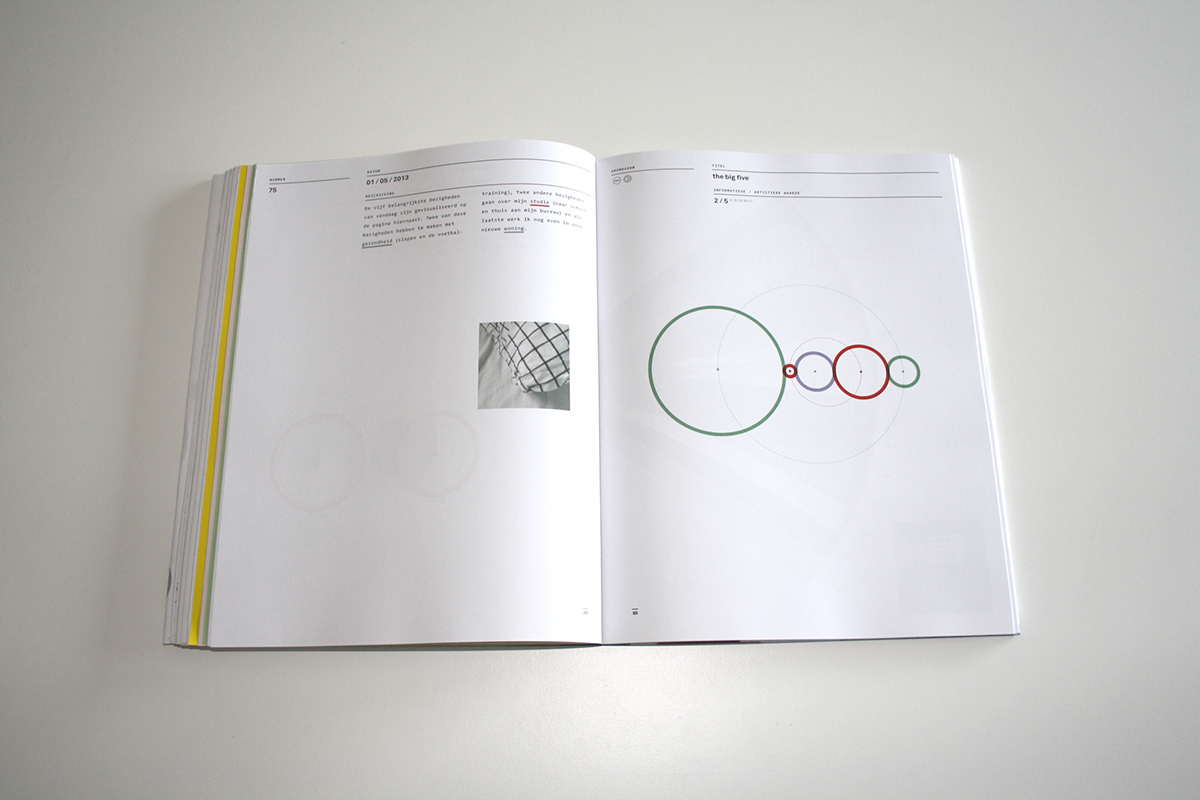
day 75: the big five
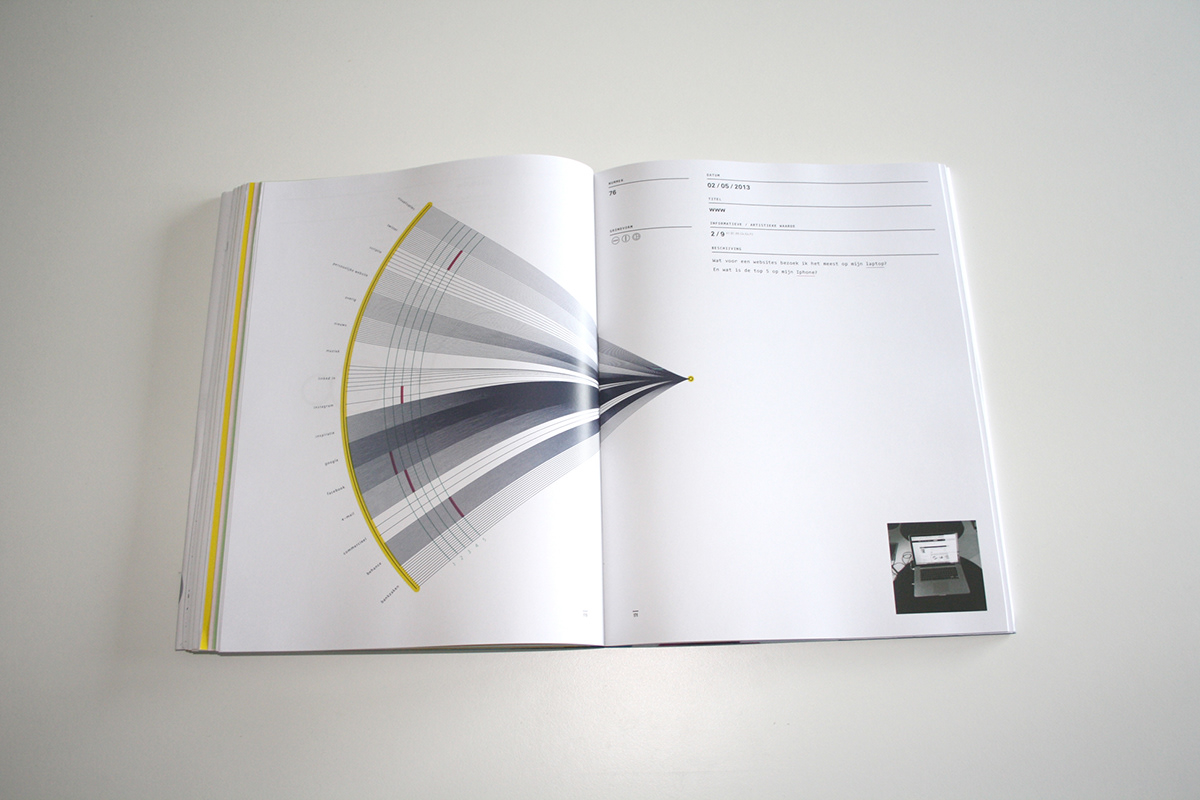
day 76: www
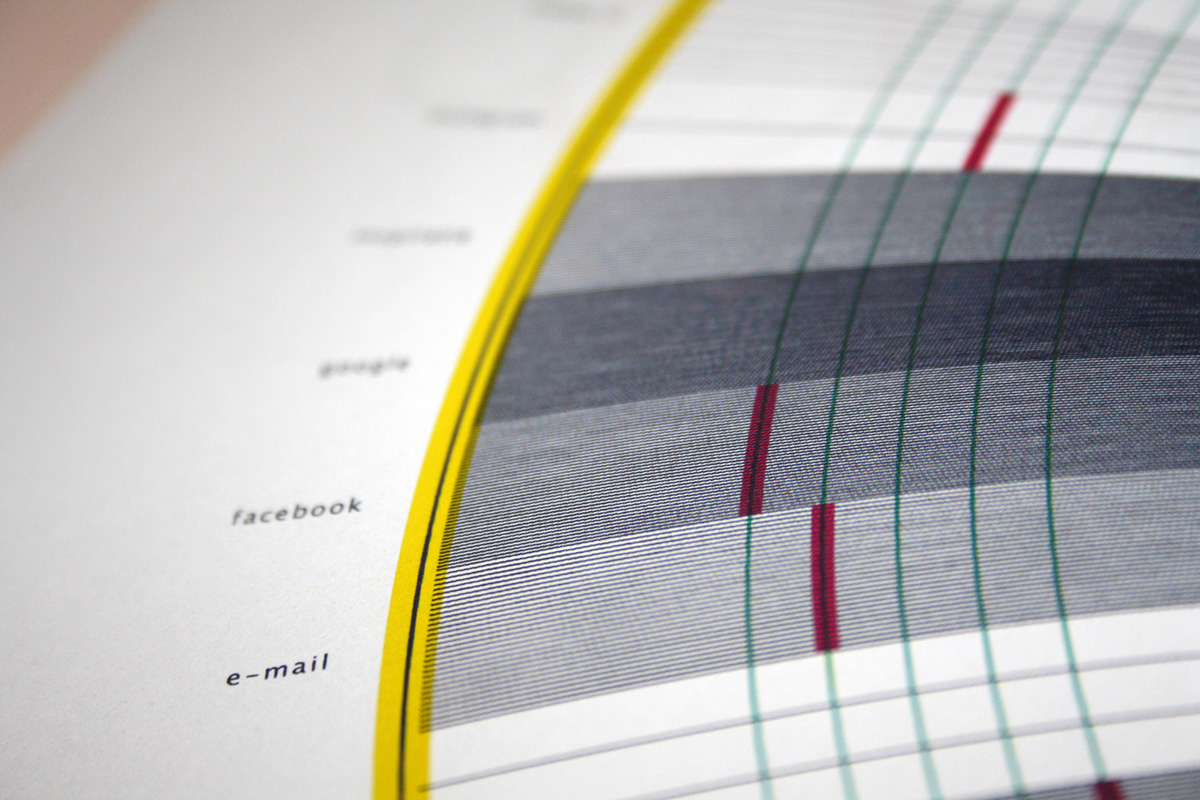
day 76: www (detail)
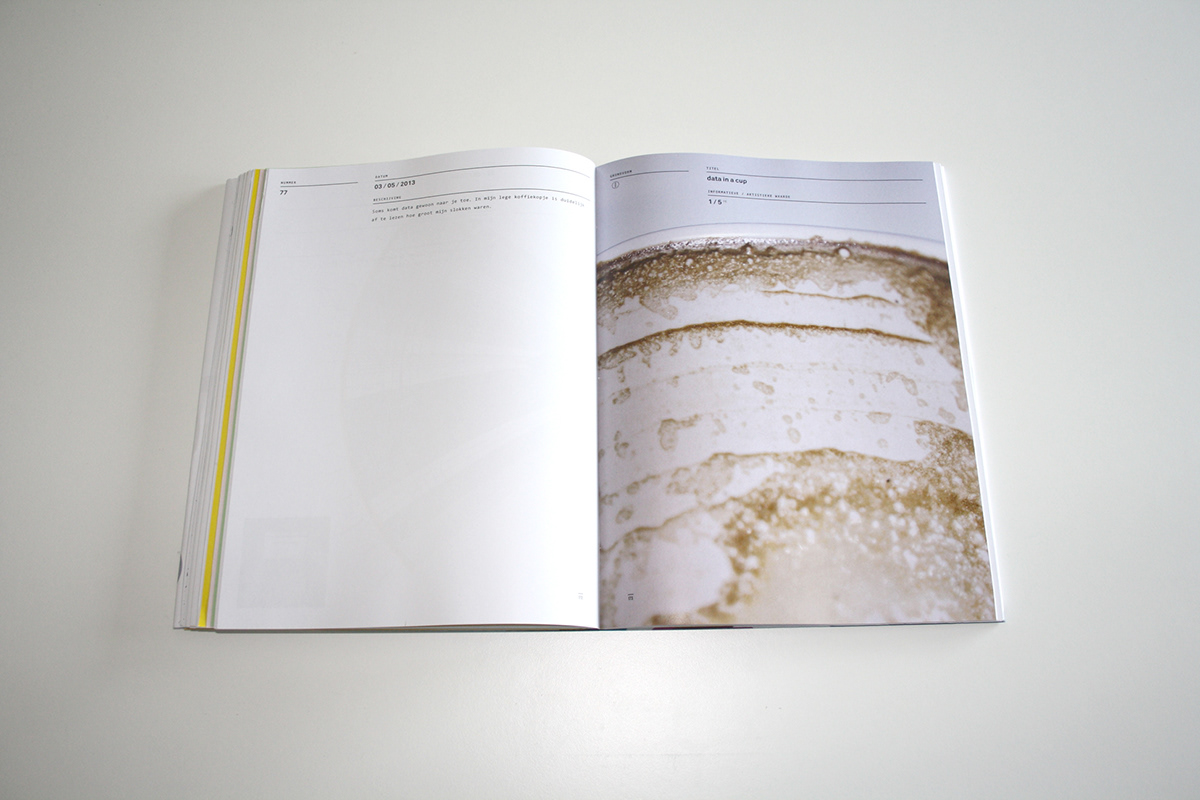
day 77: data in a cup
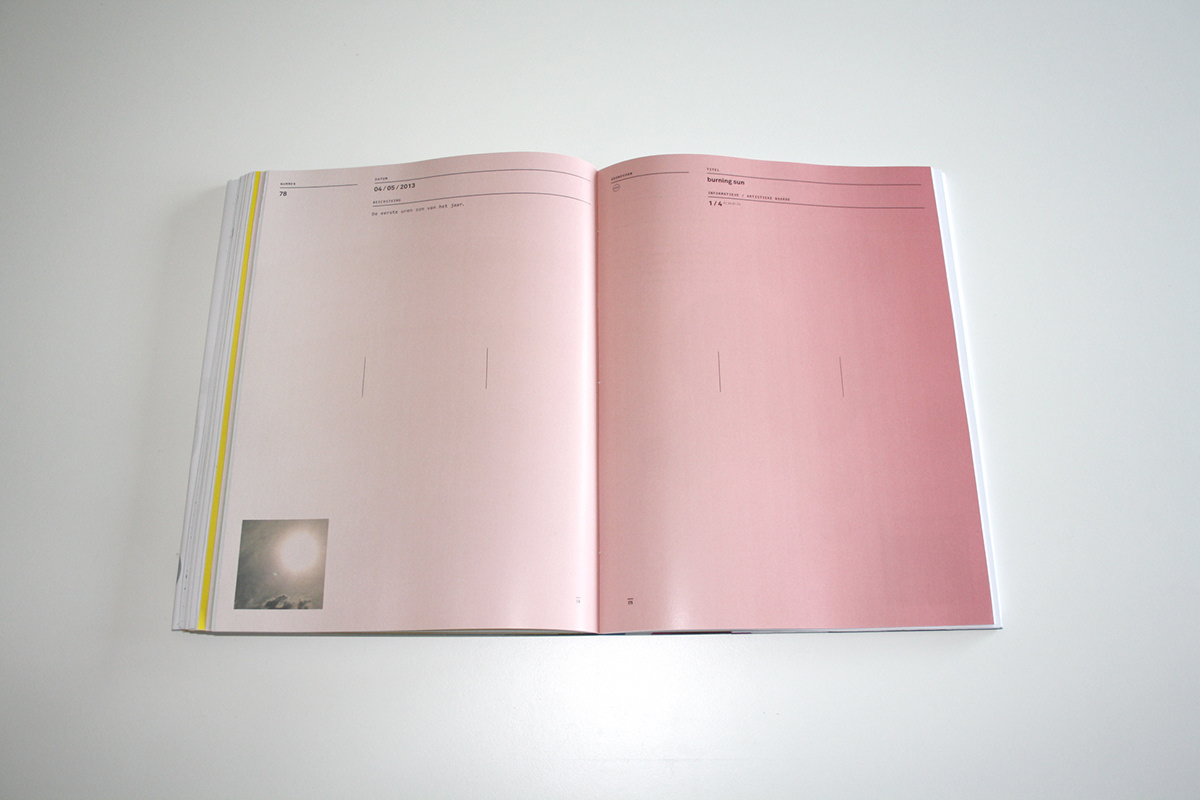
day 78: burning sun
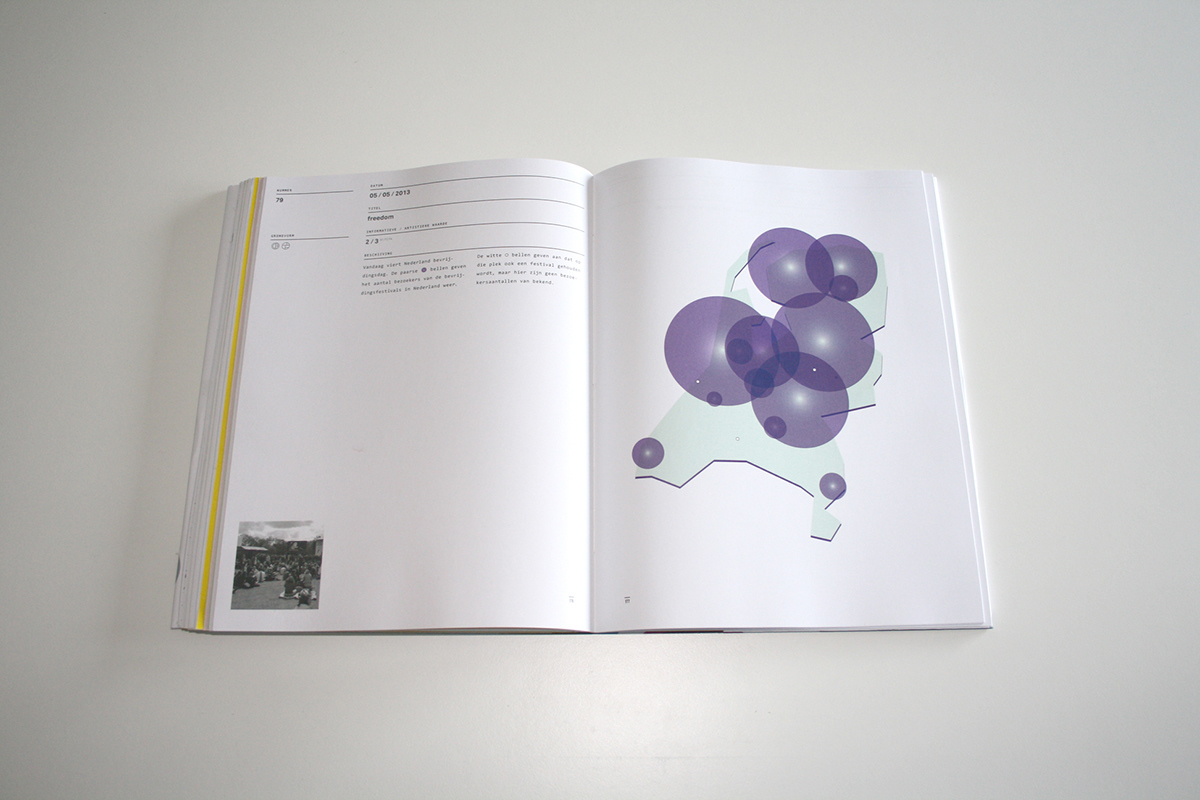
day 79: freedom
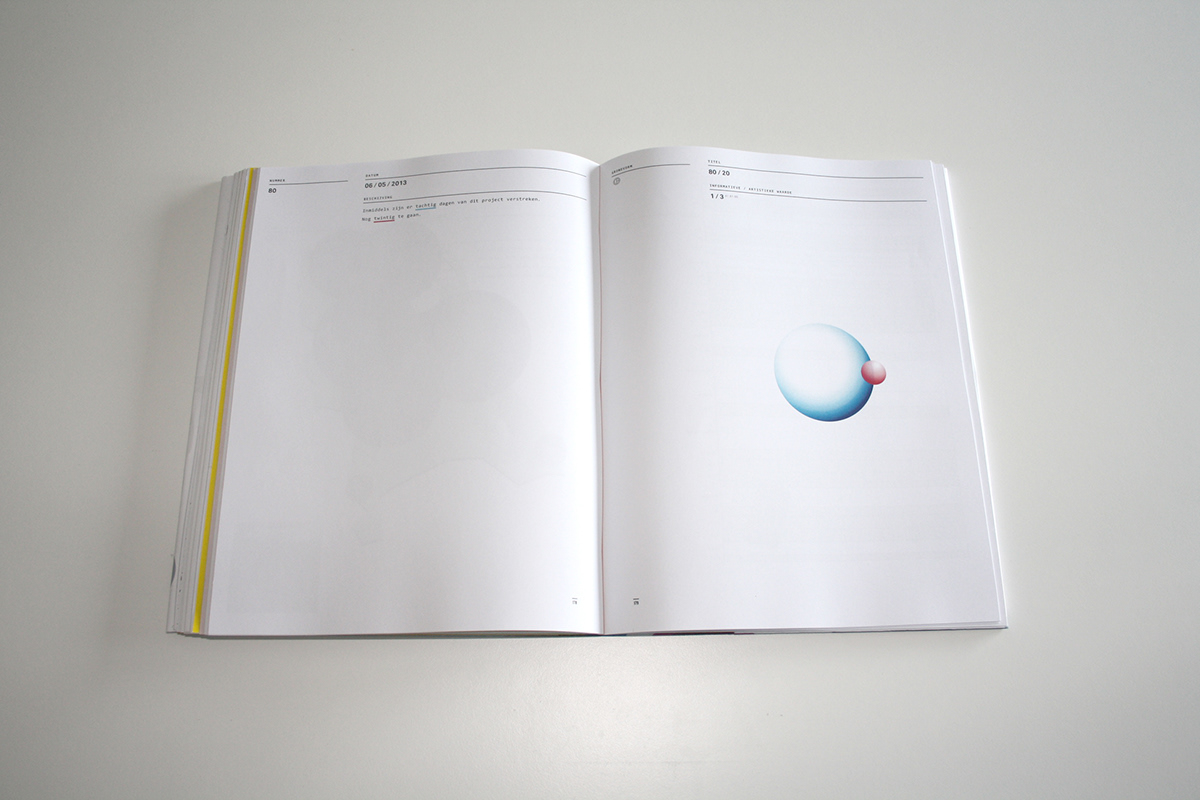
day 80: 80 / 20
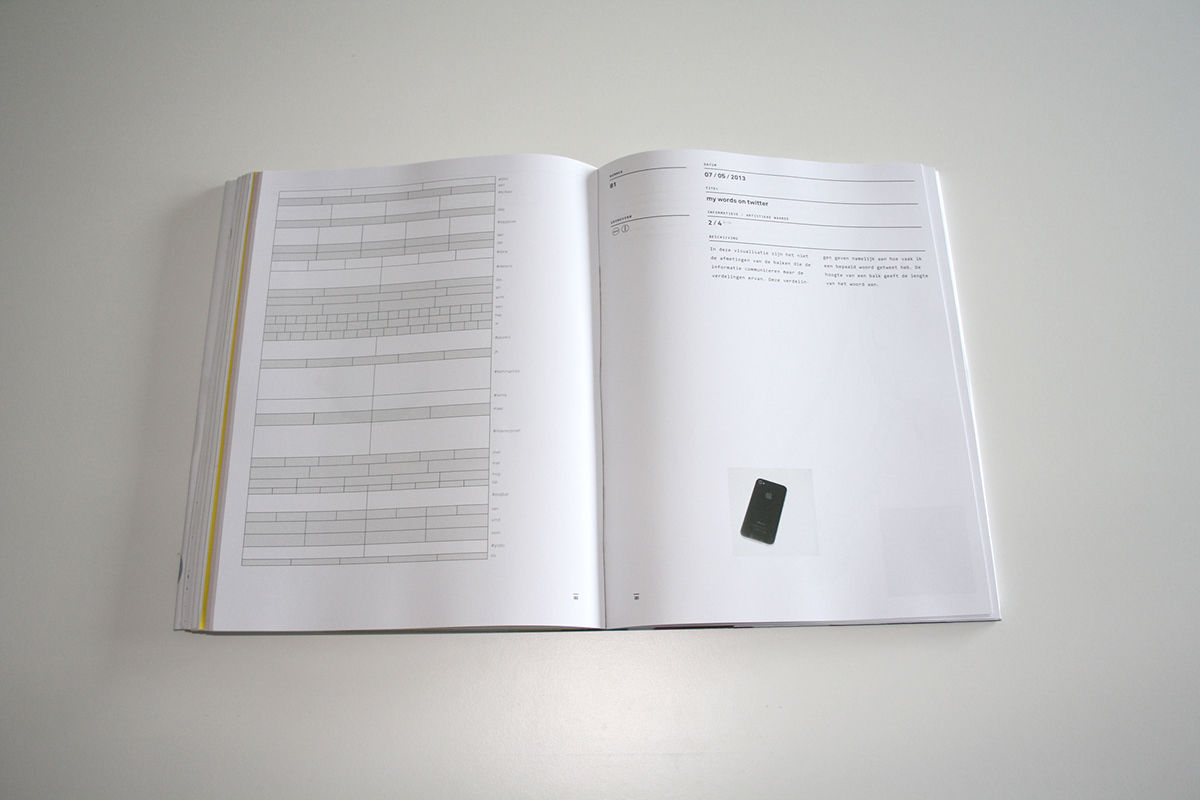
day 81: my words on twitter
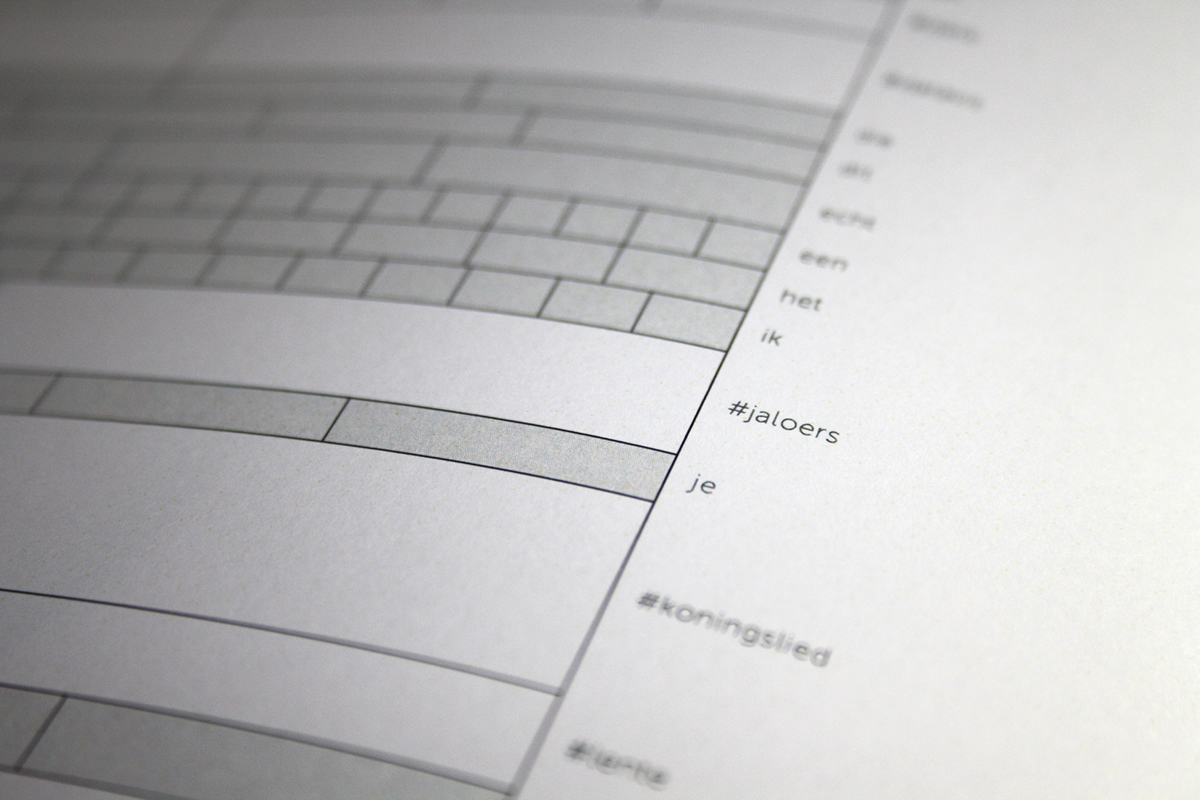
day 81: my words on twitter (detail)
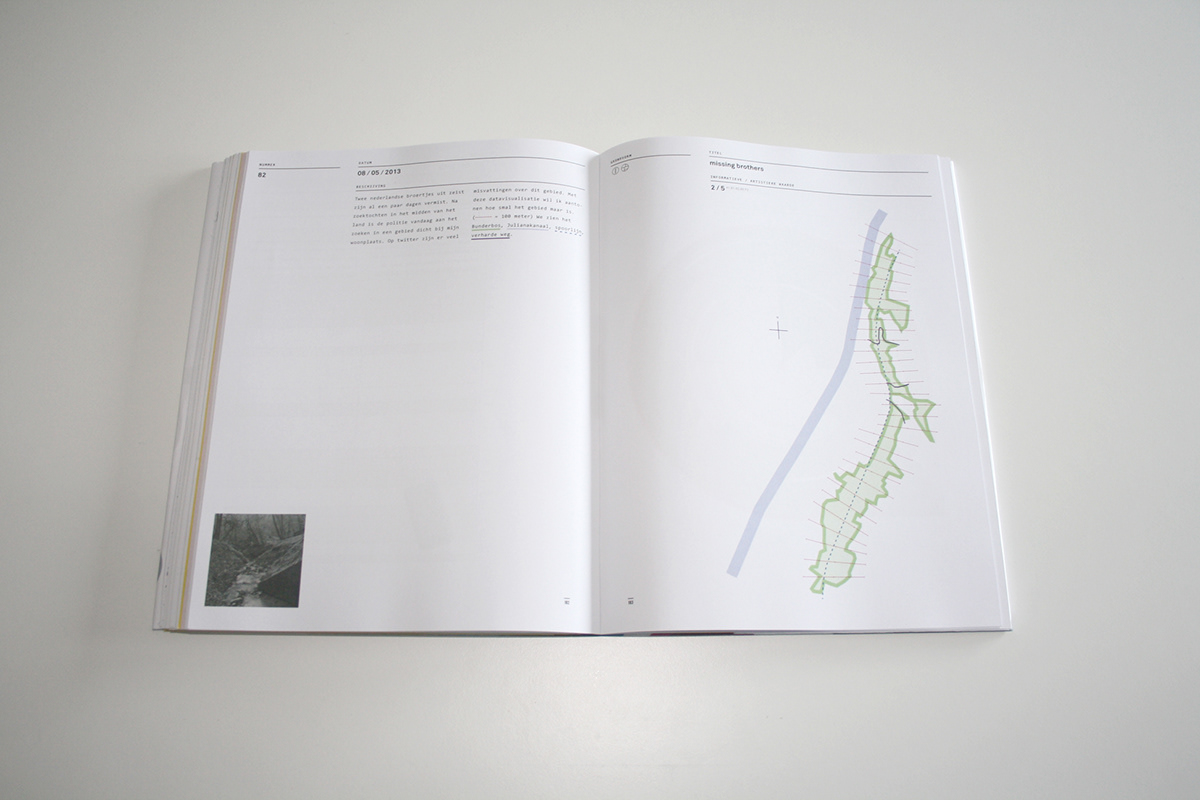
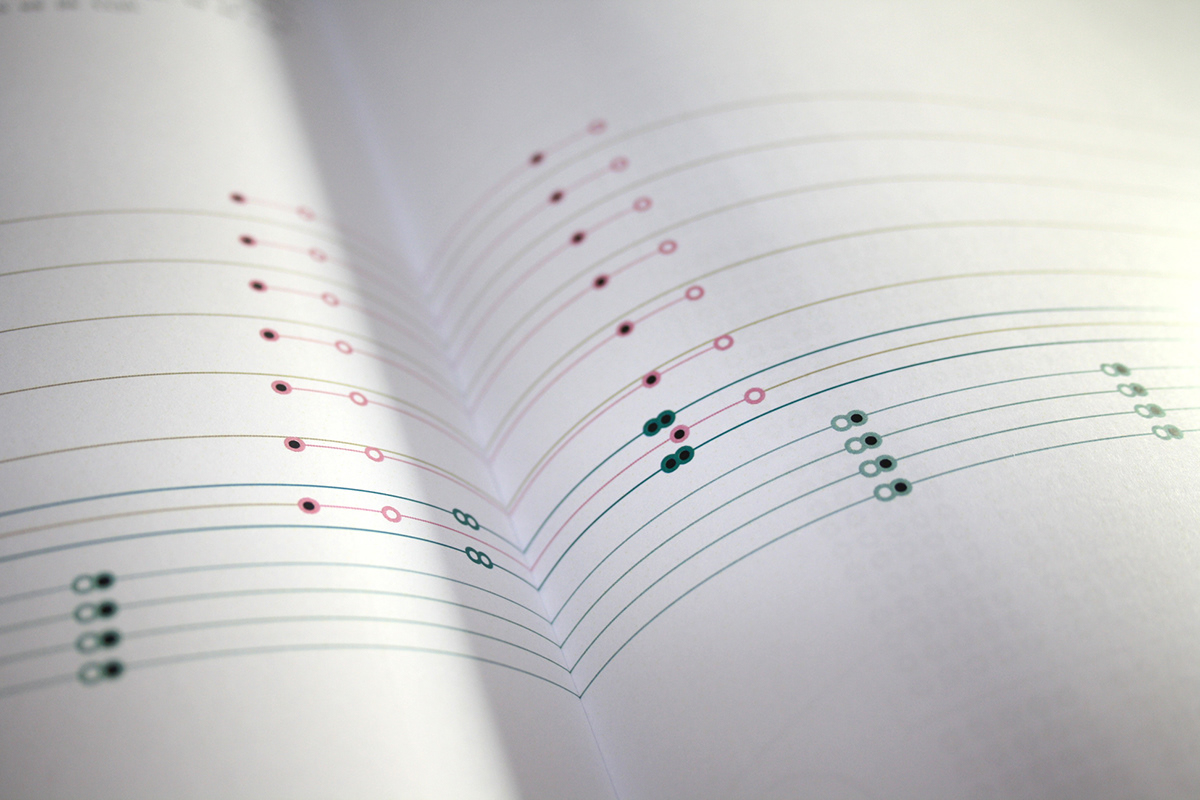
day 82: missing brothers
day 82: missing brothers (detail)
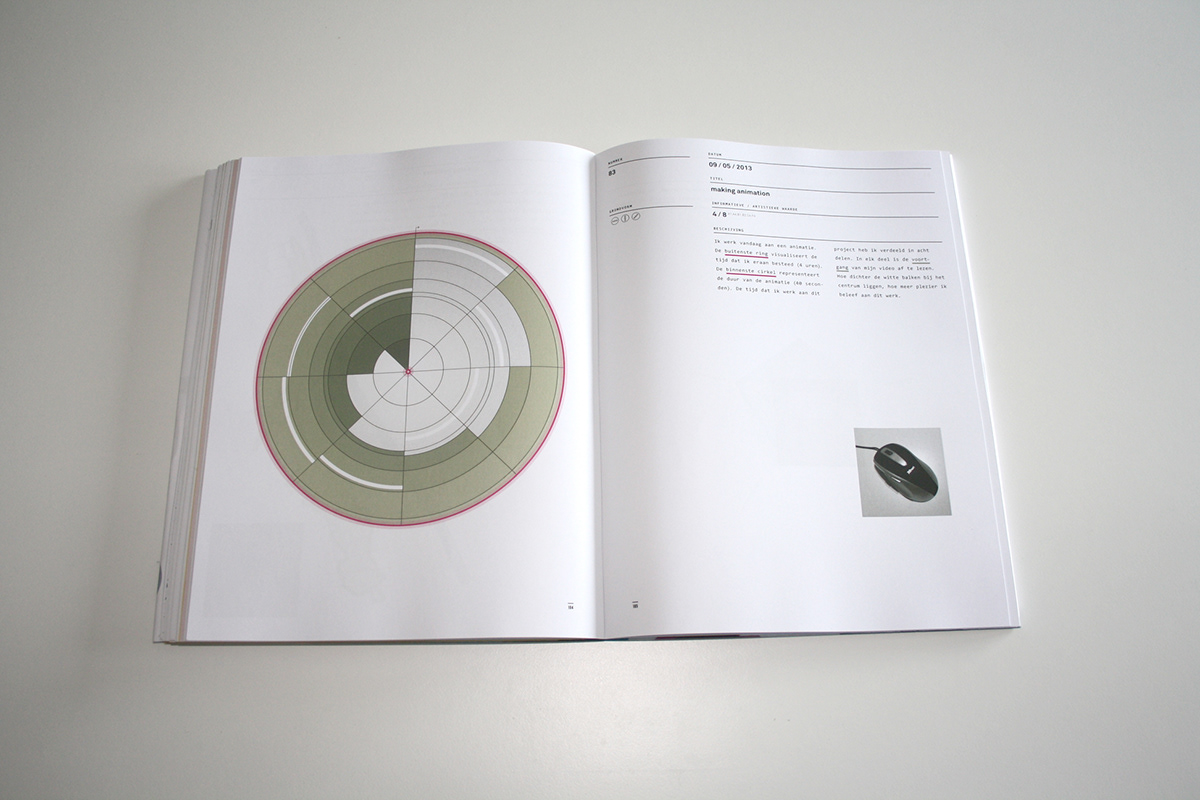
day 83: making animation
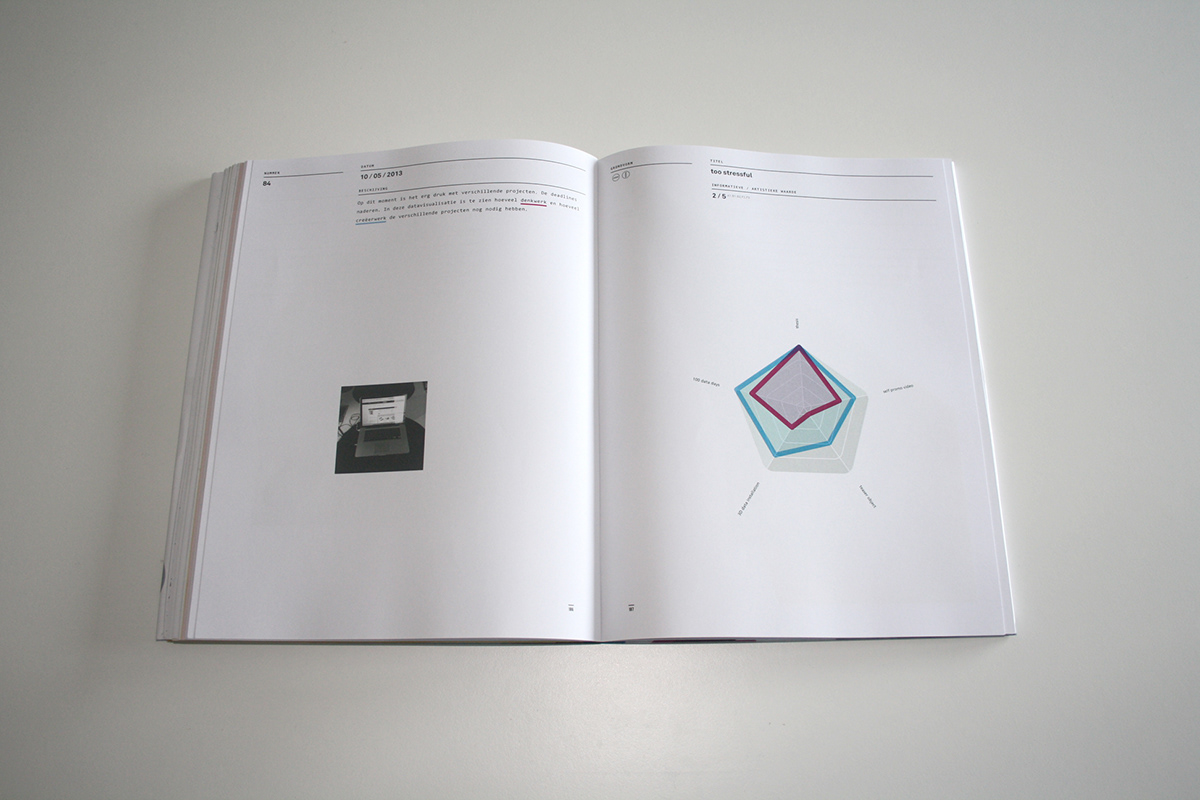
day 84: too stressful
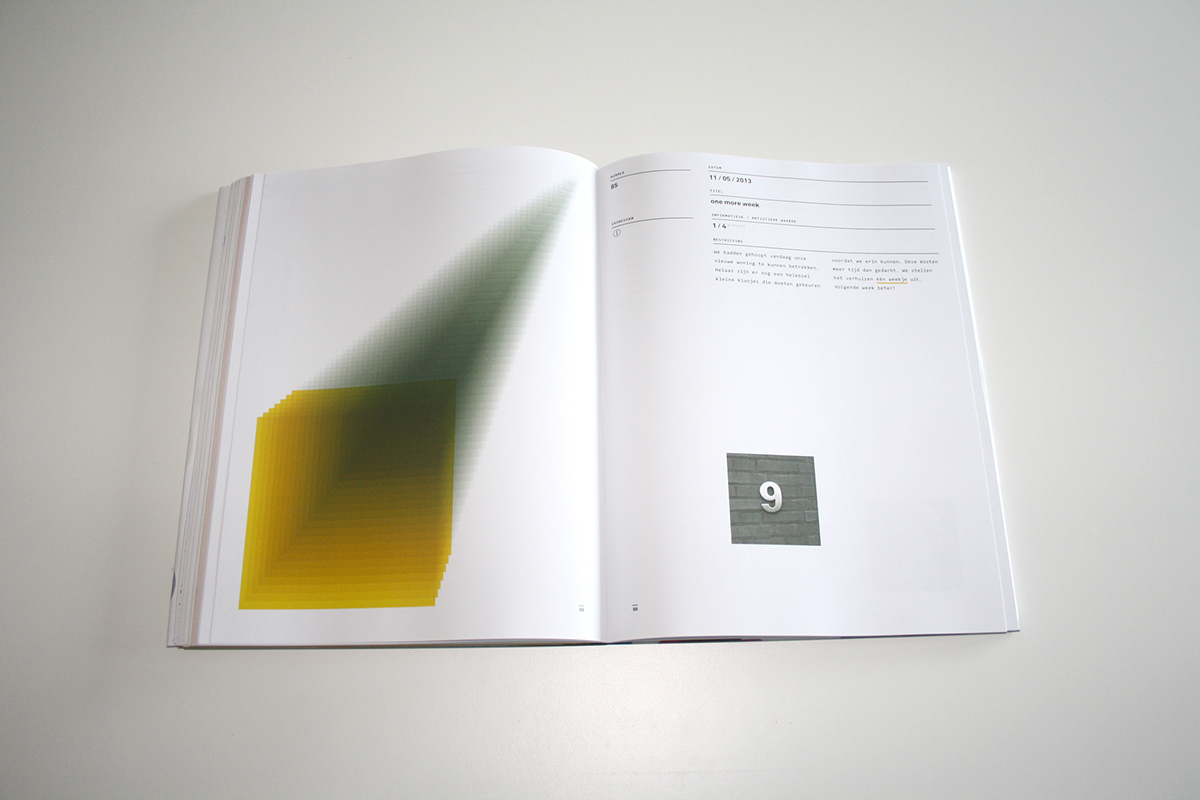
day 85: one more week
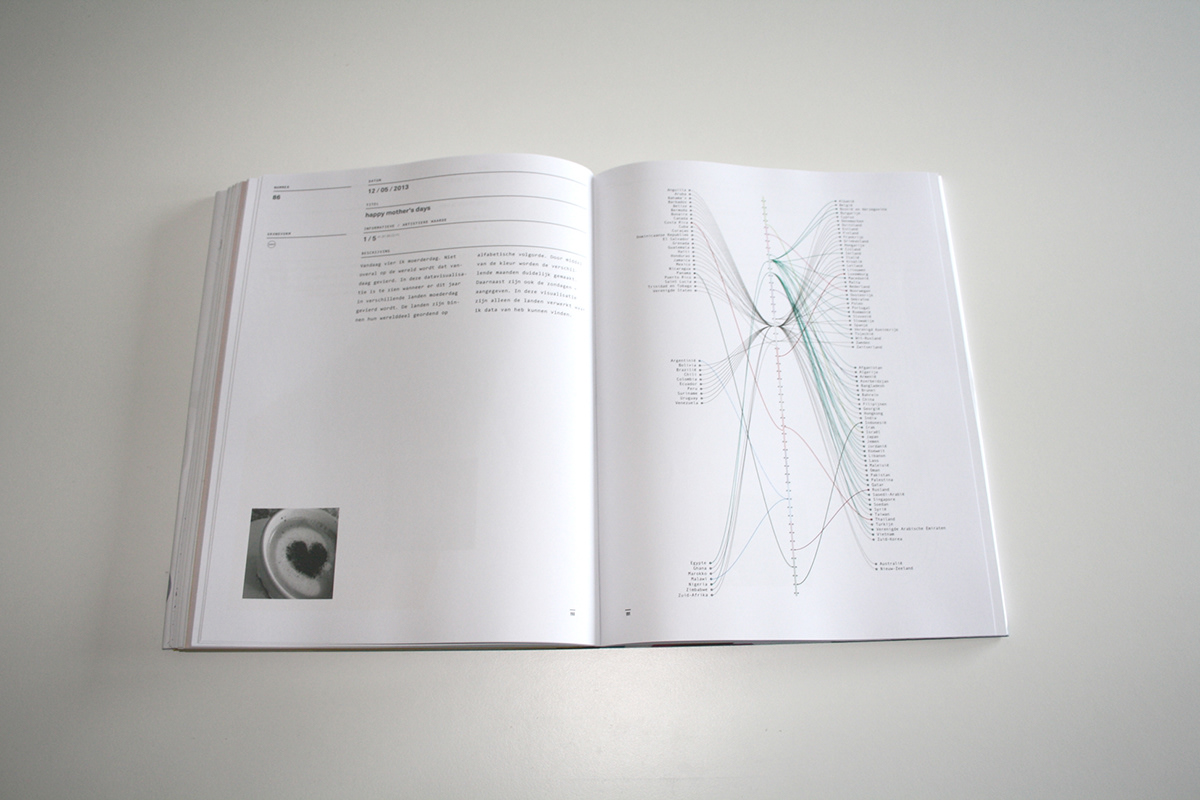
day 86: happy mother's day
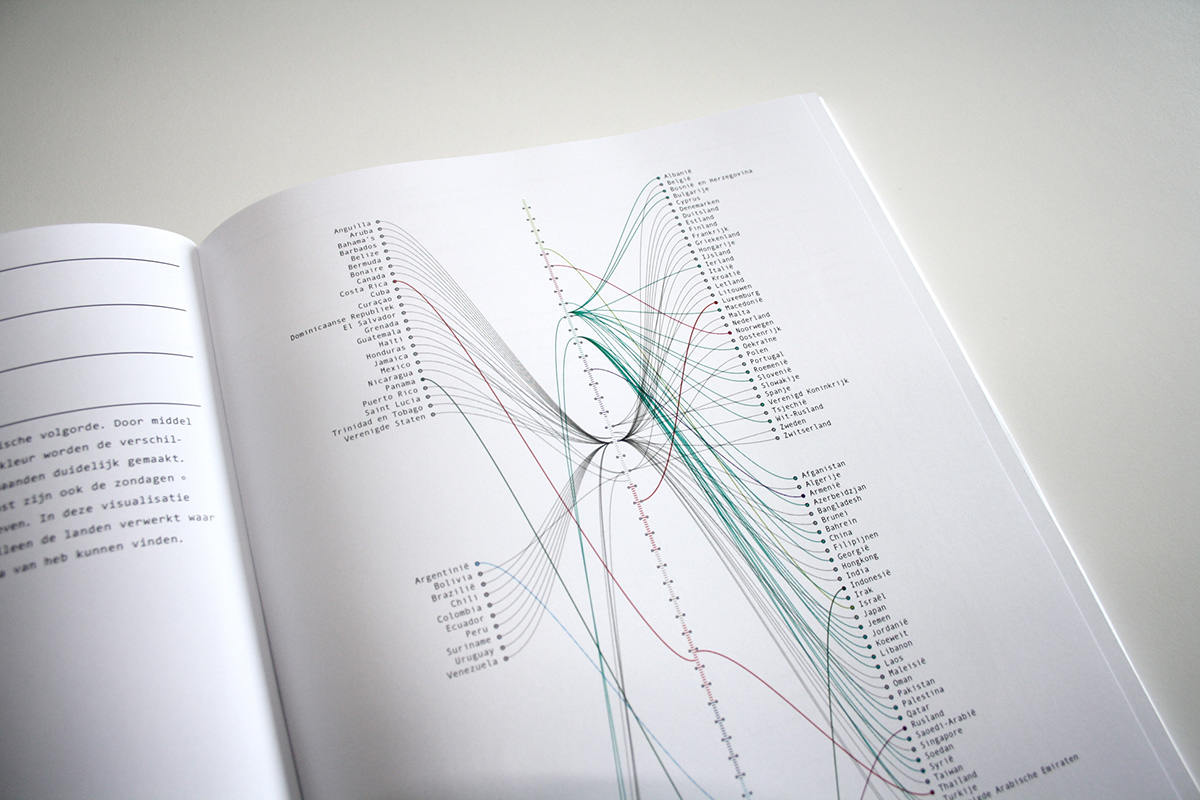
day 86: happy mother's day (detail)
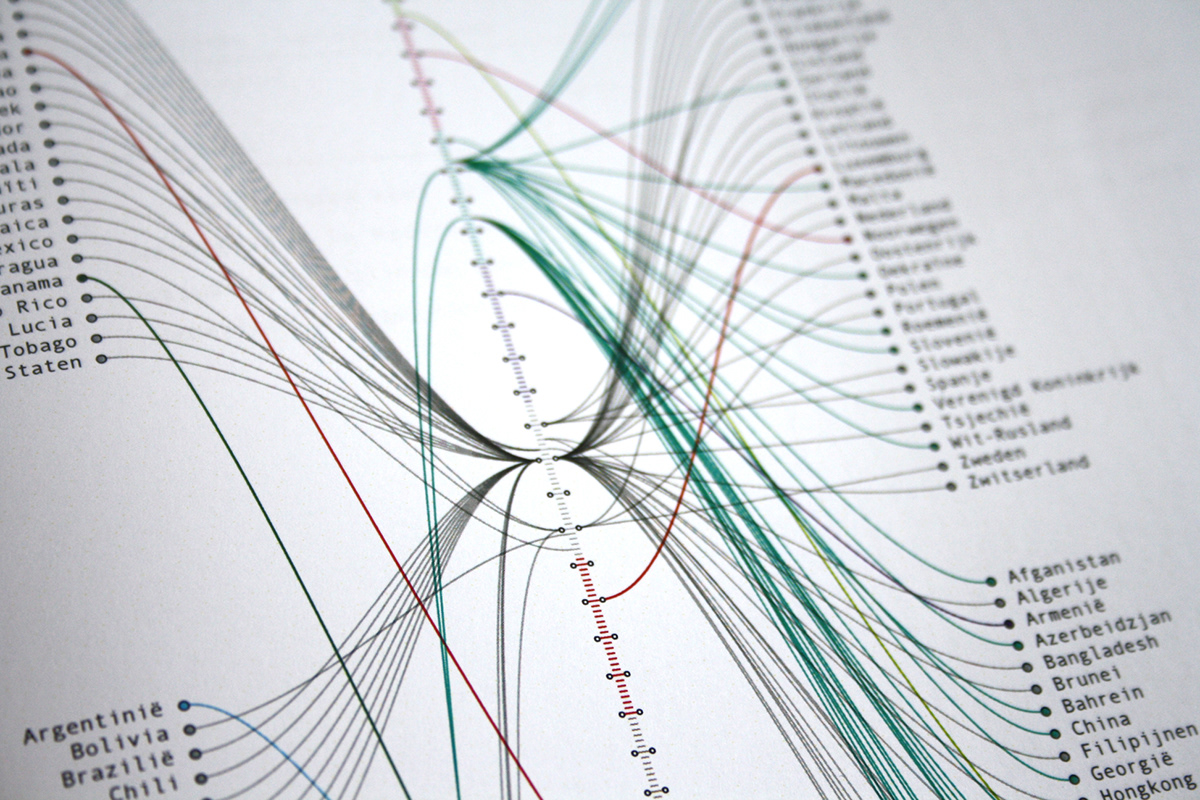
day 86: happy mother's day (detail 2)
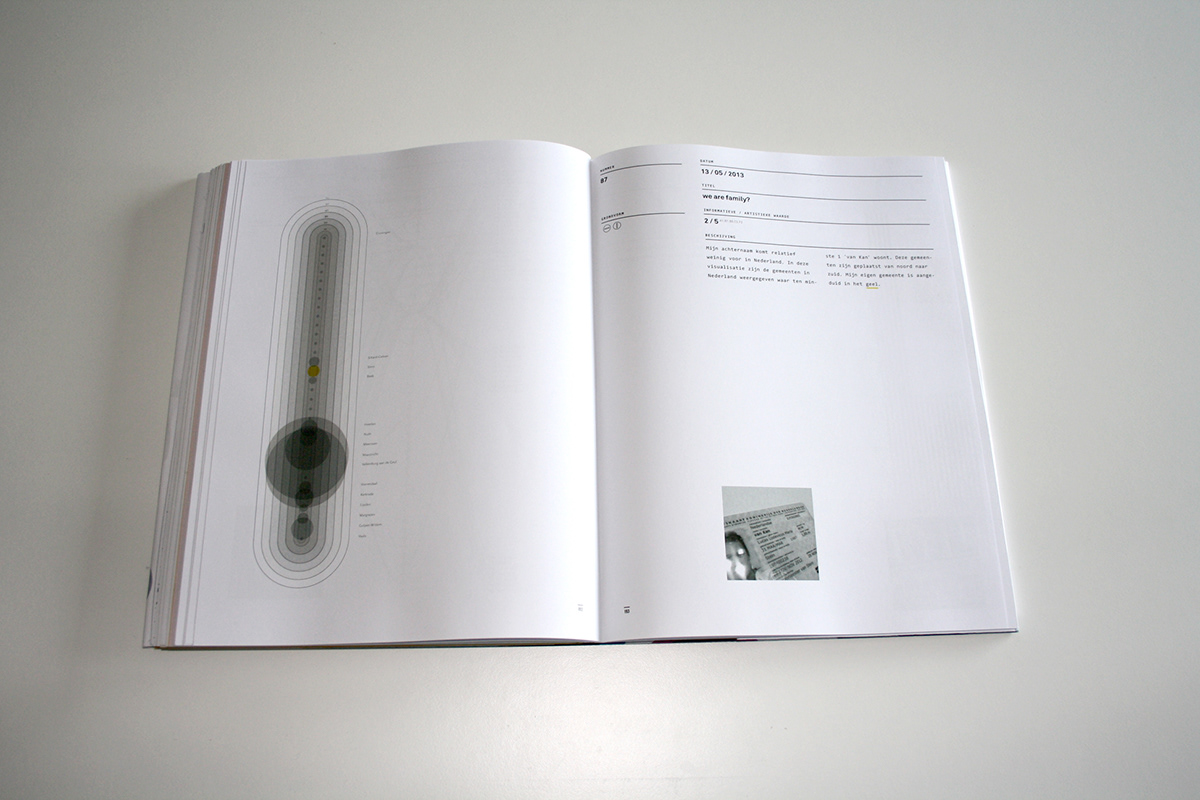
day 87: we are family?
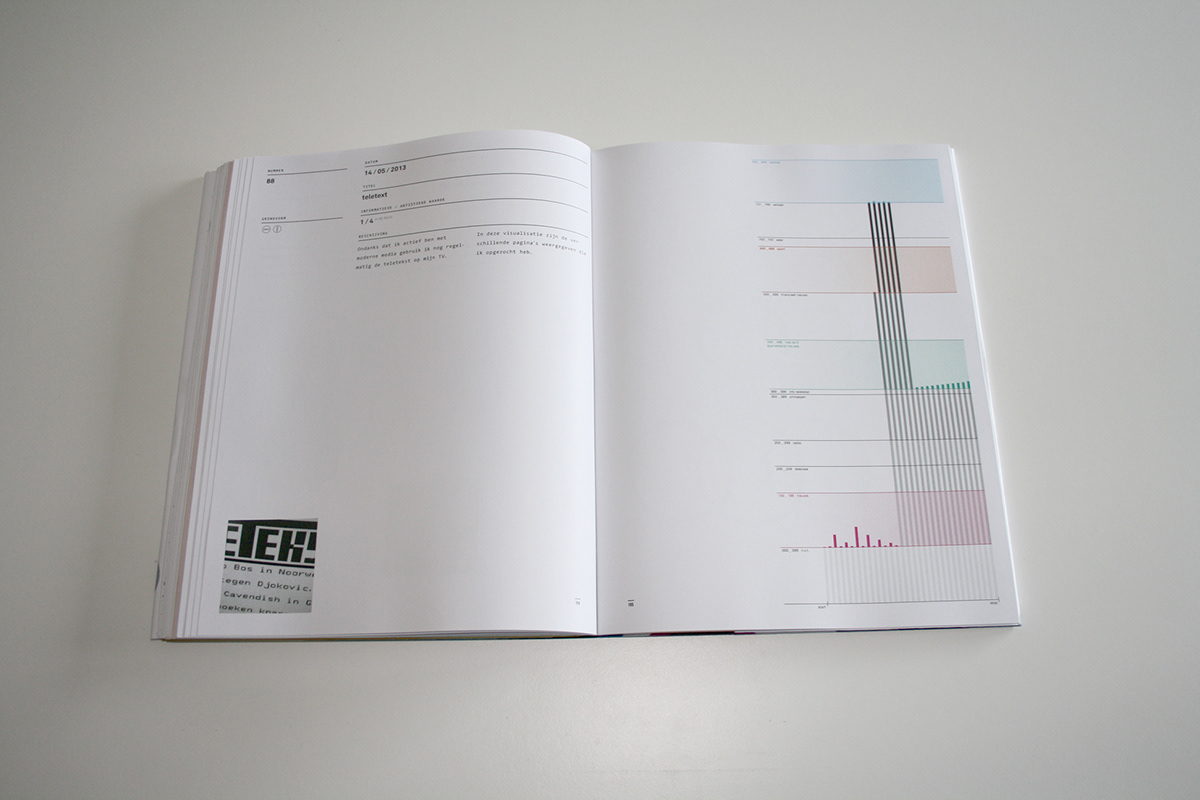
day 88: teletext
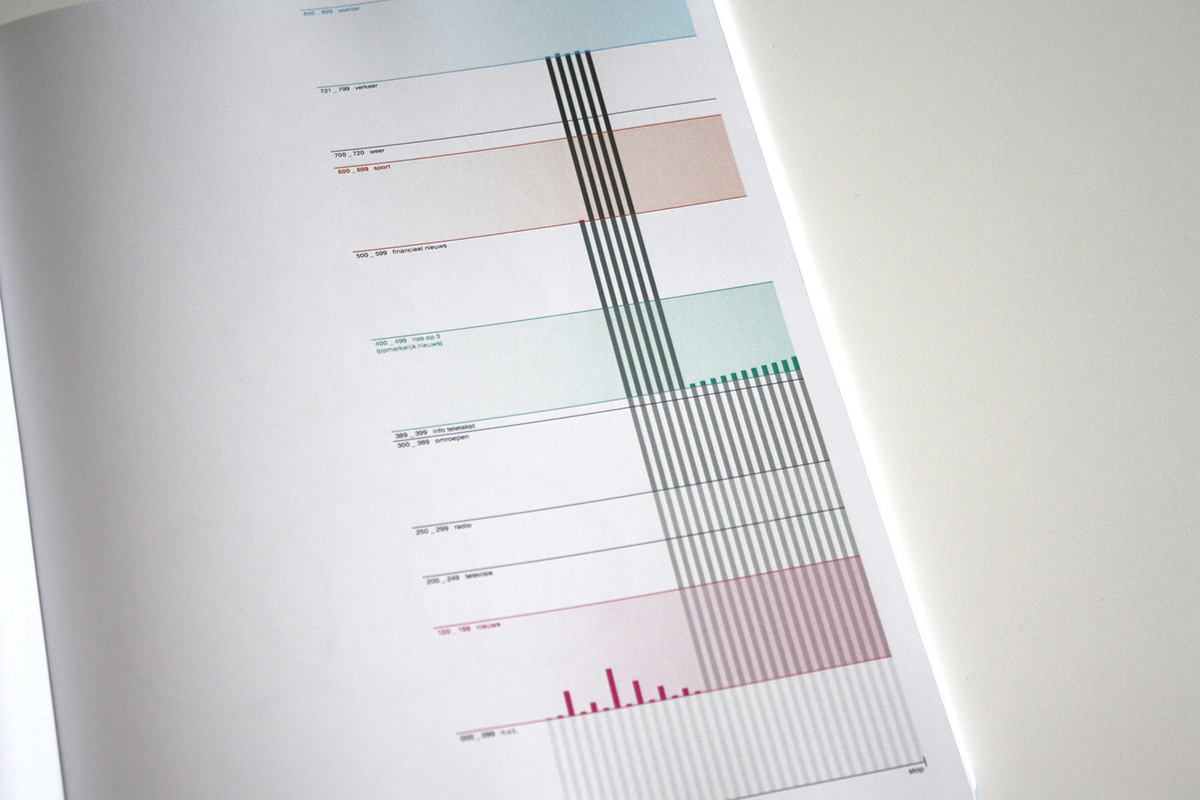
day 88: teletext (detail)
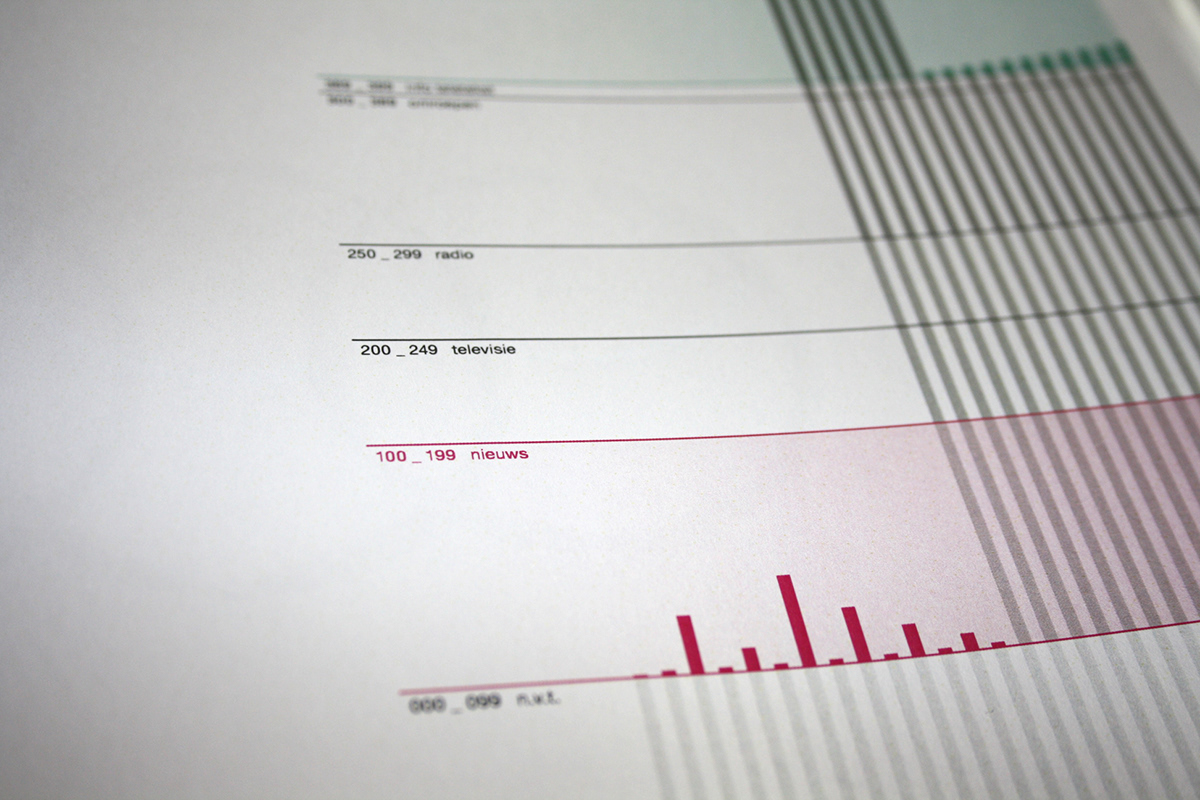
day 88: teletext (detail 2)
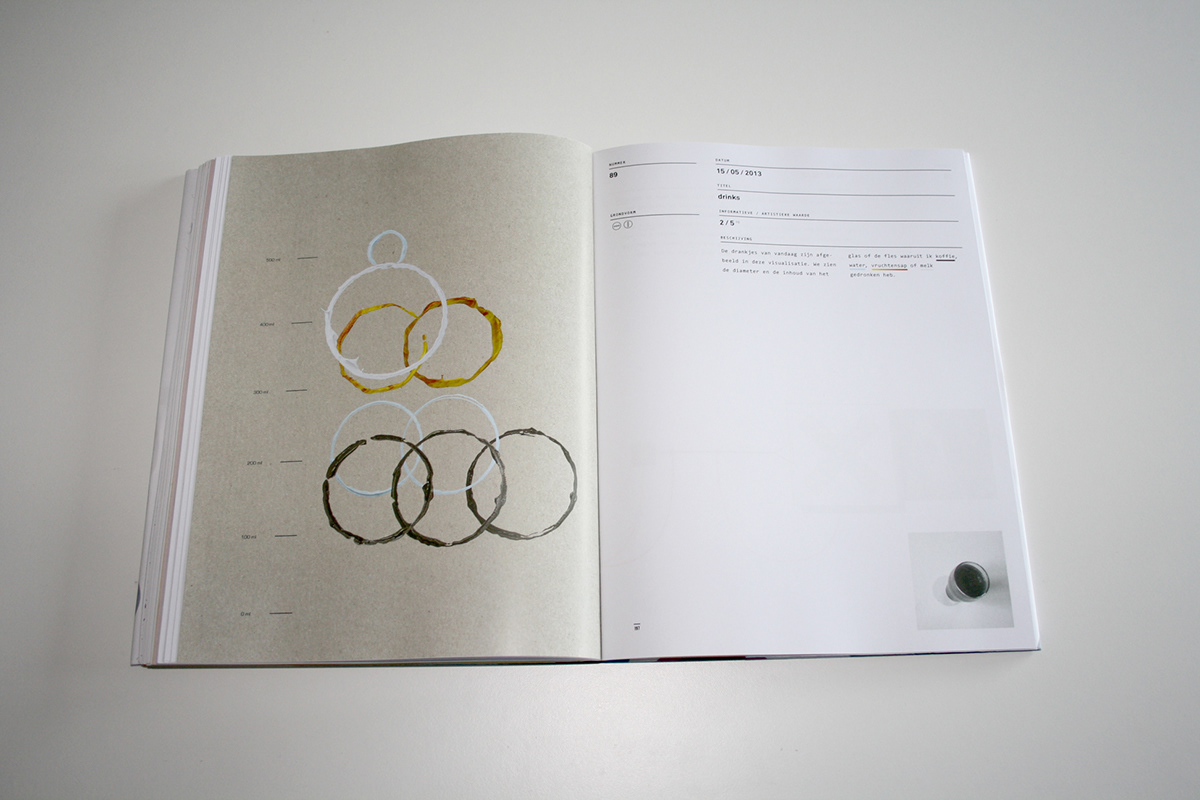
day 89: drinks
day 89: drinks (detail)
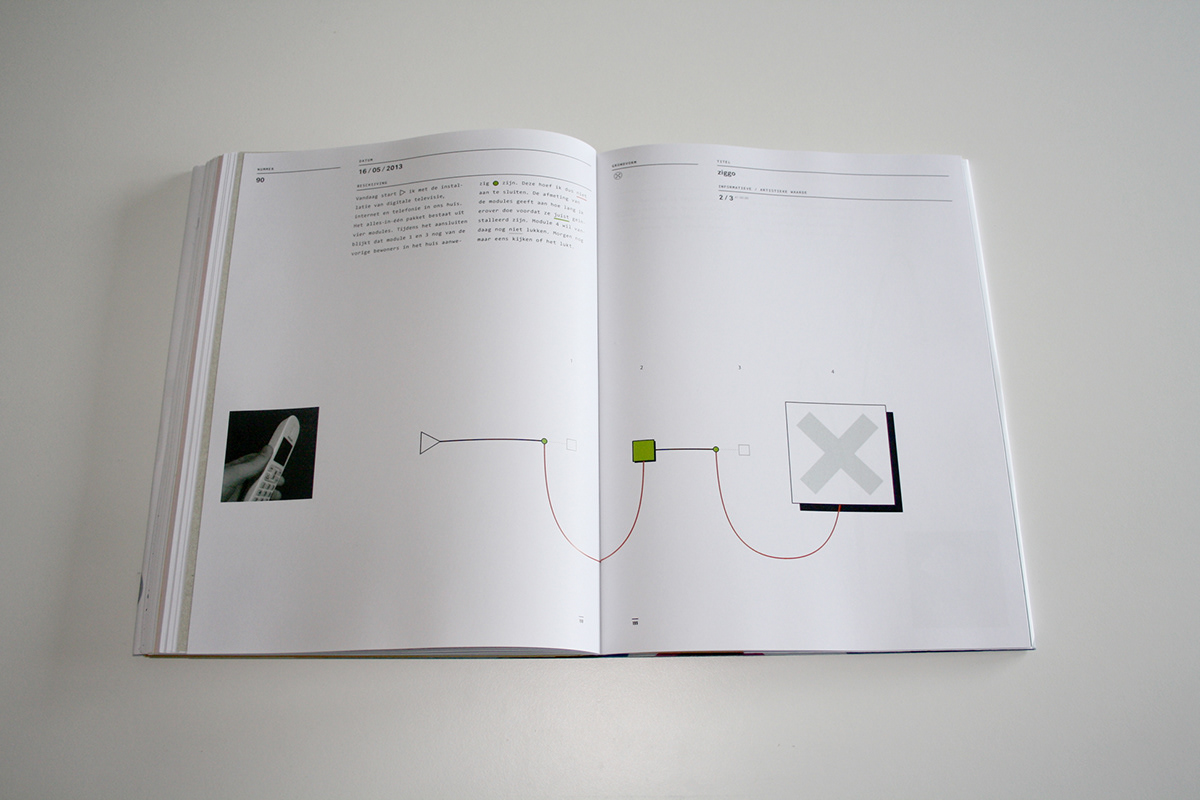
day 90: ziggo
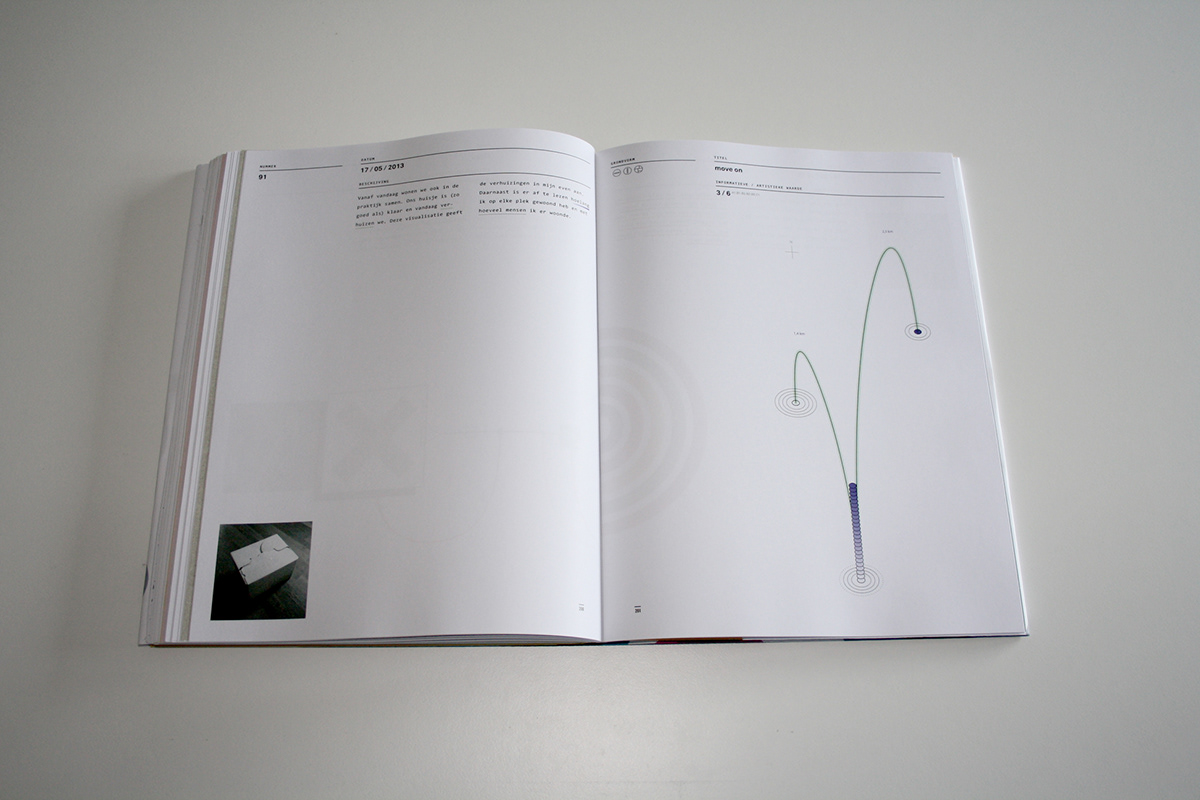
day 91: move on
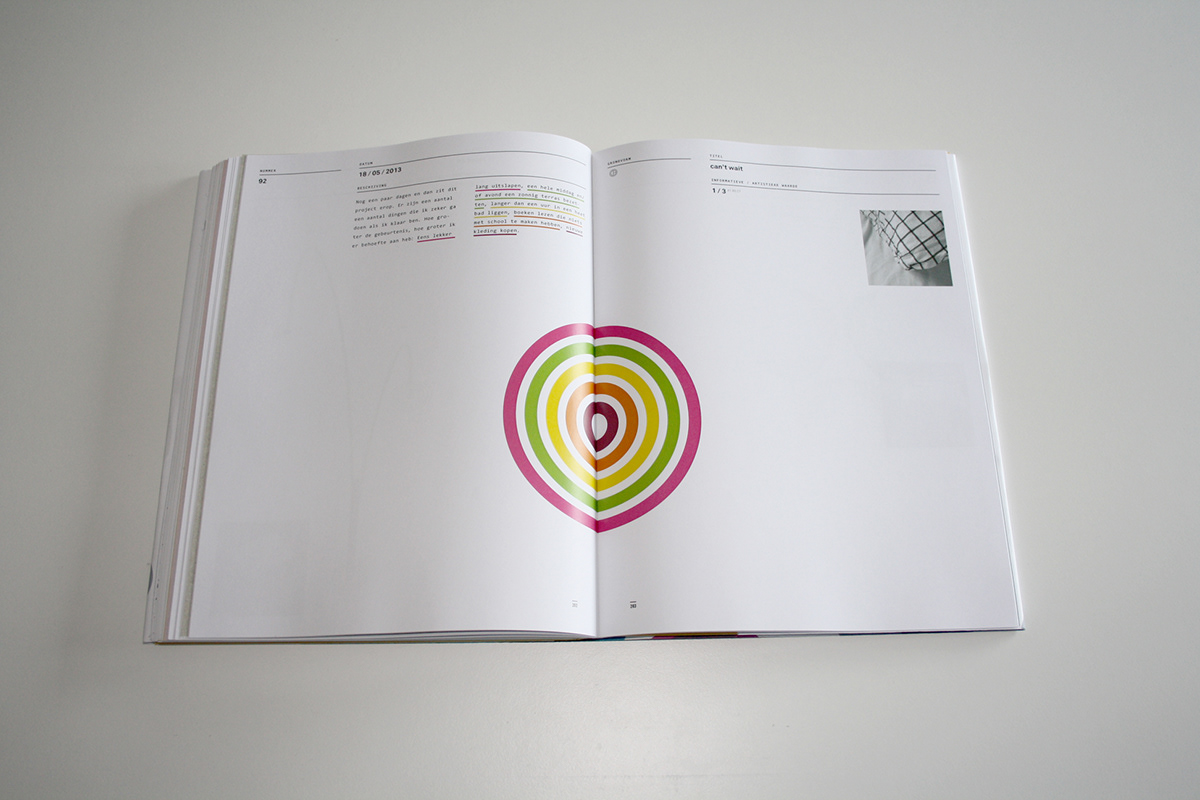
day 92: can't wait
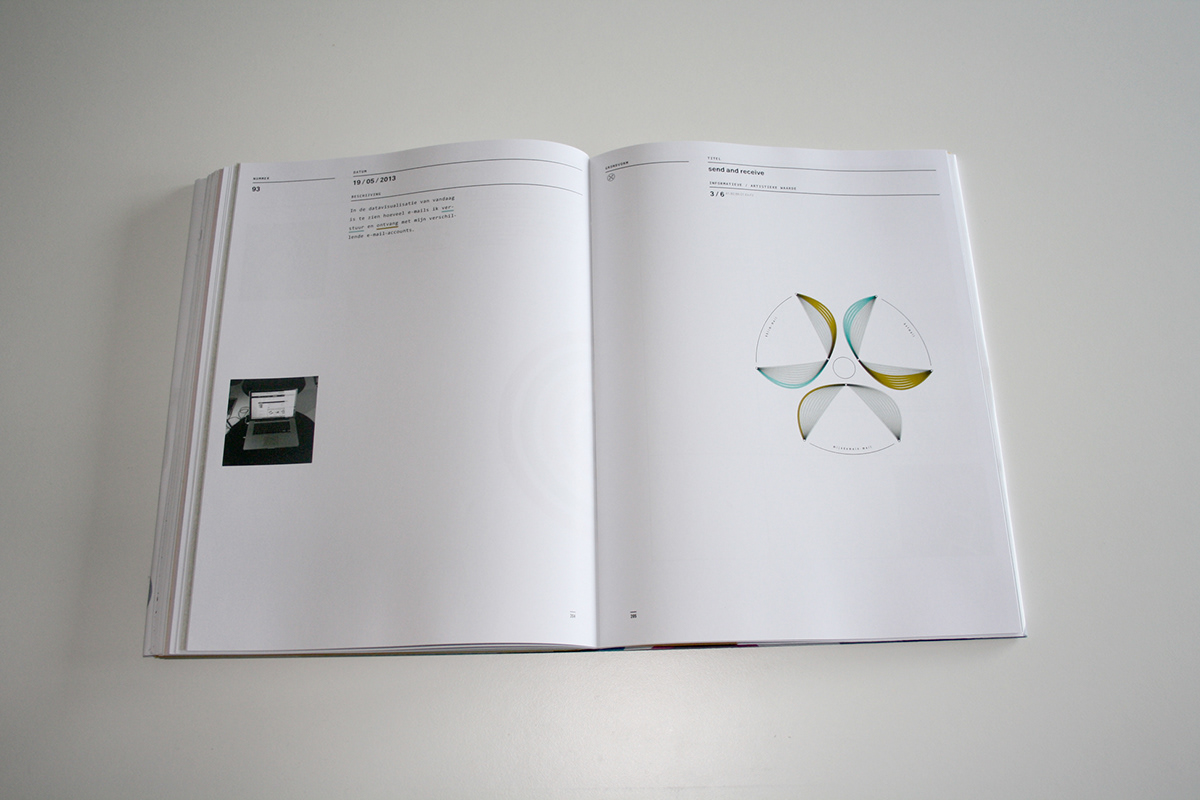
day 93: send and receive
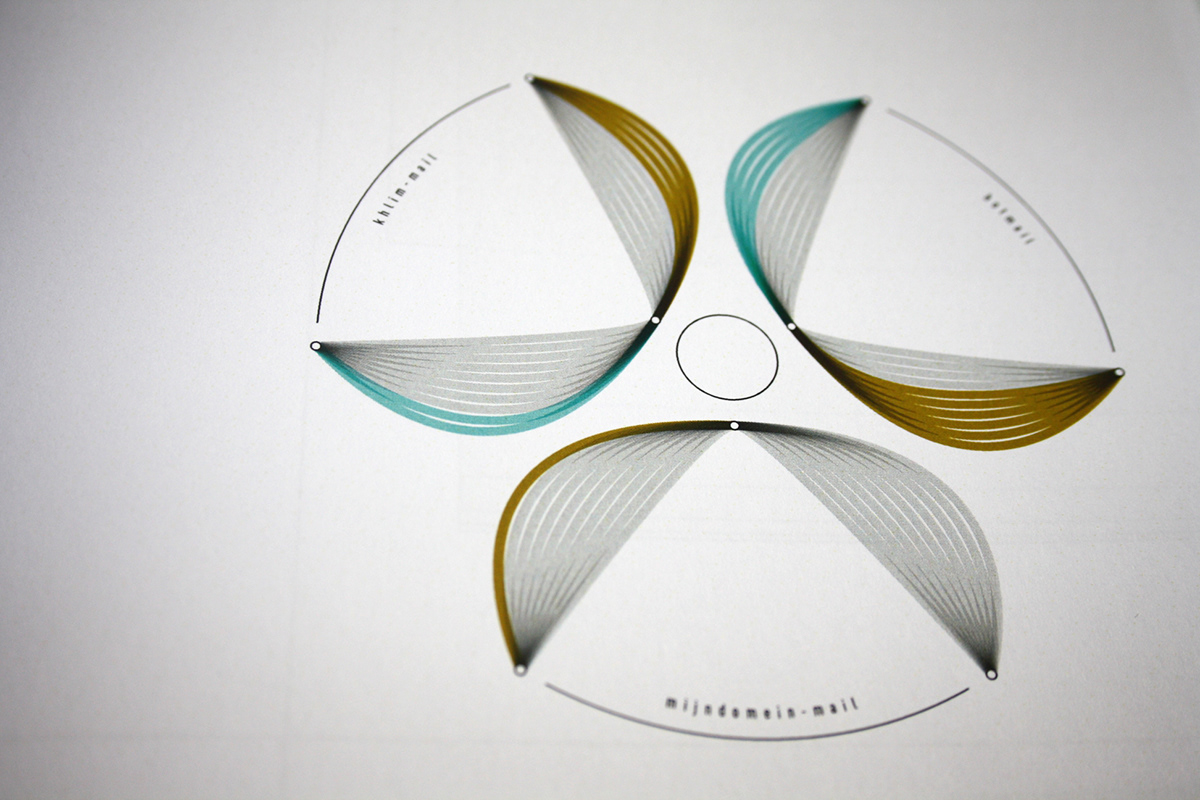
day 93: send and receive (detail)
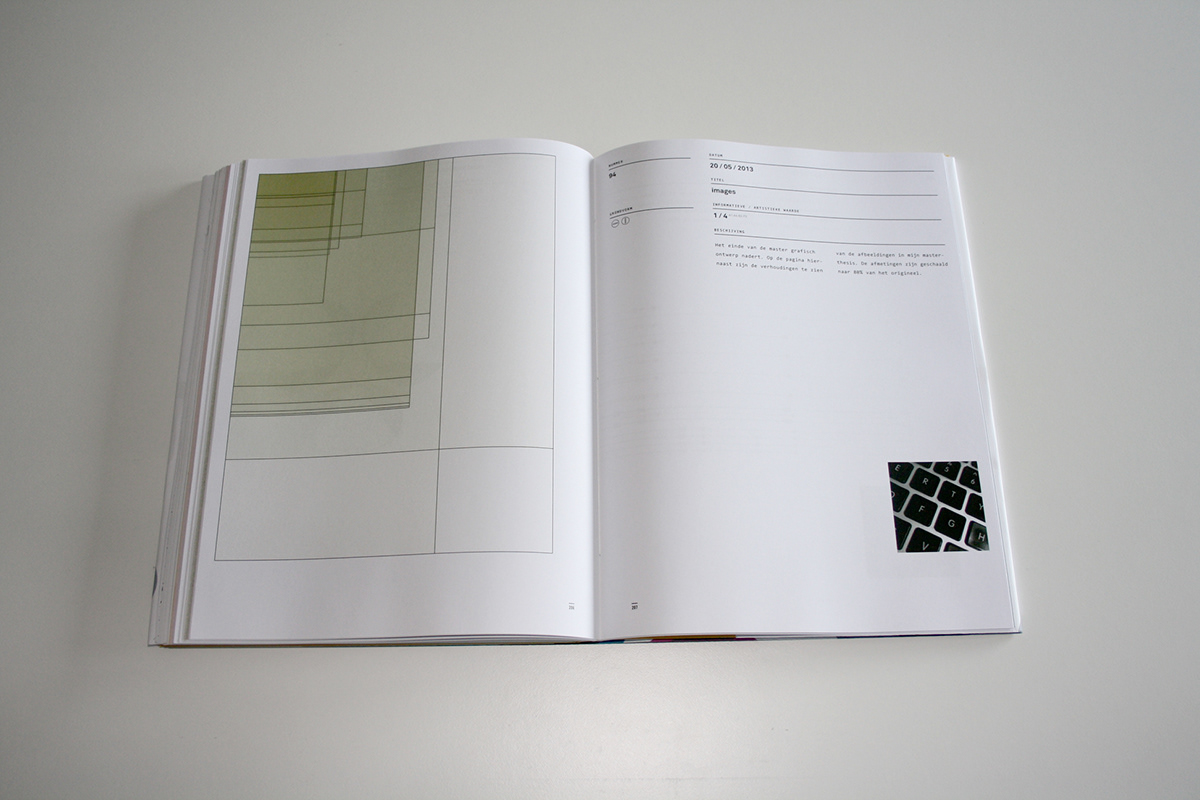
day 94: images
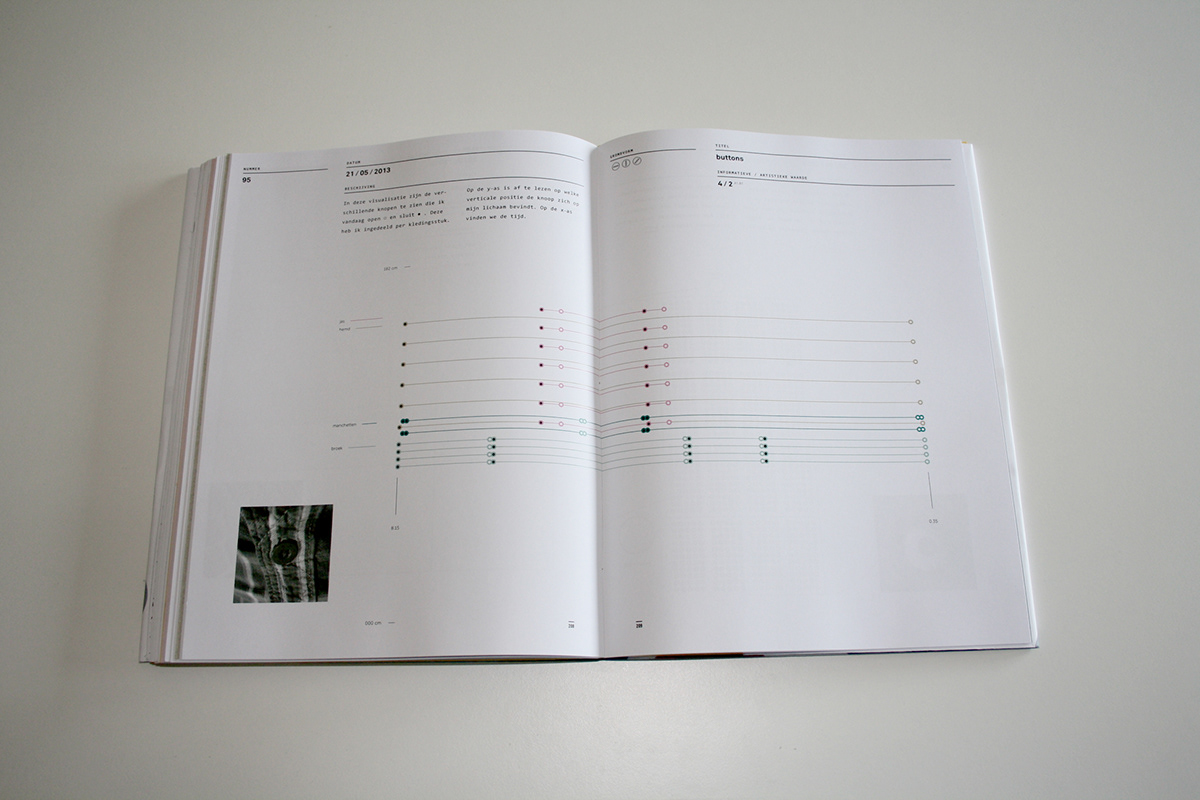
day 95: buttons
day 95: buttons (detail)
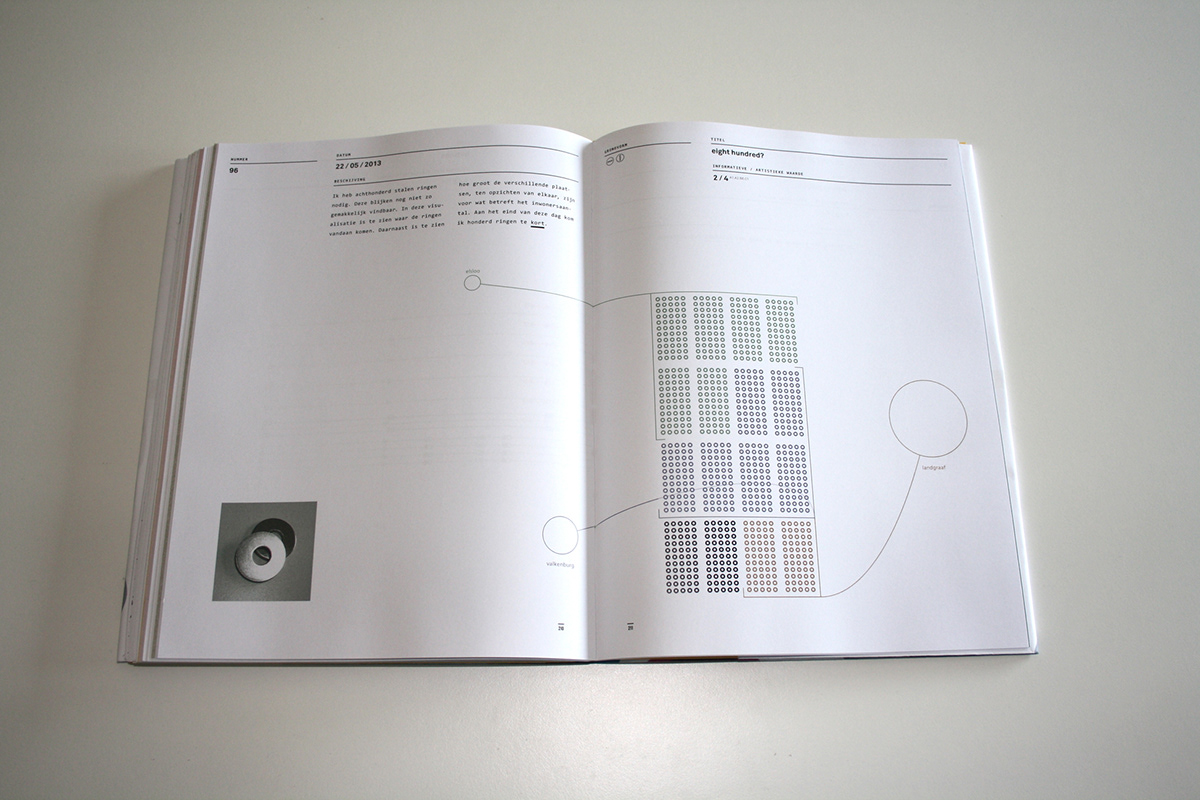
day 96: eight hundred?
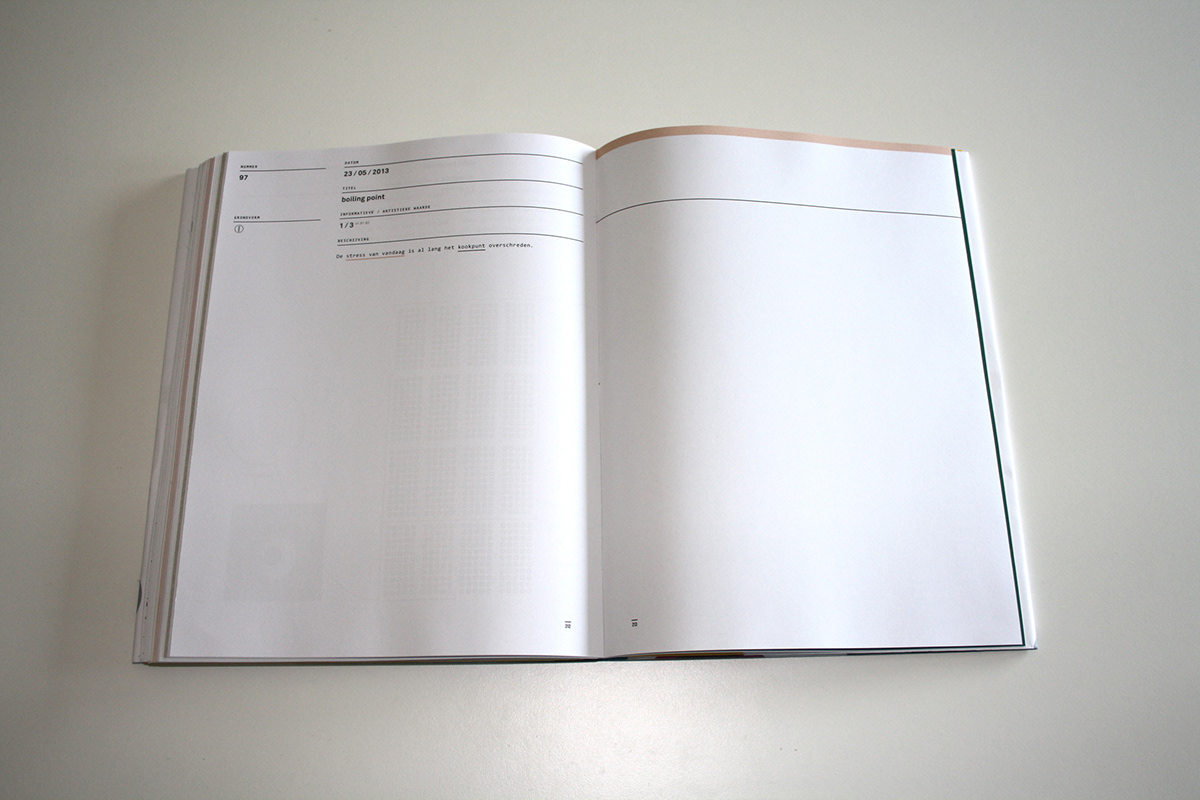
day 97: boiling point
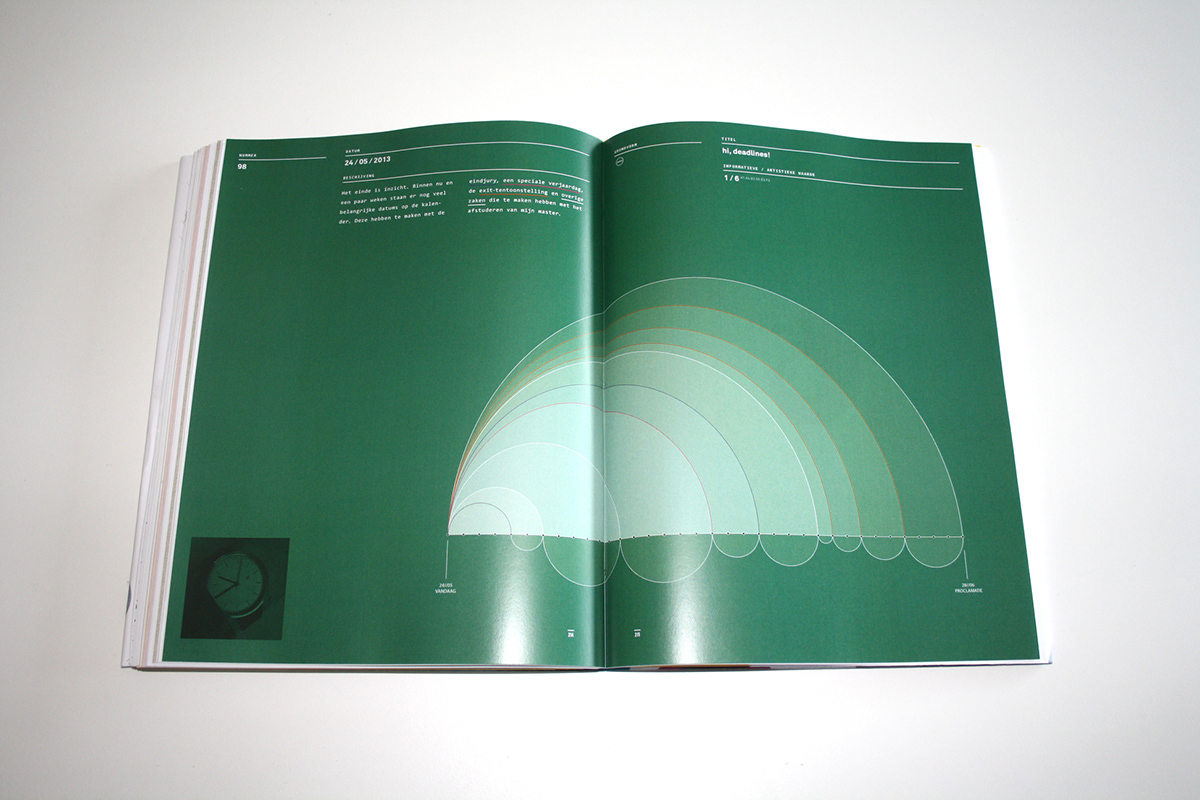
day 98: hi, deadlines!
day 98: hi, deadlines! (detail)
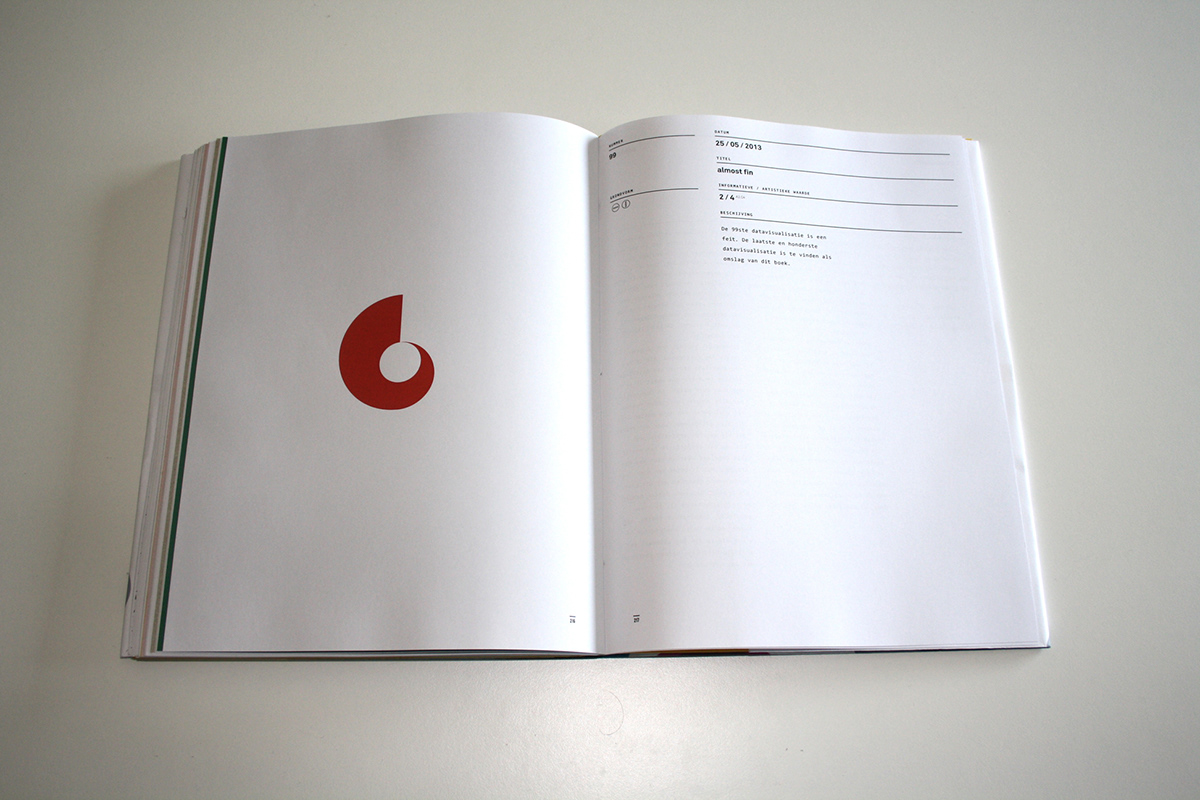
day 99: almost fin
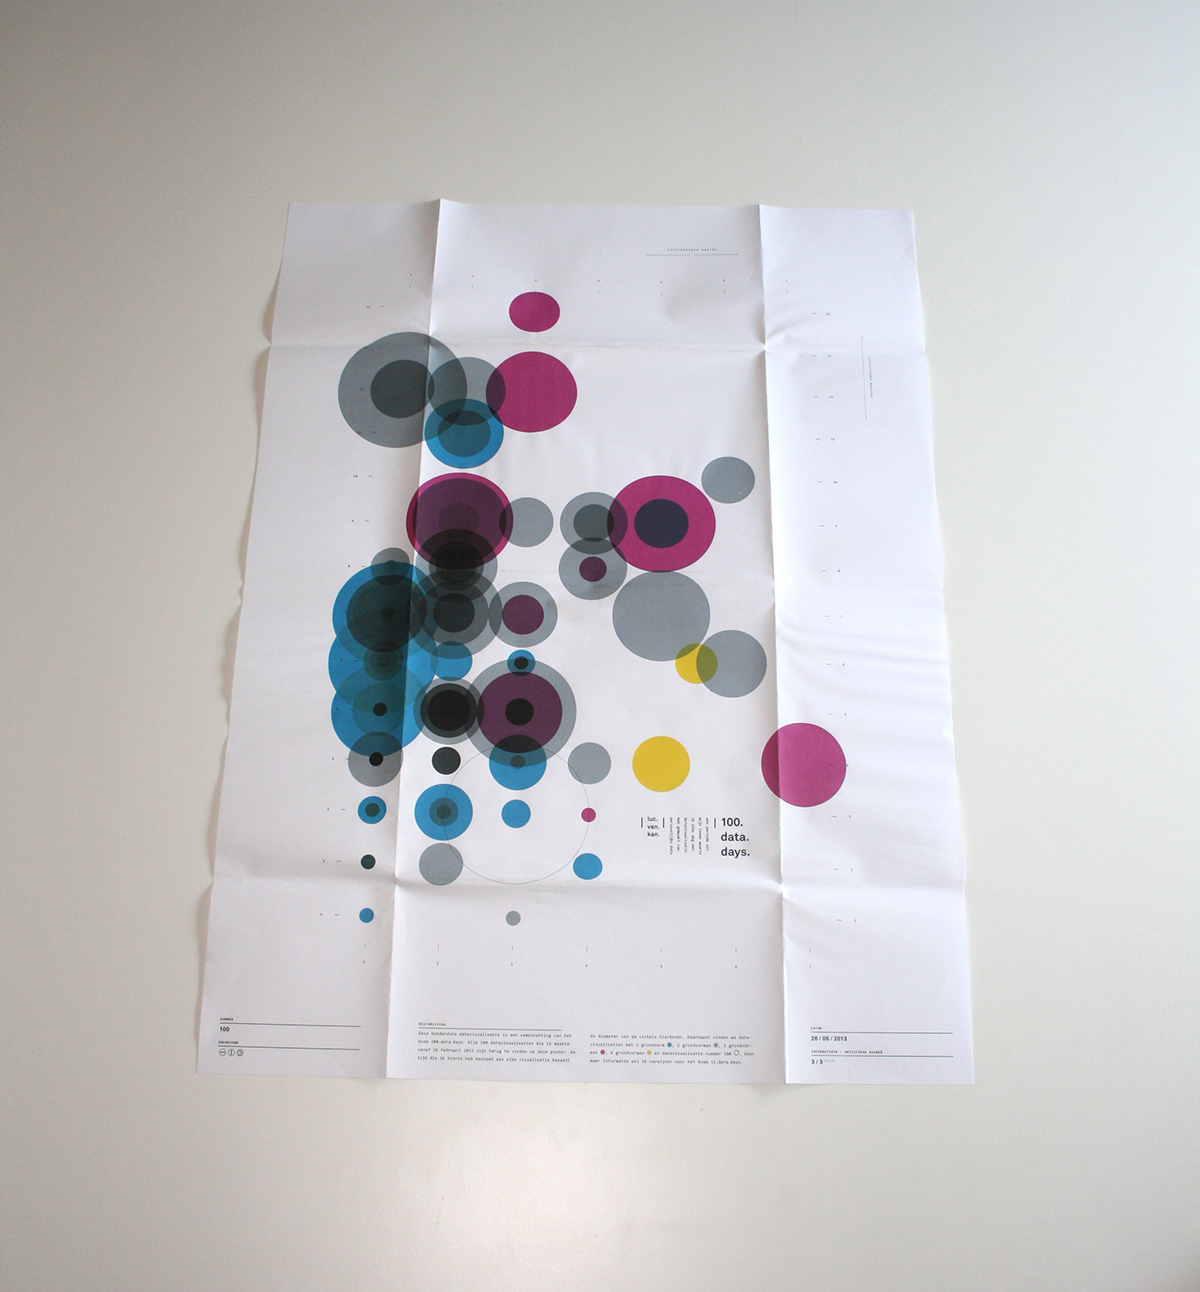
day 100: all visualisations (book cover)