
This project, Anatomizing Science-Fiction, is the intersection of my personal collection of sci-fi literature and an assortment of infographic design and data visualization. Among the following works are exercises in Data Humanism, qualitative data extraction, and truthful incorporation of tools and materials.
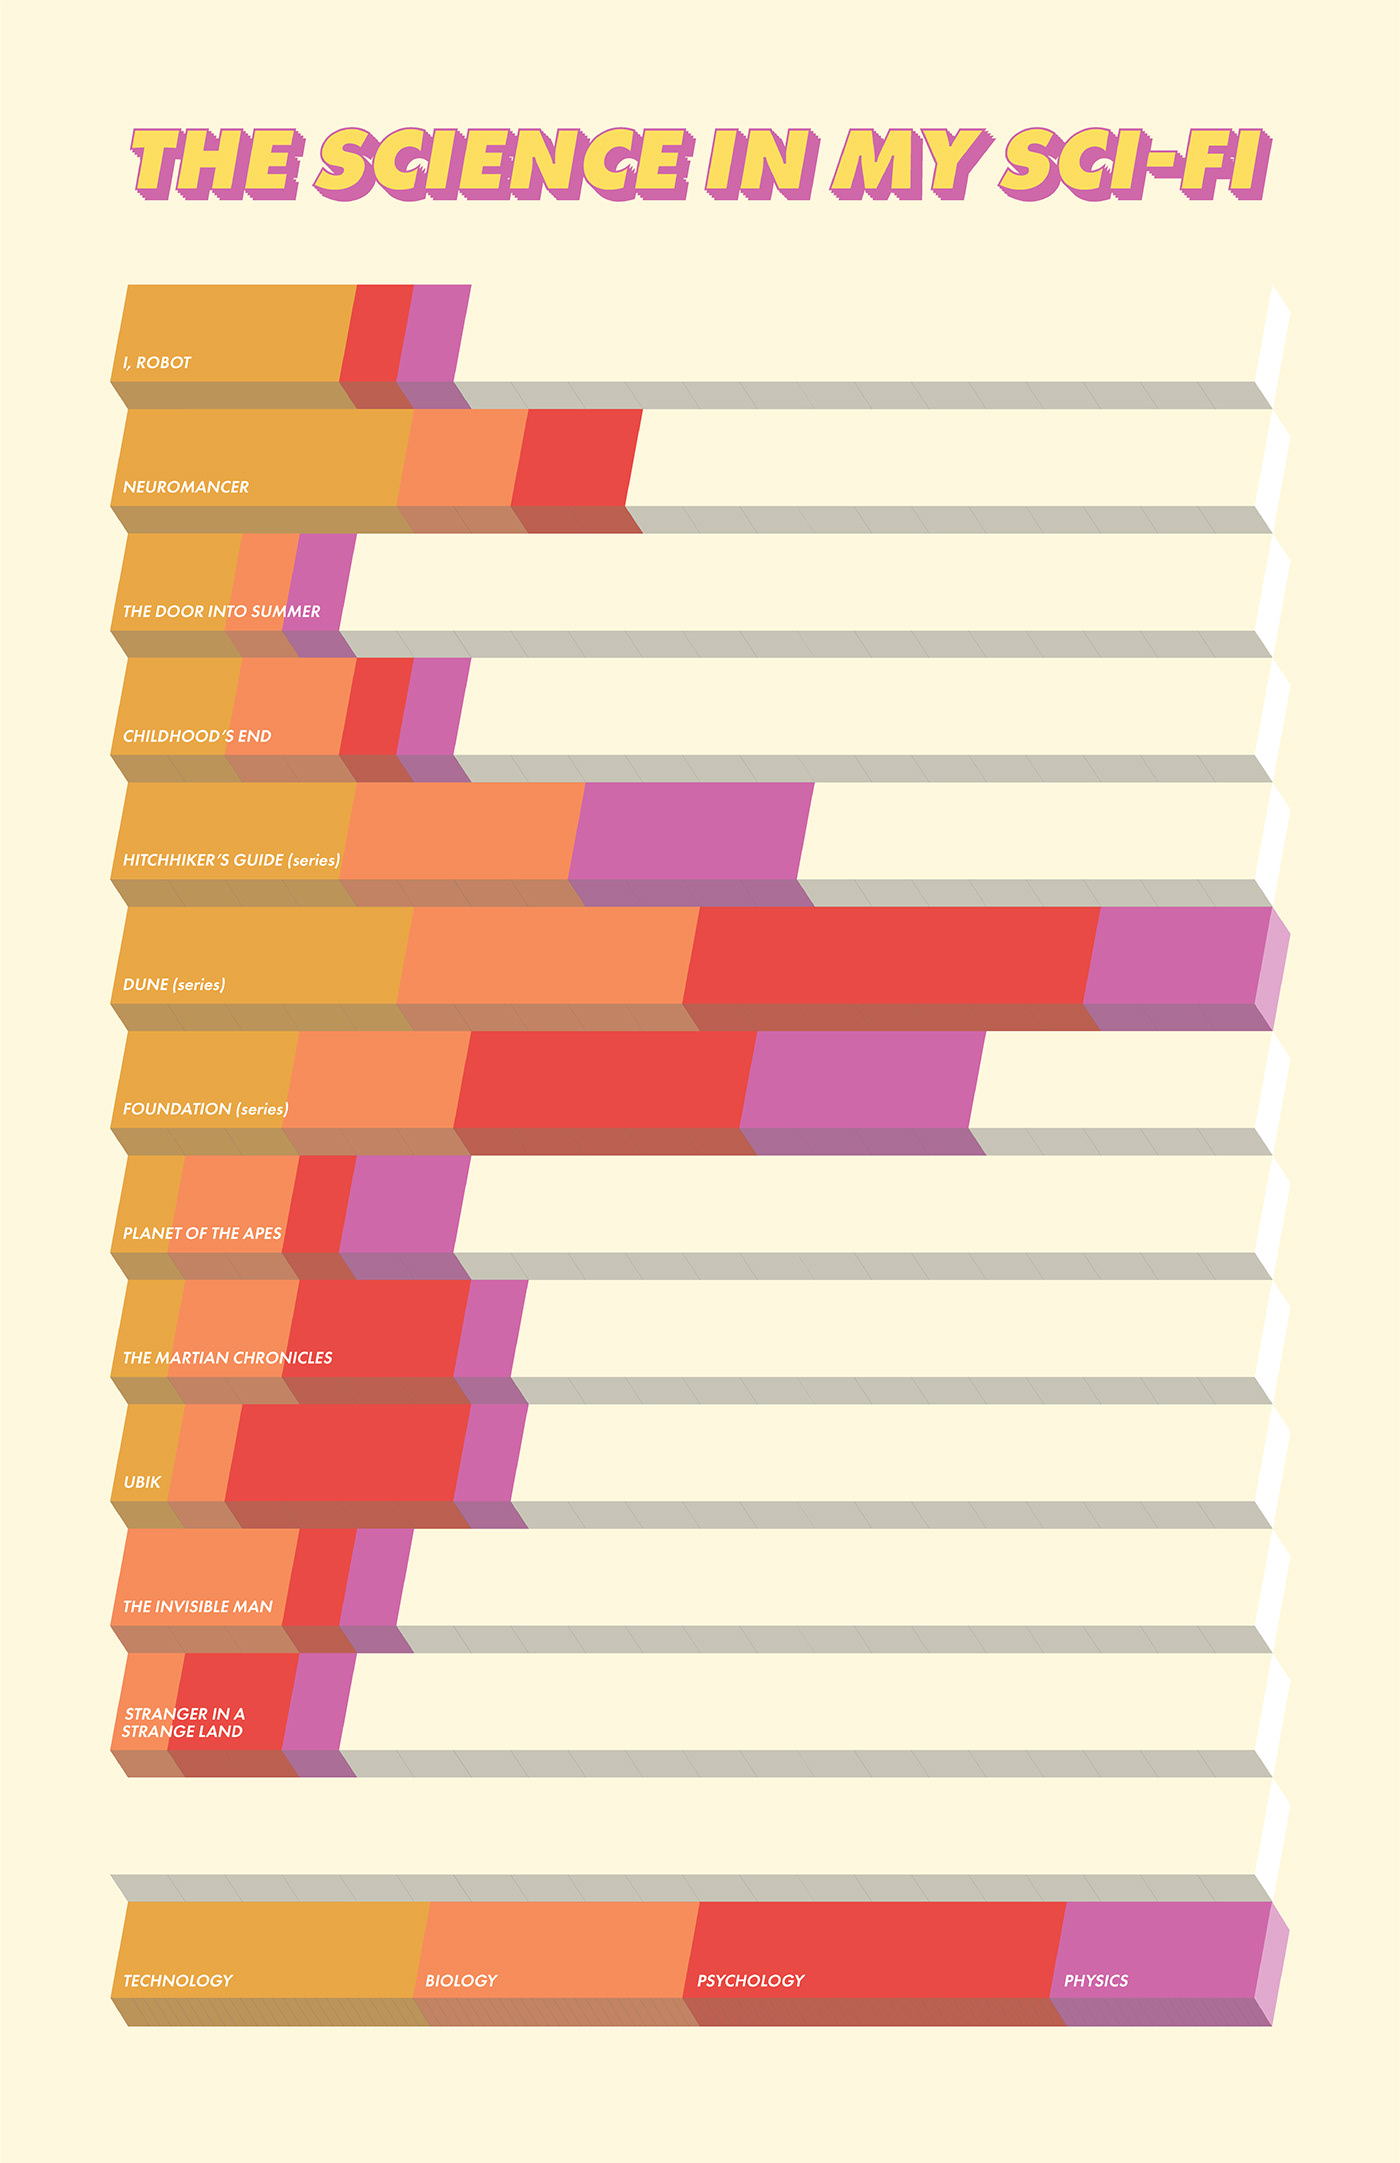
In The Science In My Science-Fiction I decided to hone in on the books I had read. For this I asked what makes these titles science-fiction? The answer was both simple and complex. Science, of course, but what kind? I listed as many science fiction concepts as I could find from each book and organized them into four categories: Technology, which included all manner of devices and weapons; Biology, including extraterrestrial life, directed evolution, and ecology; Psychology, meaning powers of the mind as well as artificial and virtual intelligence; And Physics, which included all the fundamental ideas of the universe which enable such things as faster than light travel, interplanetary colonization, time travel, parallel worlds or timelines and supernumerary dimensions.
The exercise that followed, A Chapter At A Time, was very much connected to the previous one. I was still looking at the same subset of books that I had read. I was also reading multiple books in my spare time and one thing I noticed was that reading a chapter at a time is easier for some authors than it is for others. At this time I was also looking at different types of data visualizations and I came across an exploded view and wondered what that would look like for a book. The result, I assert is an exploded view while I acquiesce still appears to be a bar graph.


