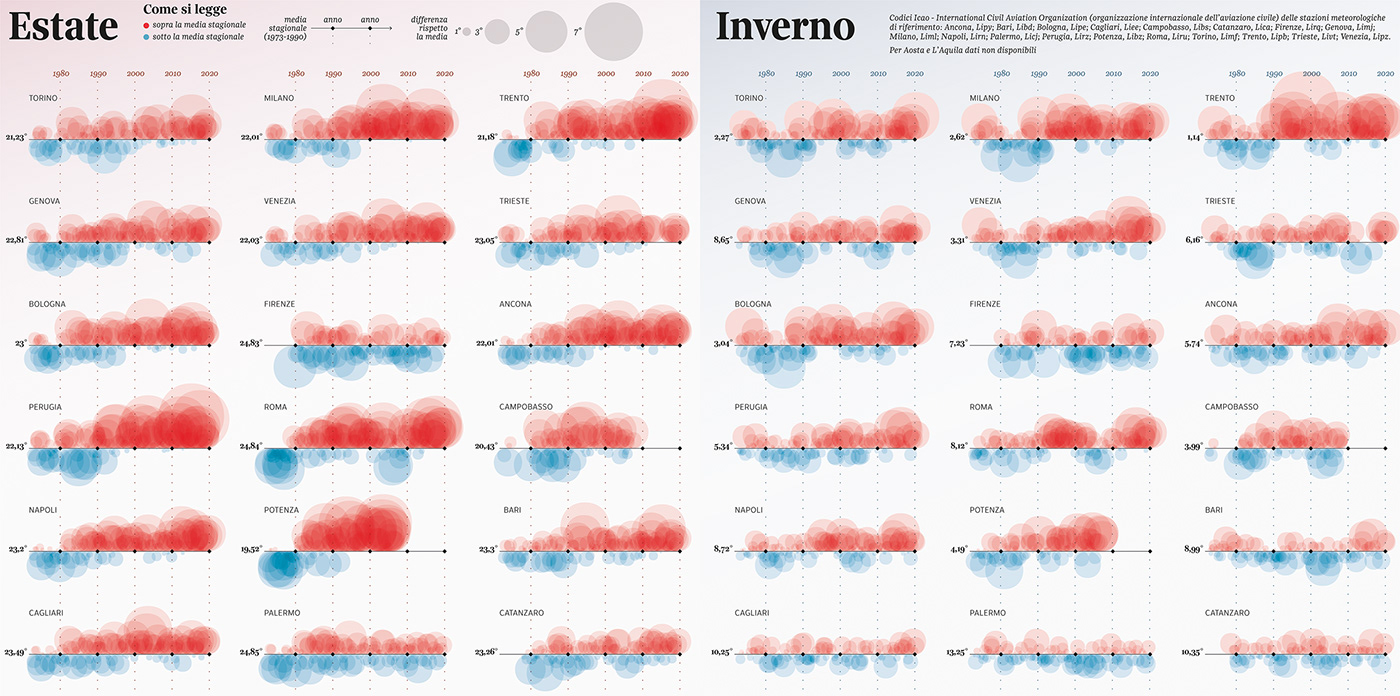
Summer and Winter
The visualization shows the average seasonal temperatures in Italy from 1973 to today. For each capital, there are the monthly averages in summer (June, July, August) and winter (December, January, February) and the deviation from the seasonal average calculated on temperatures up to 1990: in red above the average, in blue below the average.
Visualization by Michela Lazzaroni for La Lettura#435, Corriere della Sera.
Published 29th March 2020.