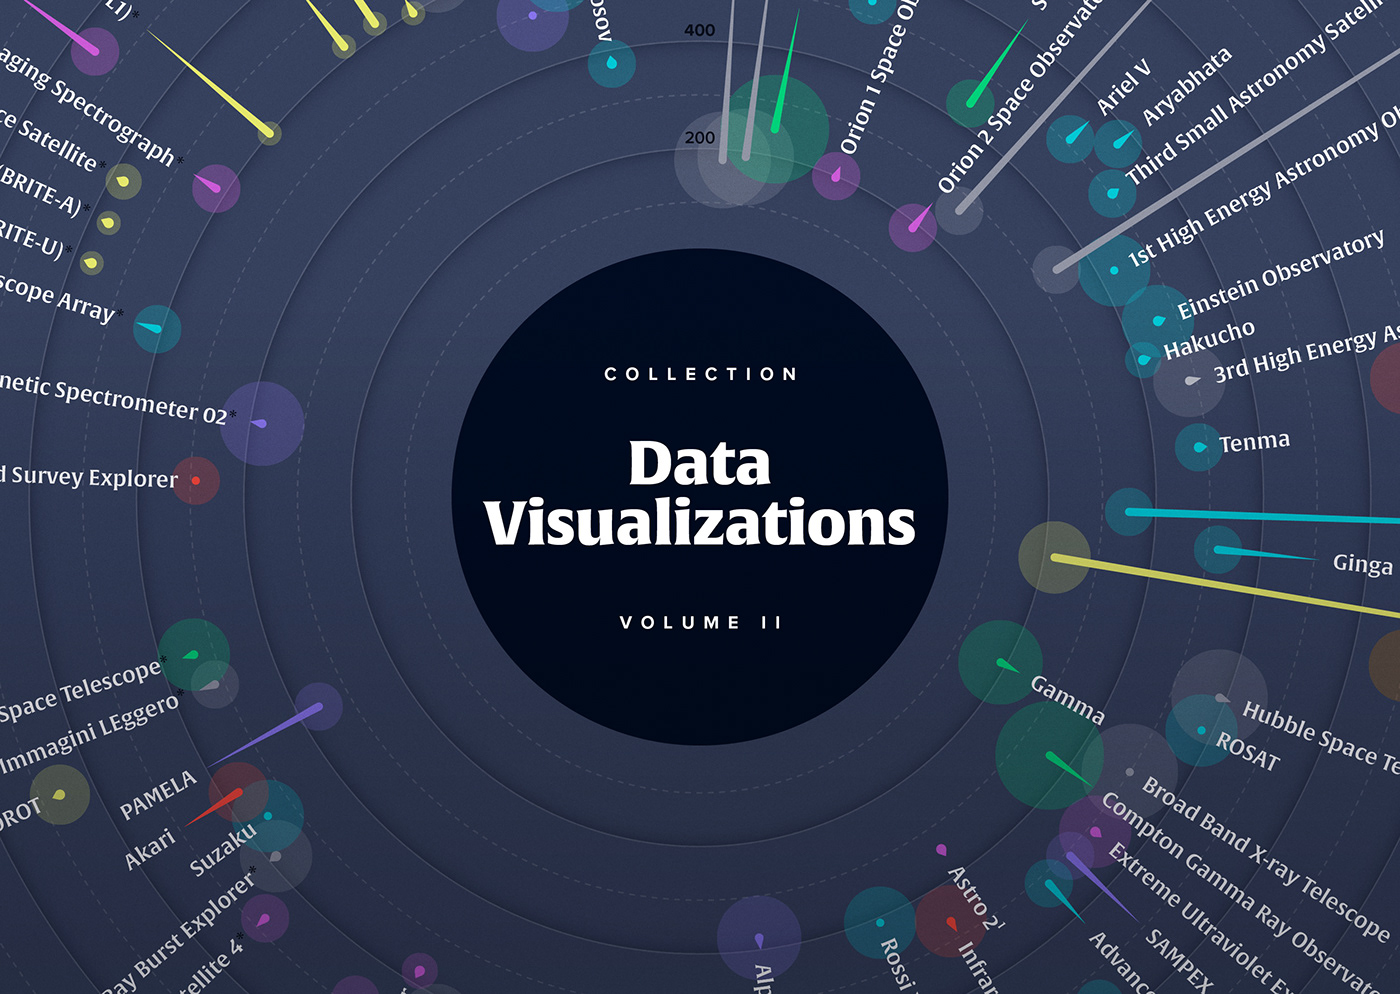
Data Visualization Collection / Vol. 2
–––––
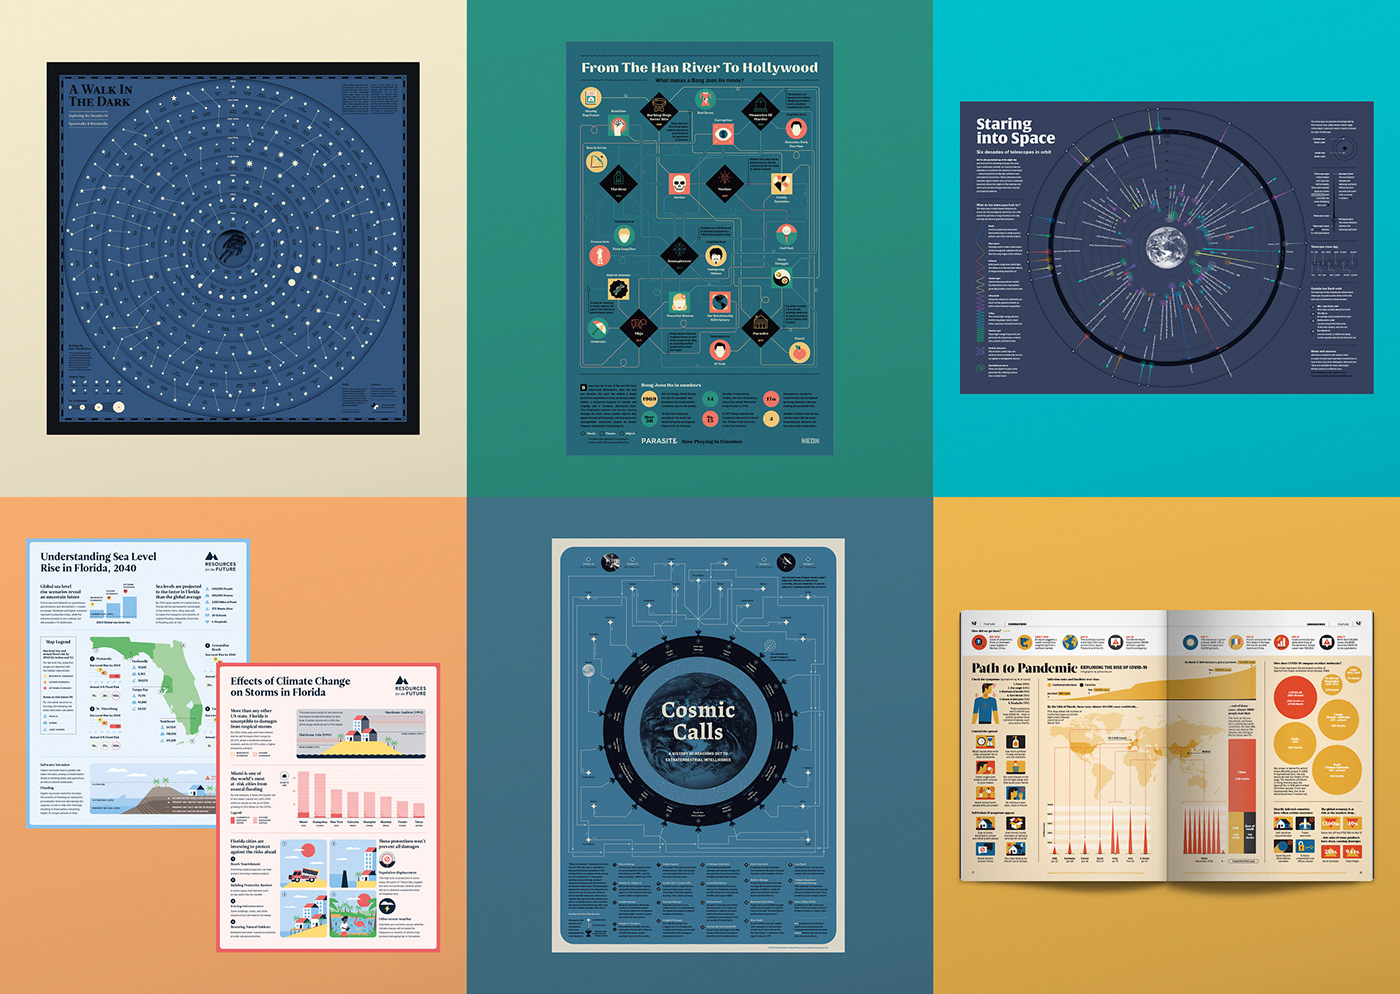
Another selection of my favourite data visualization projects from the past year.
About a year ago I posted a selection of my data visualizations, and was thrilled with the response. It resulted in some great exposure for my work and enabled me to move my freelance work more into the world of data visualization. Since then I've worked on more personal projects (with a strong space theme!), collaborated with some amazing clients on a variety of data driven projects, and had more work recognised in the Information is Beautiful Awards.
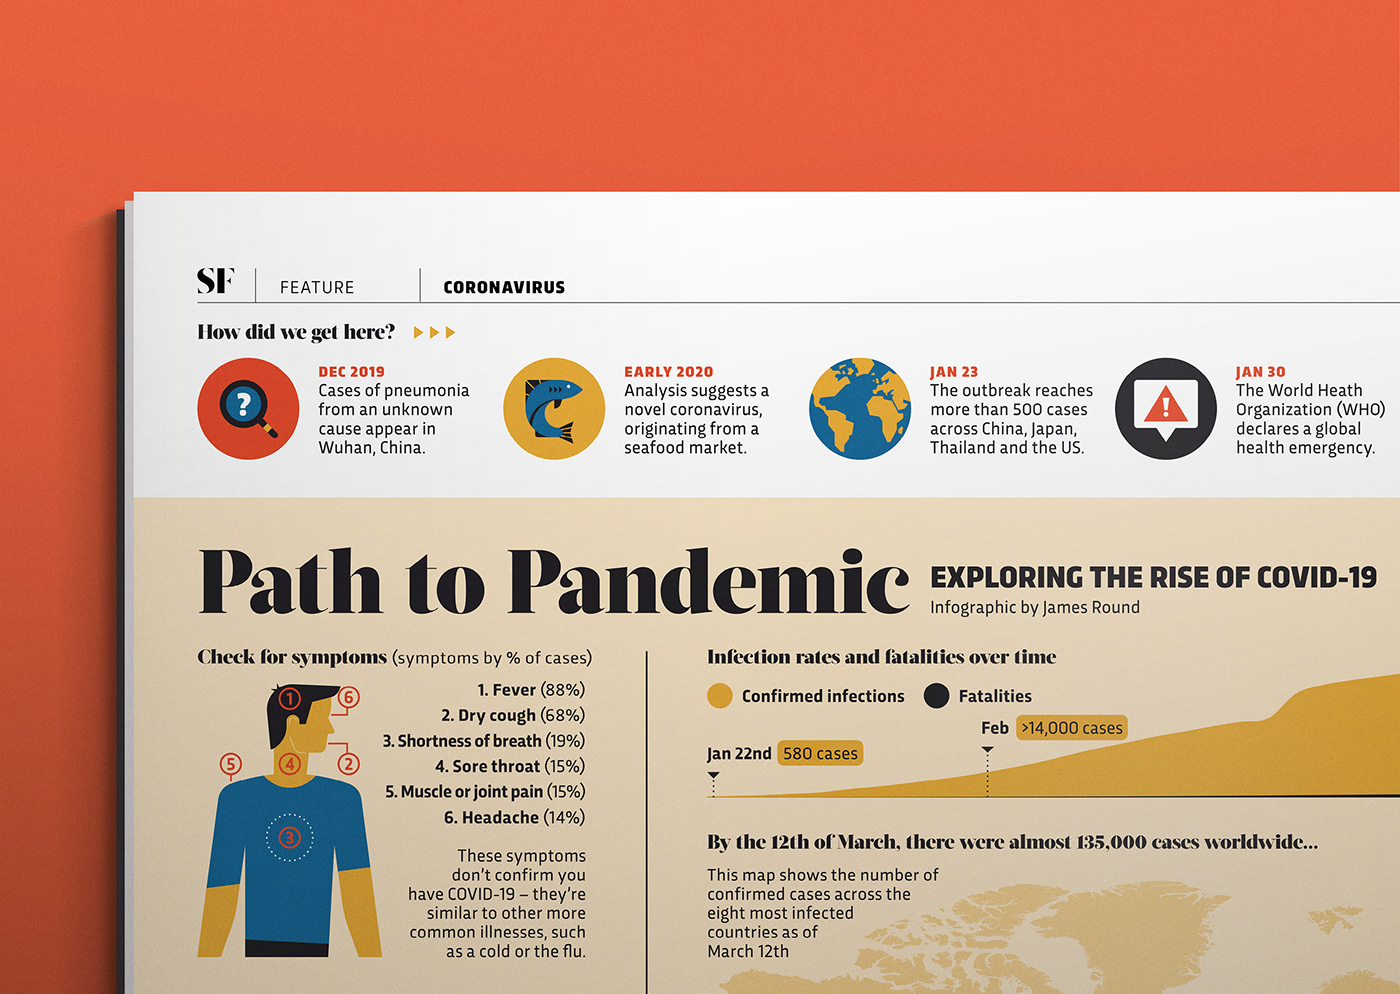
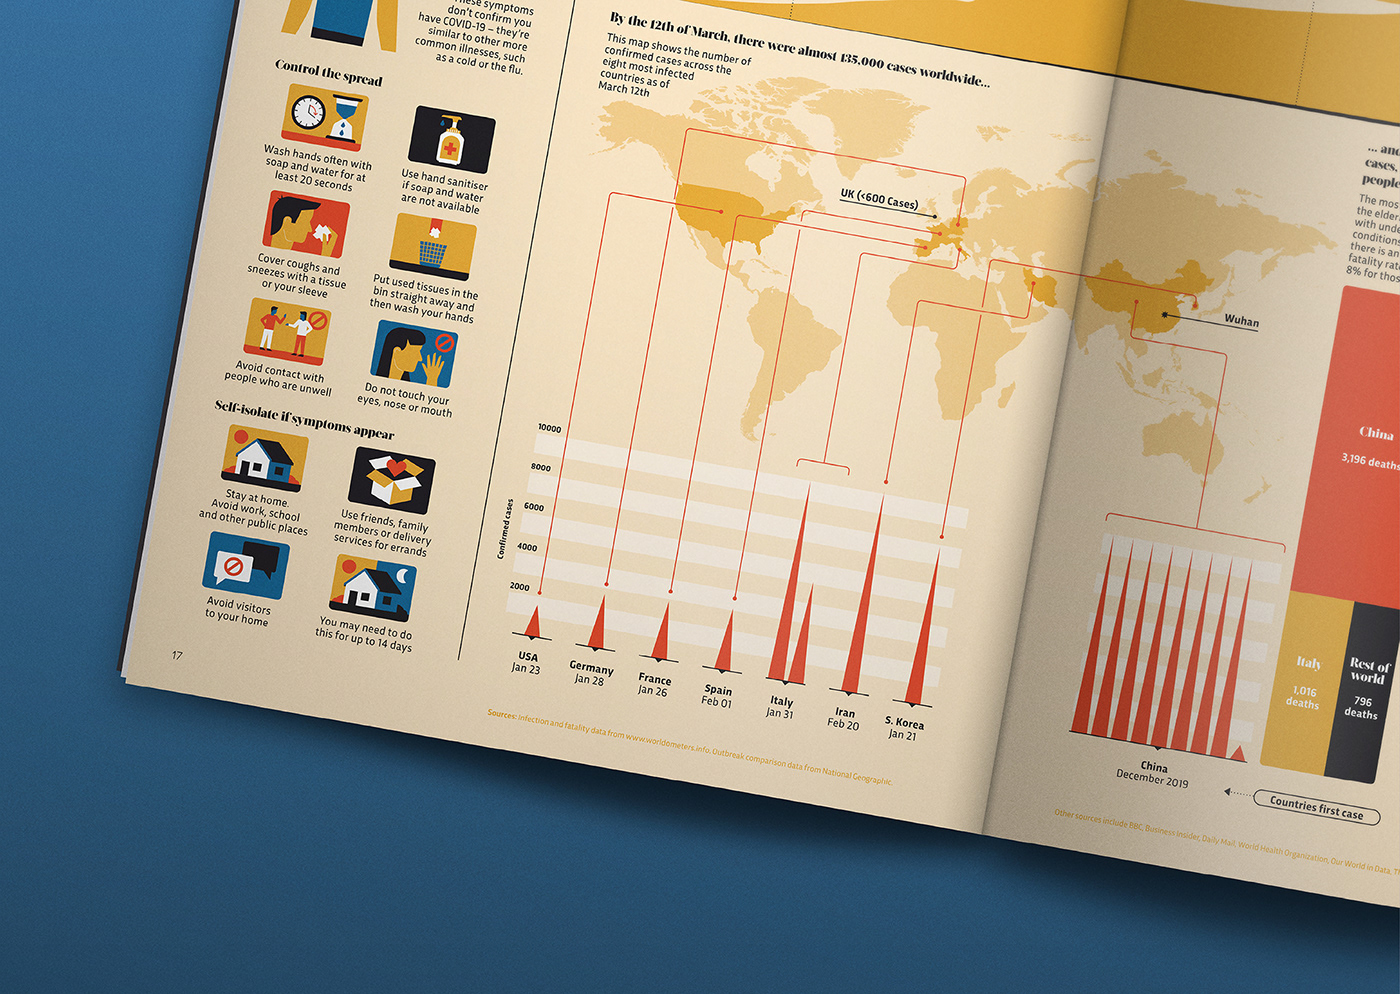
Below are some of my favourite projects from the last year, featuring a mixture of client work and personal projects. These include a history of space walks, an exploration of the rise of coronavirus, a look at the work of Oscar winning director Bong Joon Ho and a exploration of humanities attempts at reaching out to aliens.
You can see my Data Visualization Vol. 1 collection here.
See you next year for Vol. 3!
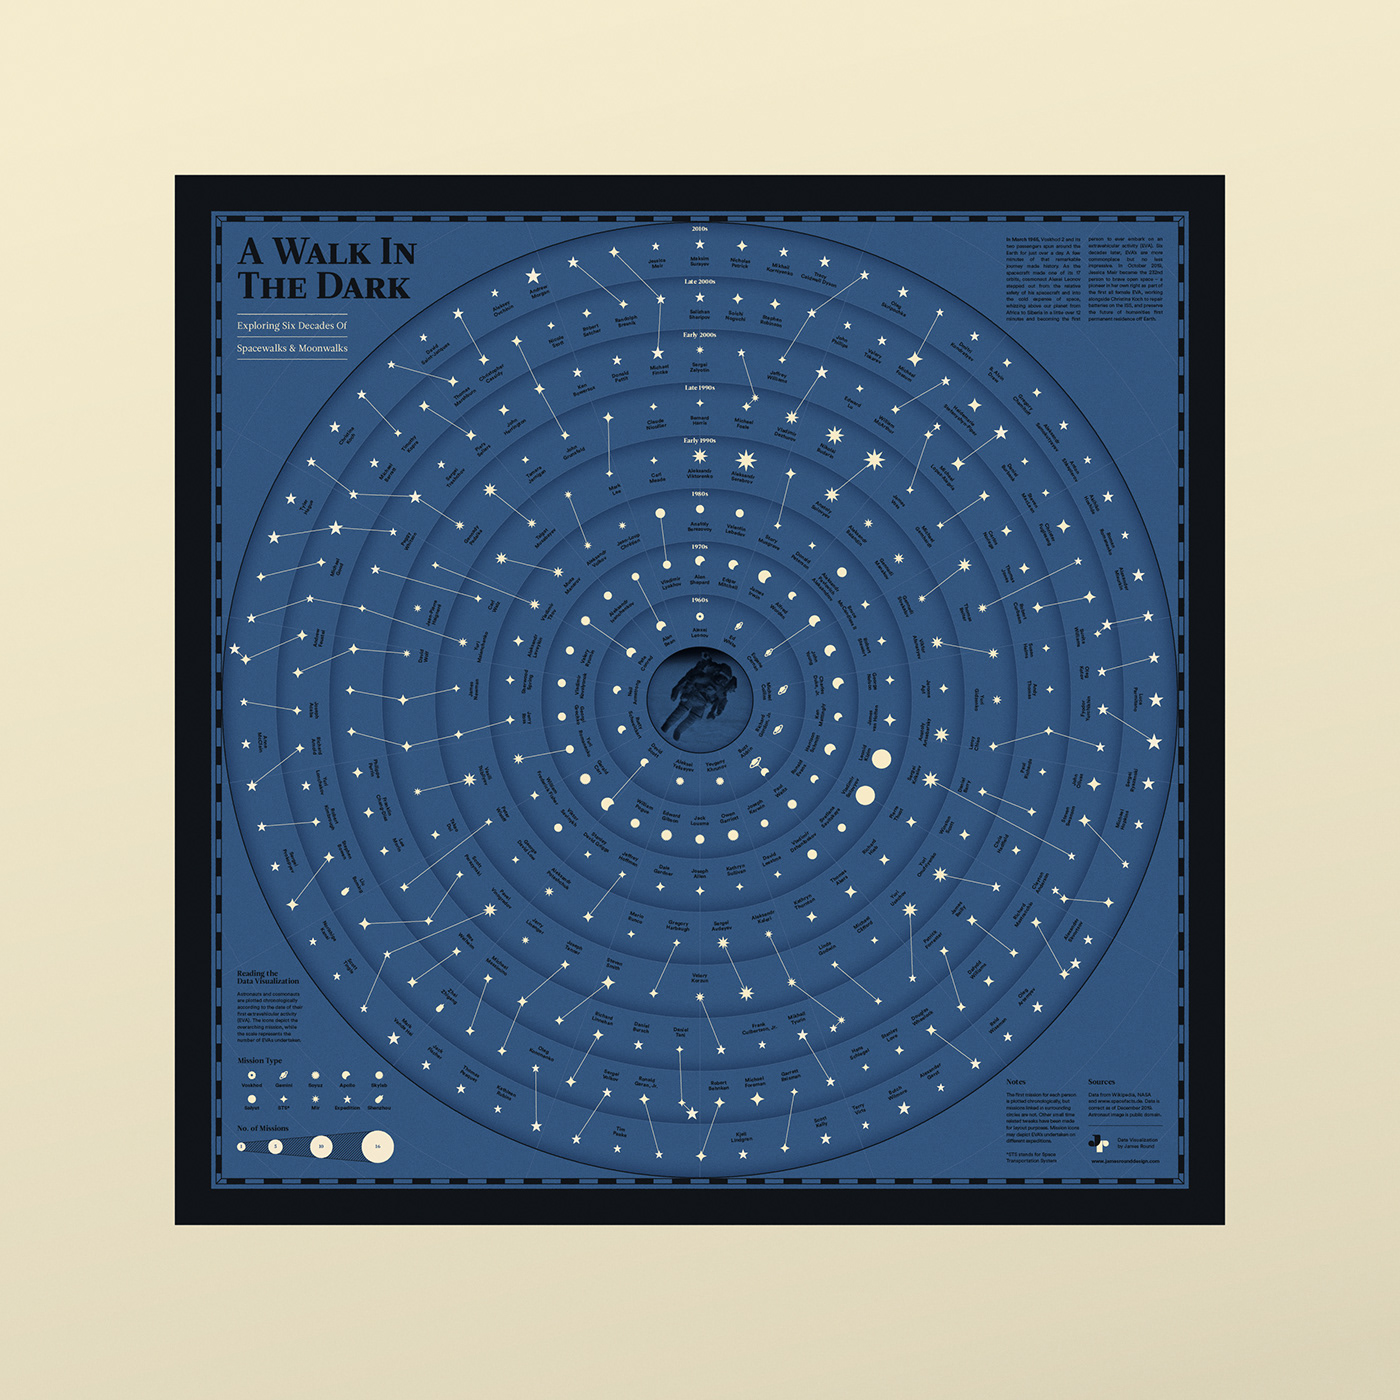
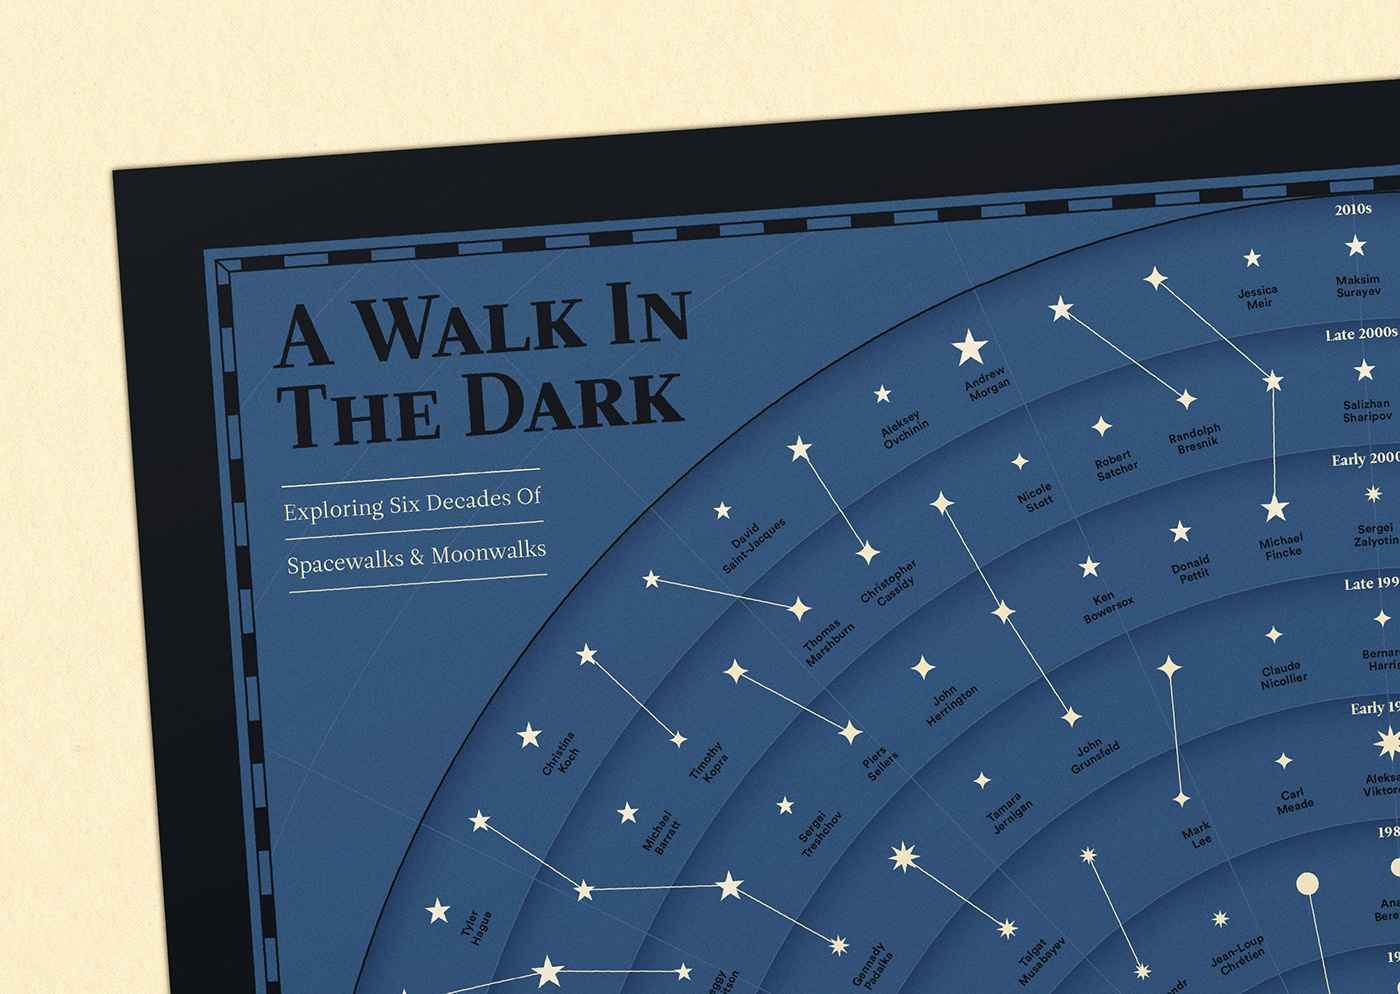
No. 1 / A Walk in the Dark
–––––
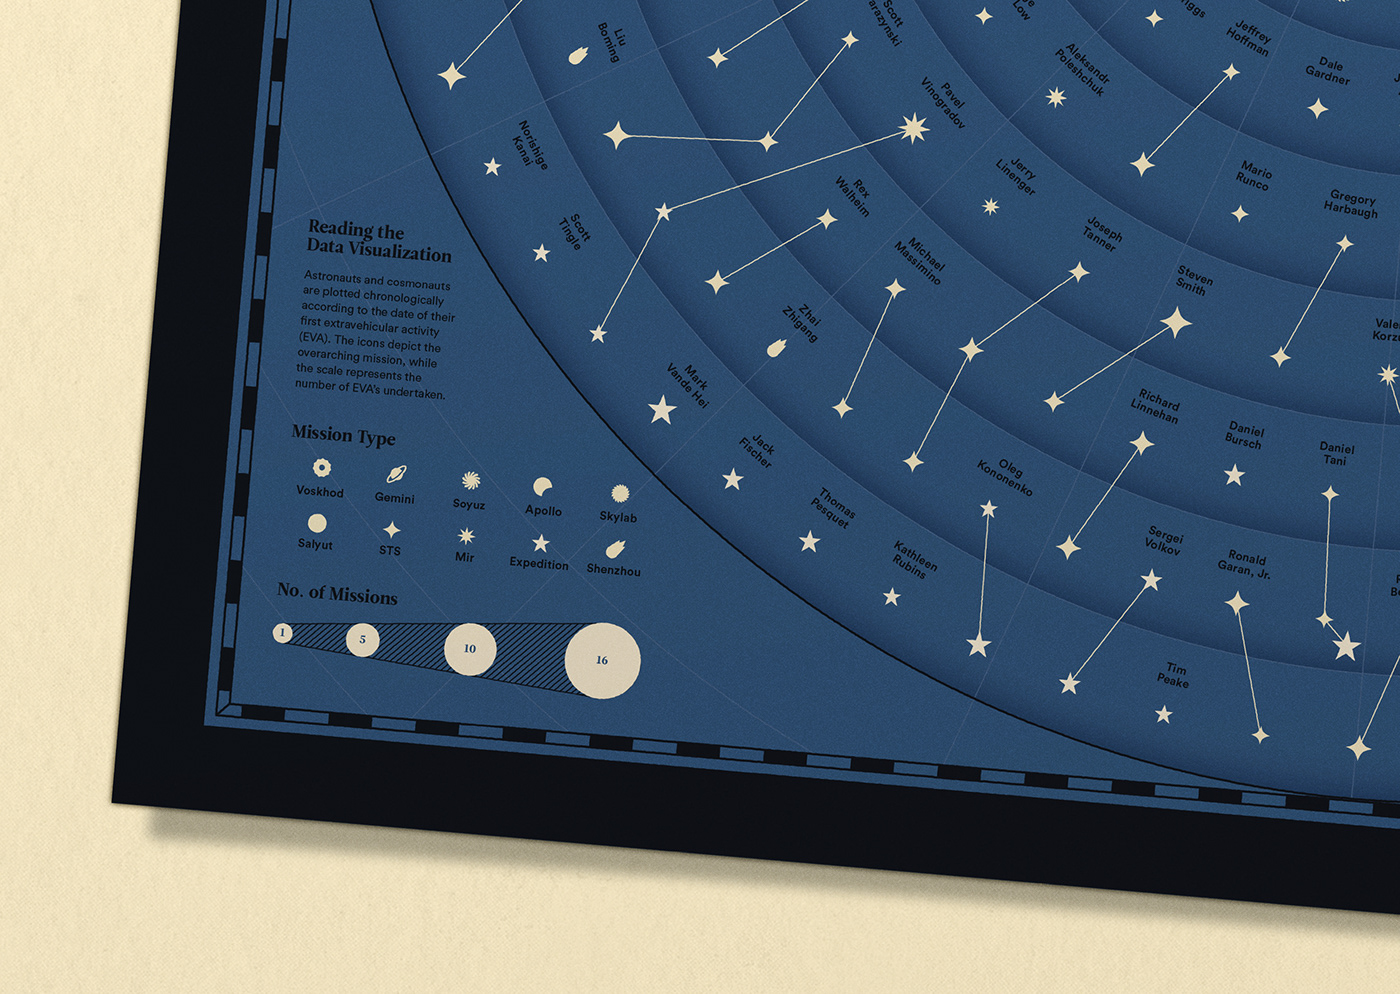
A data visualization exploring six decades of spacewalks and moonwalks.


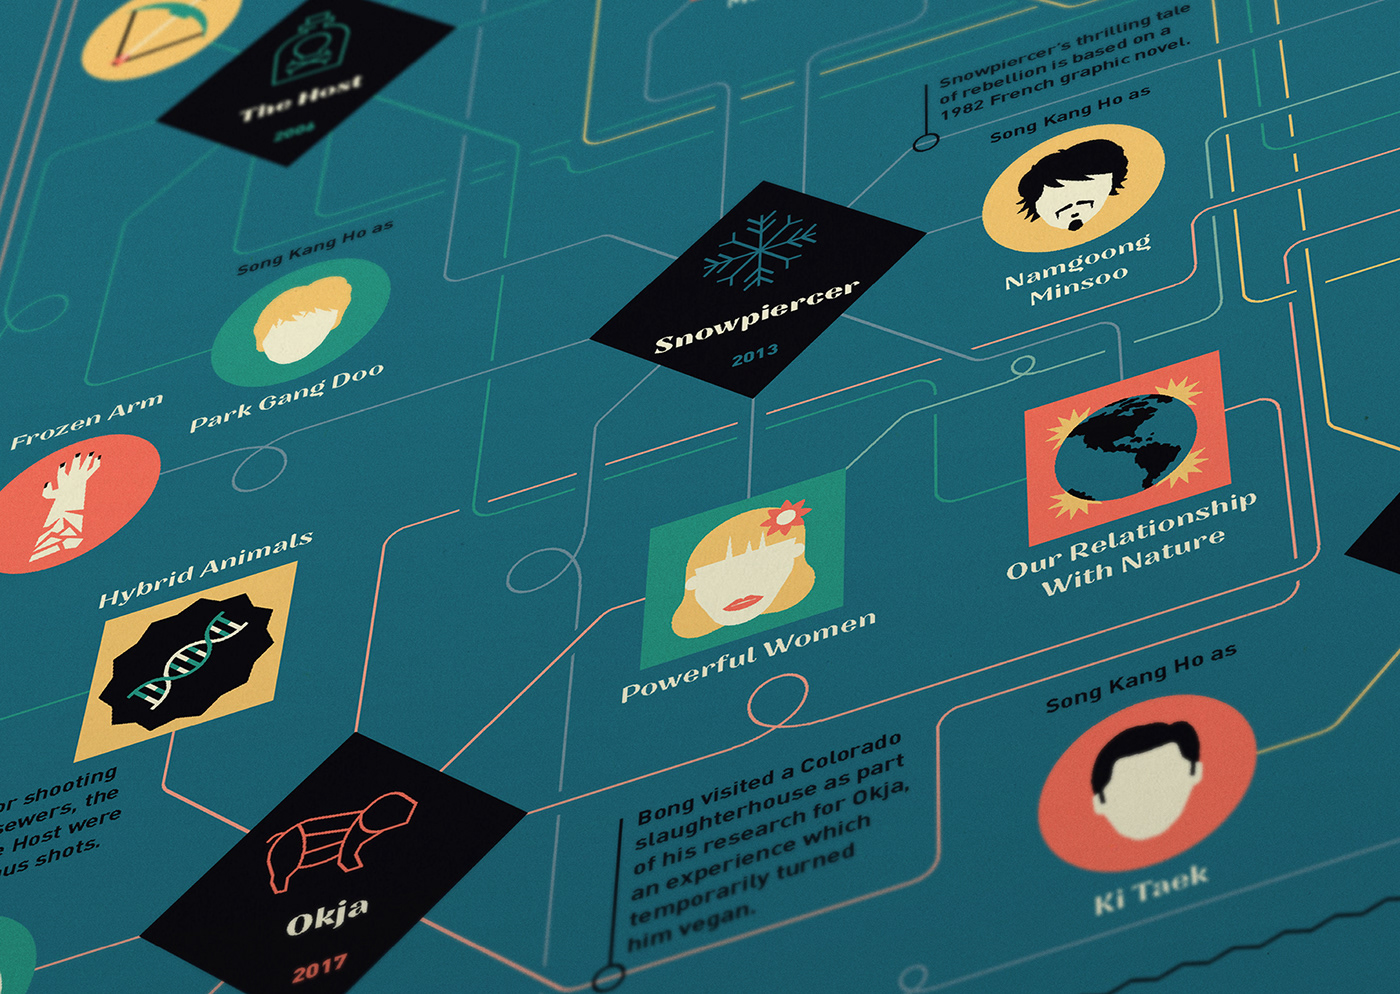
No. 2 / What Makes a Bong Joon Ho Movie?
Client / Neon Rated
–––––
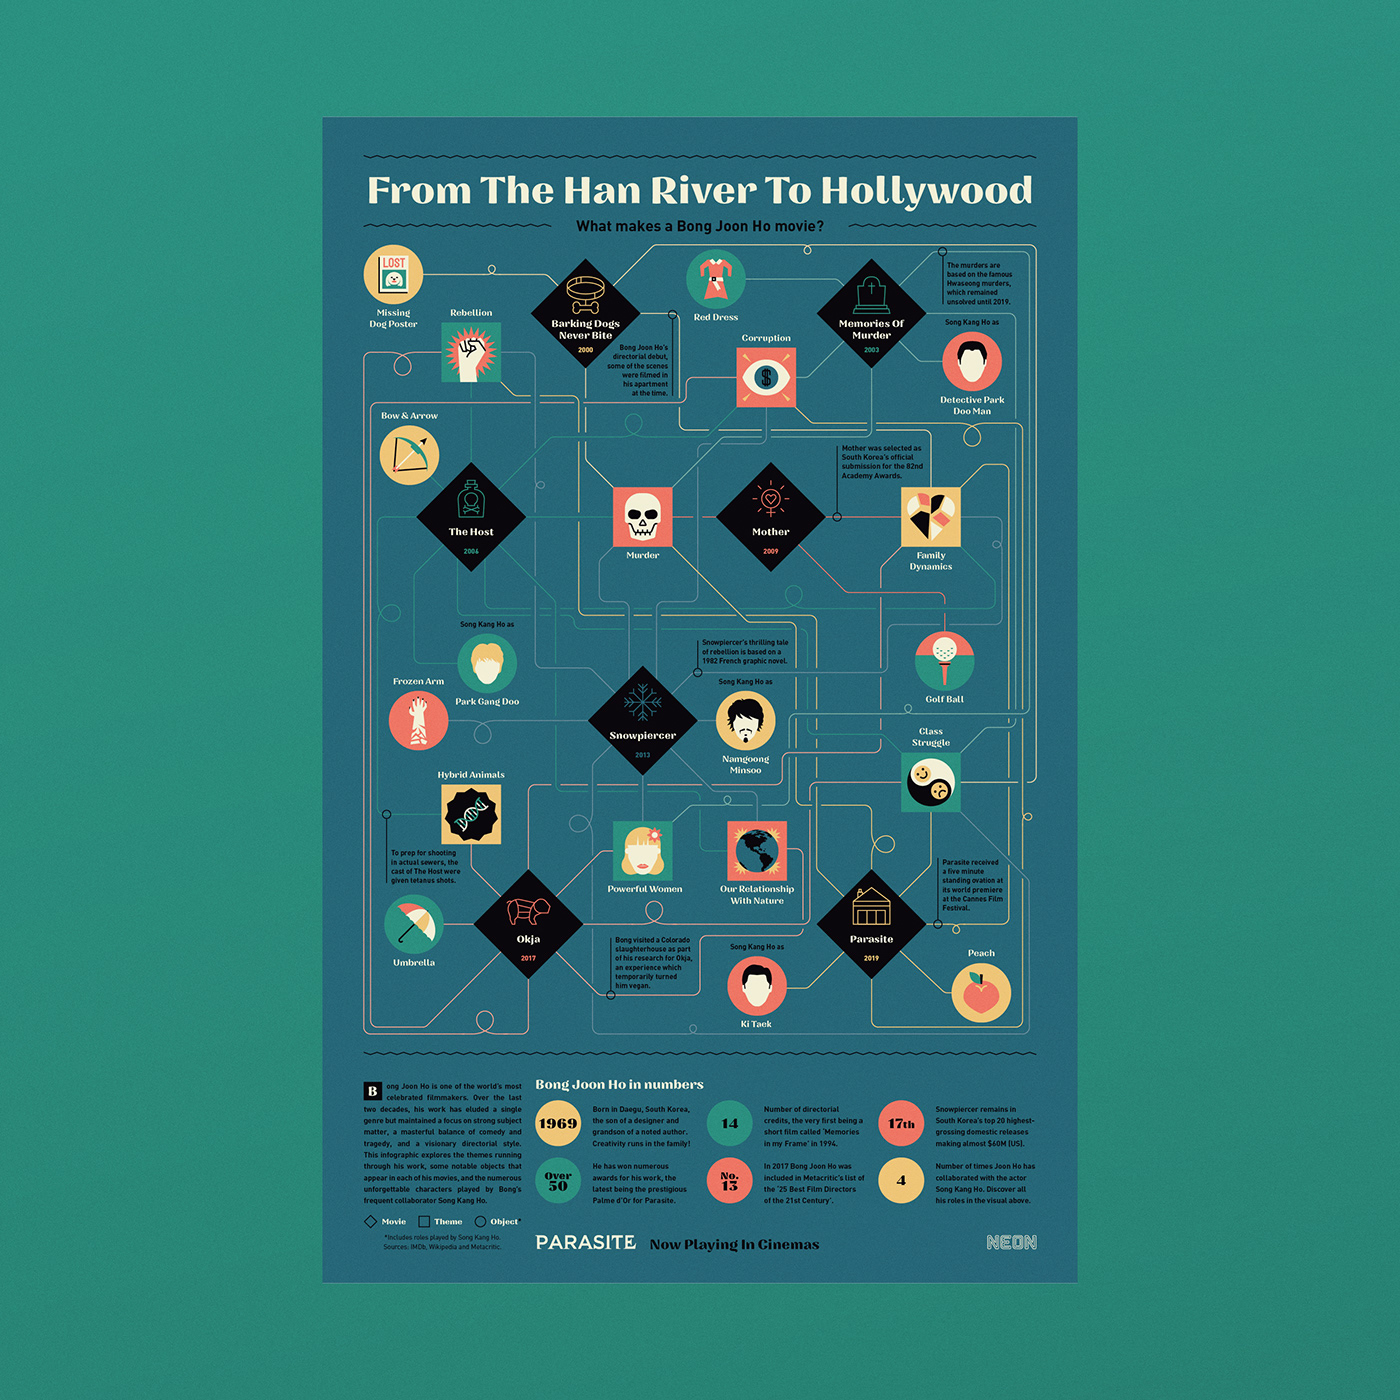
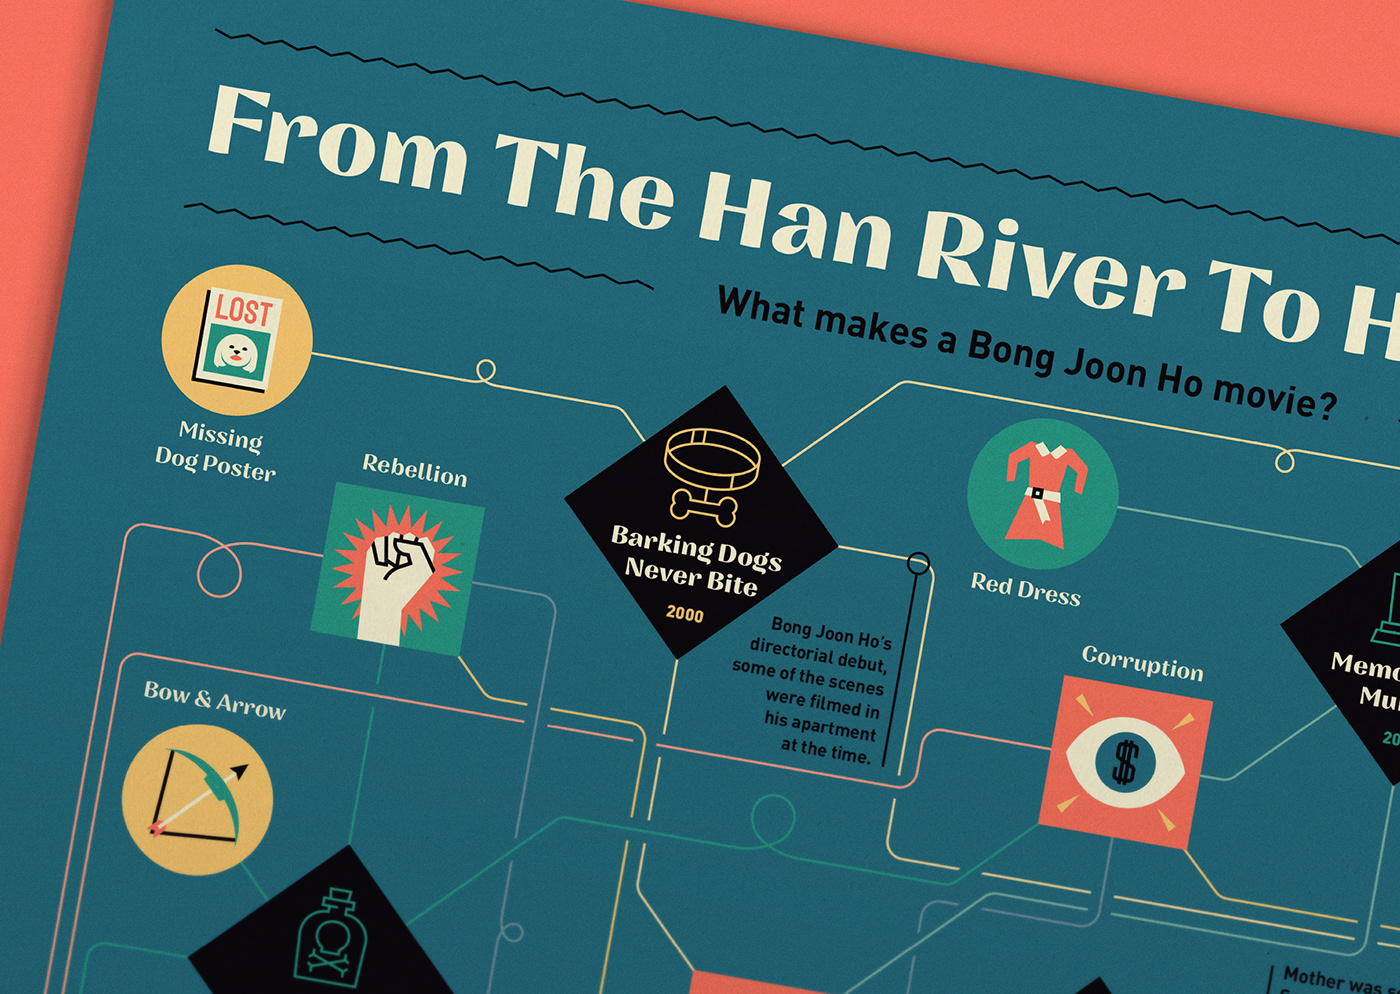
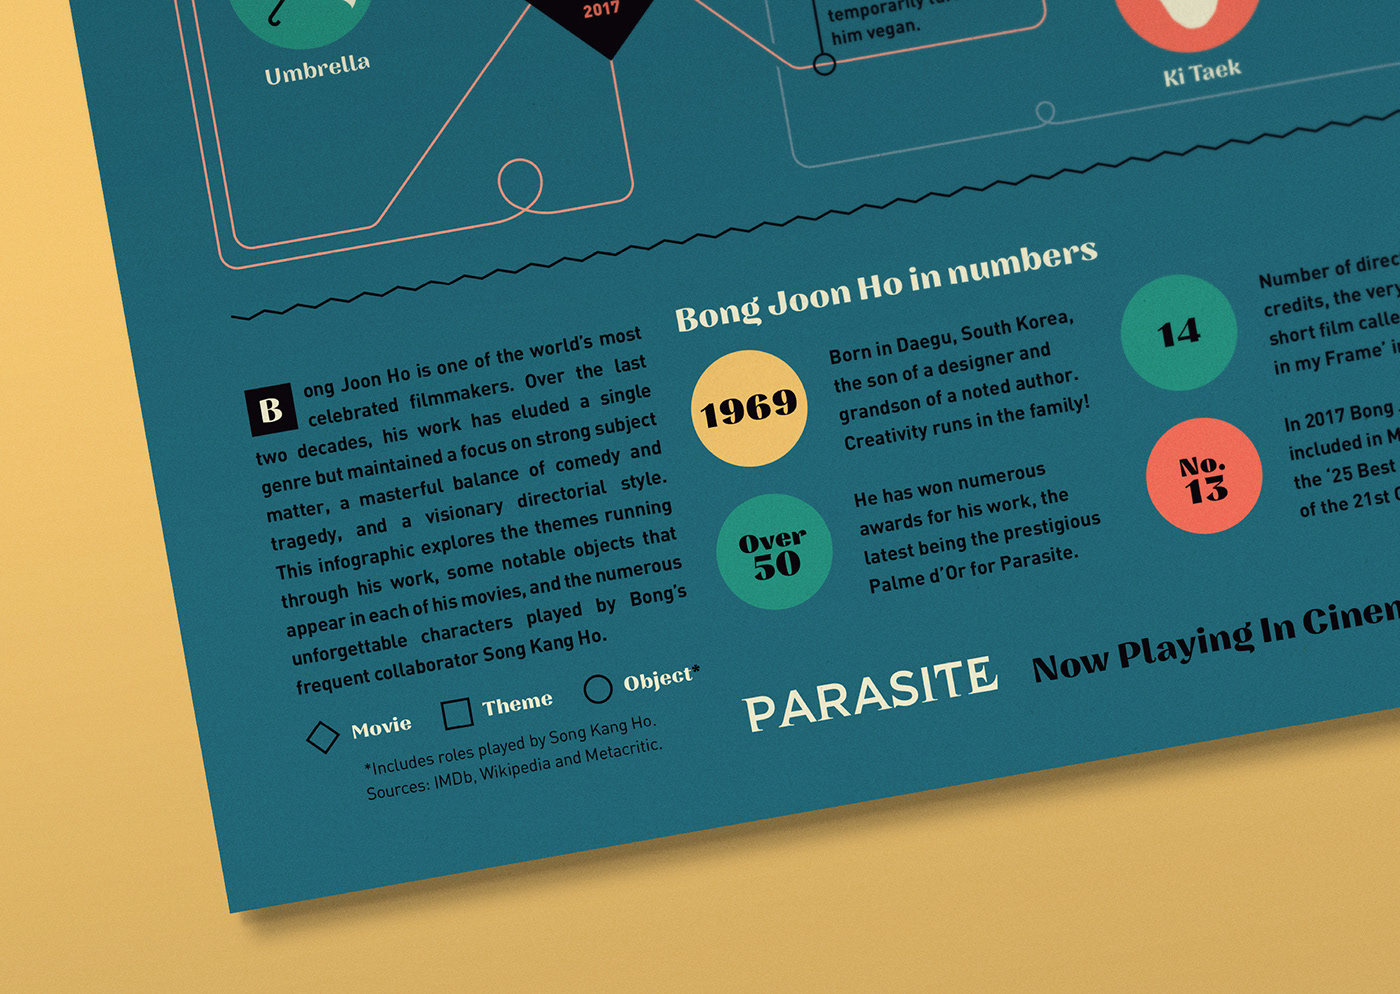
An infographic retrospective of the work of Bong Joon Ho, one of the world’s most celebrated filmmakers.
See the full project here

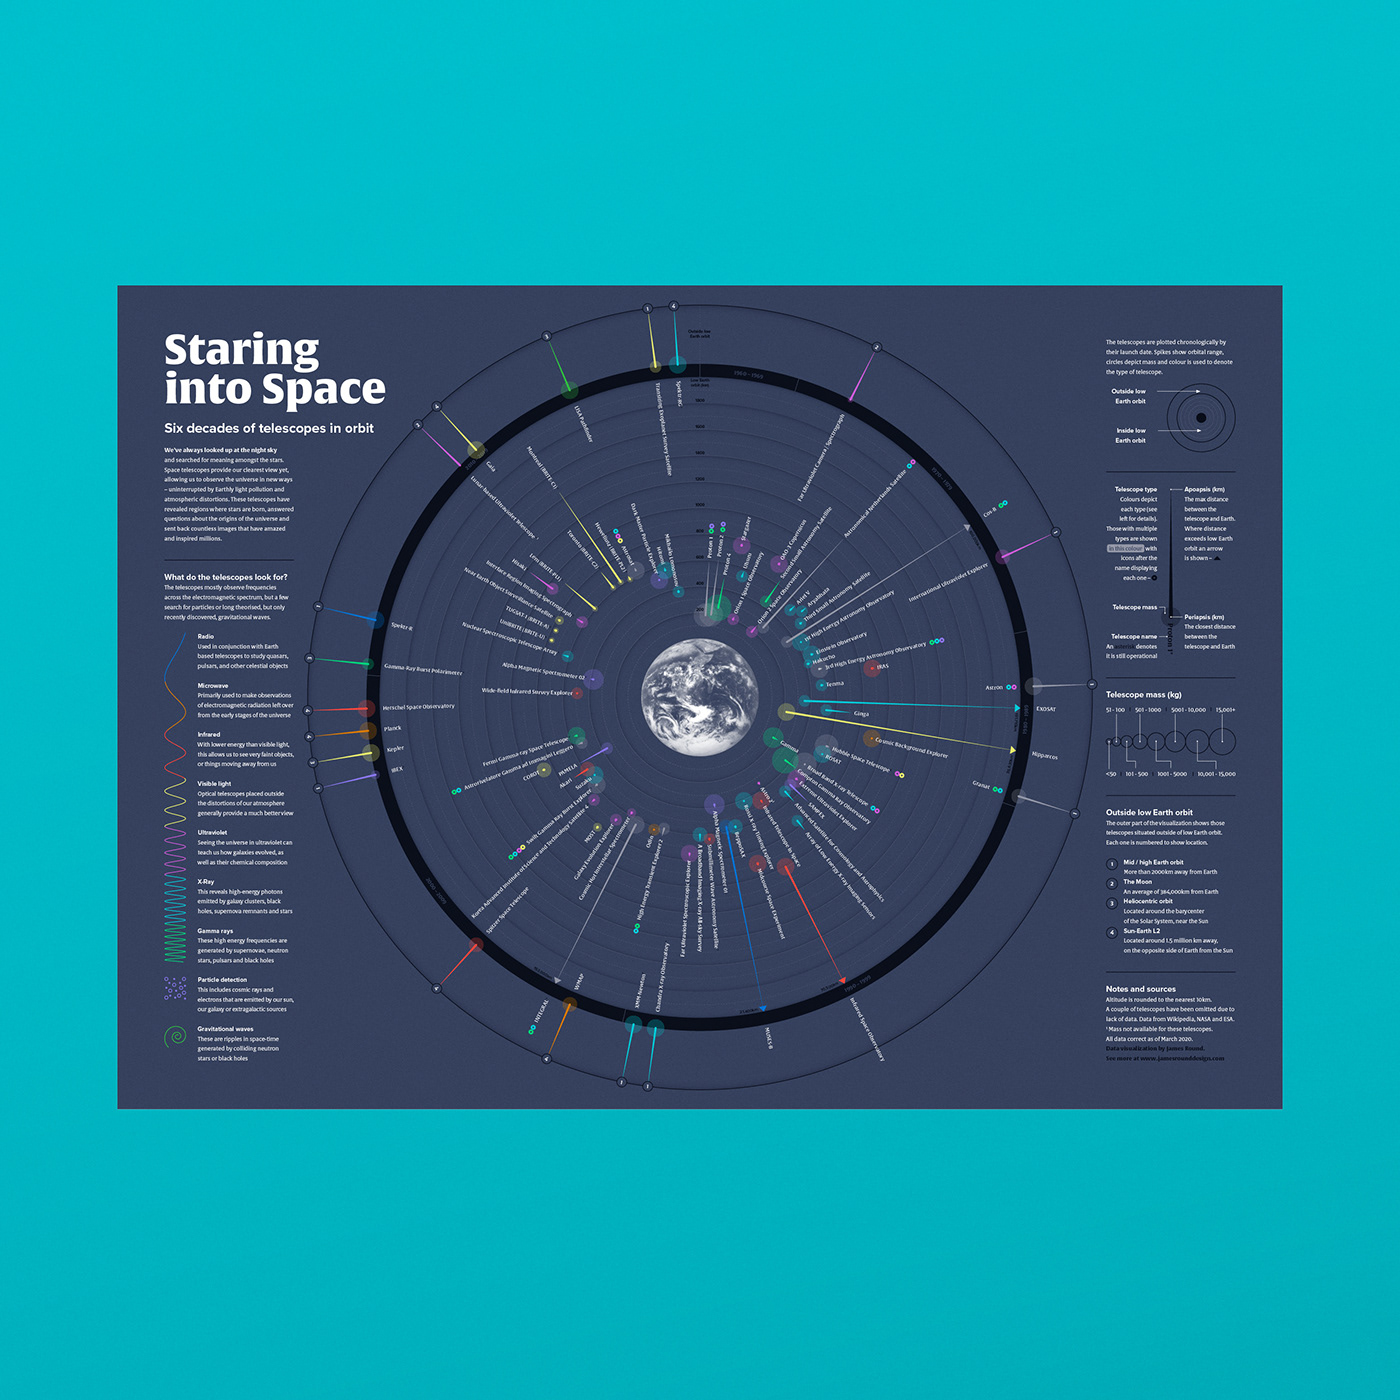
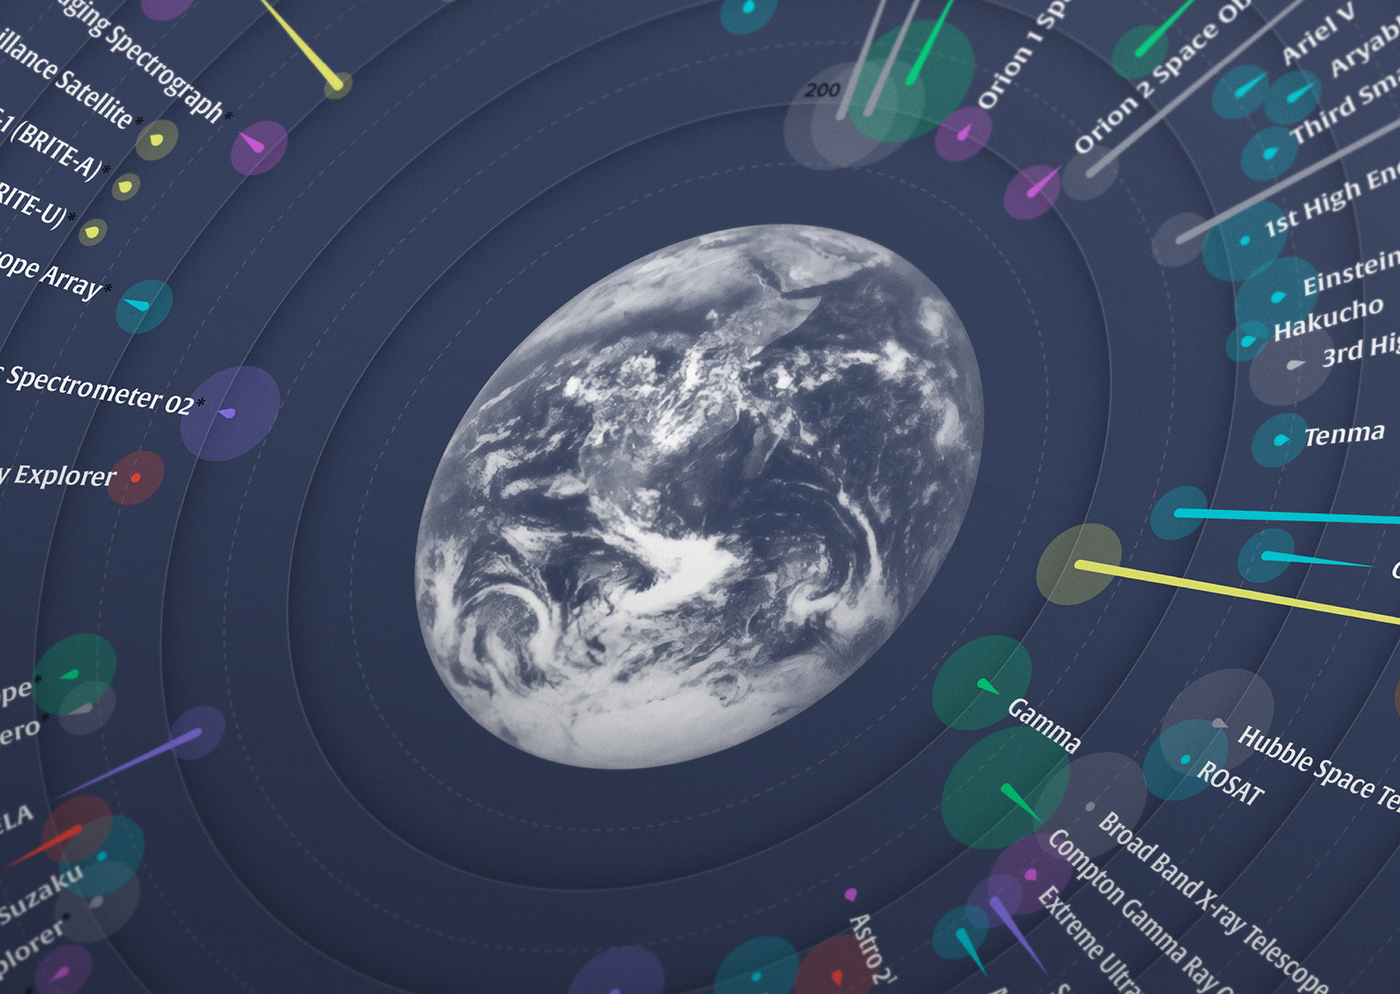
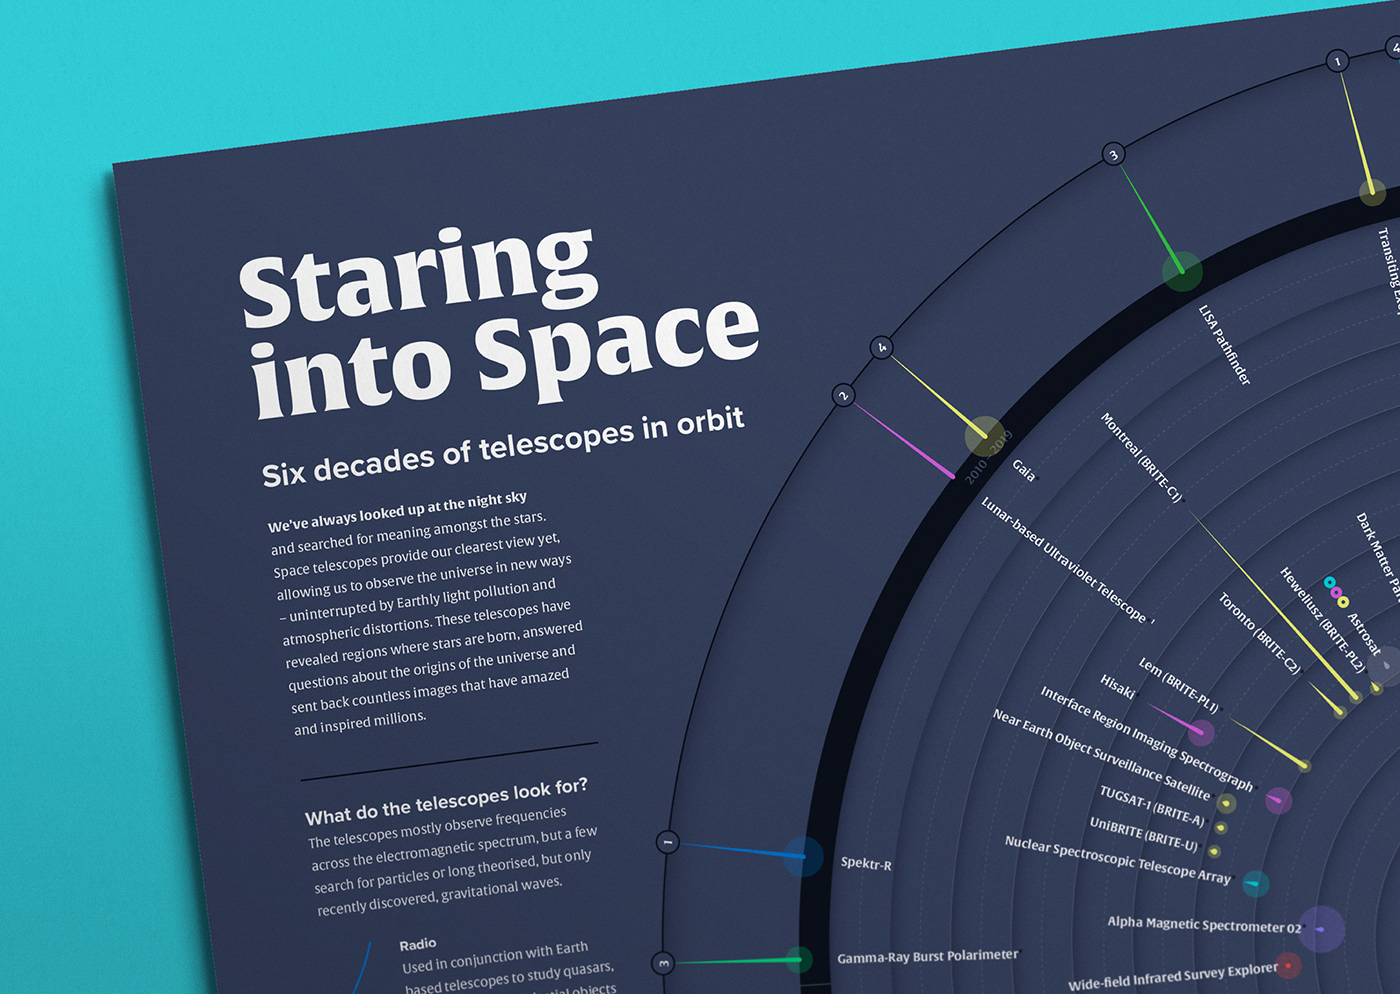
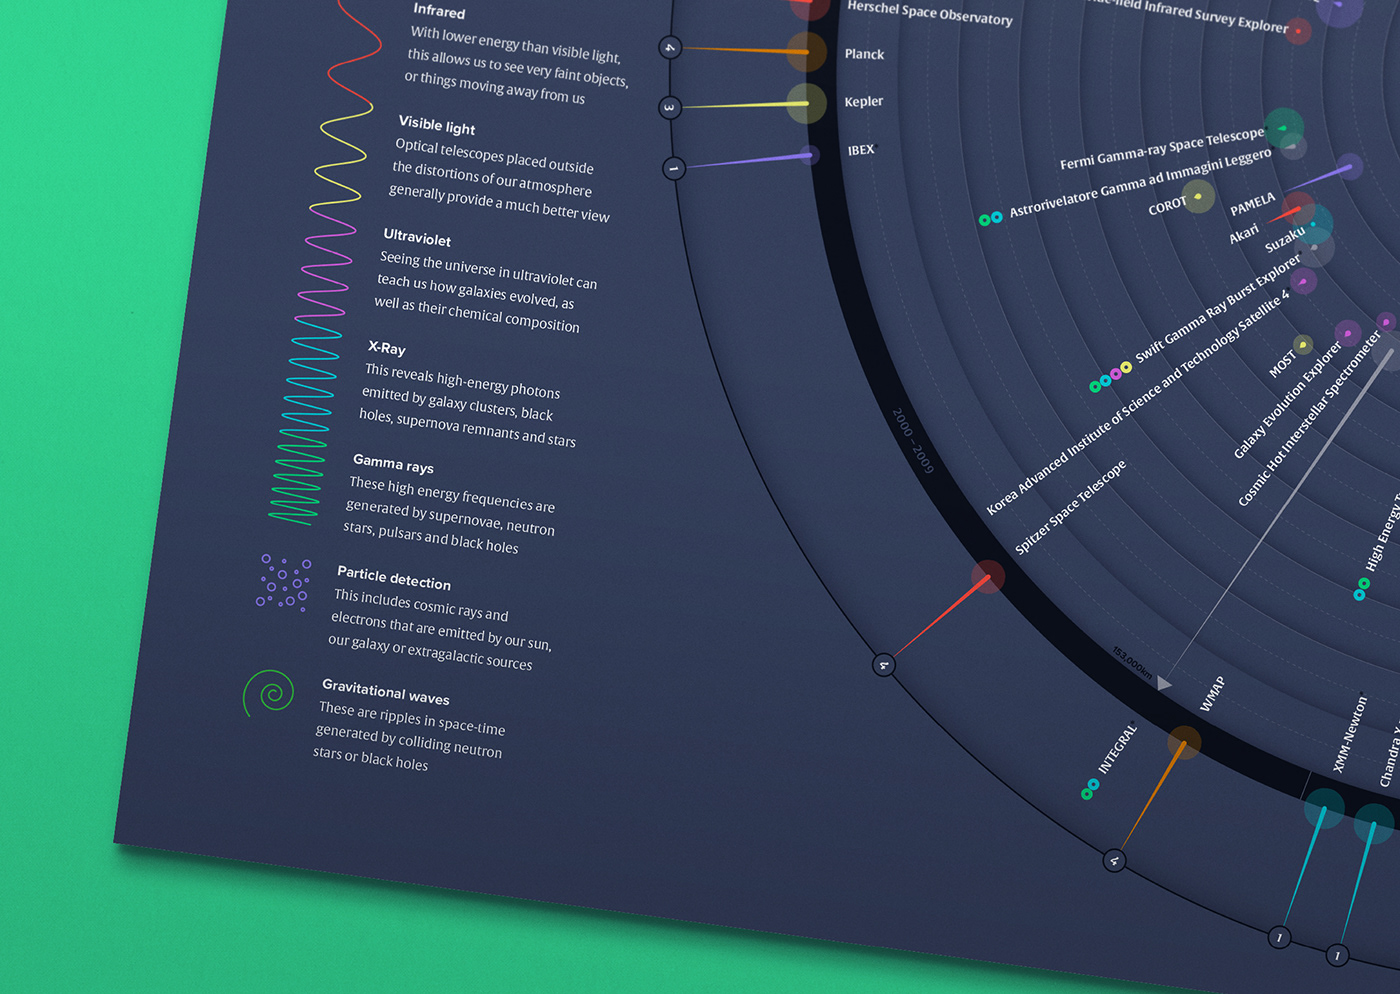
No. 3 / Staring into Space
–––––
A complex data visualization exploring six decades of telescopes in orbit.

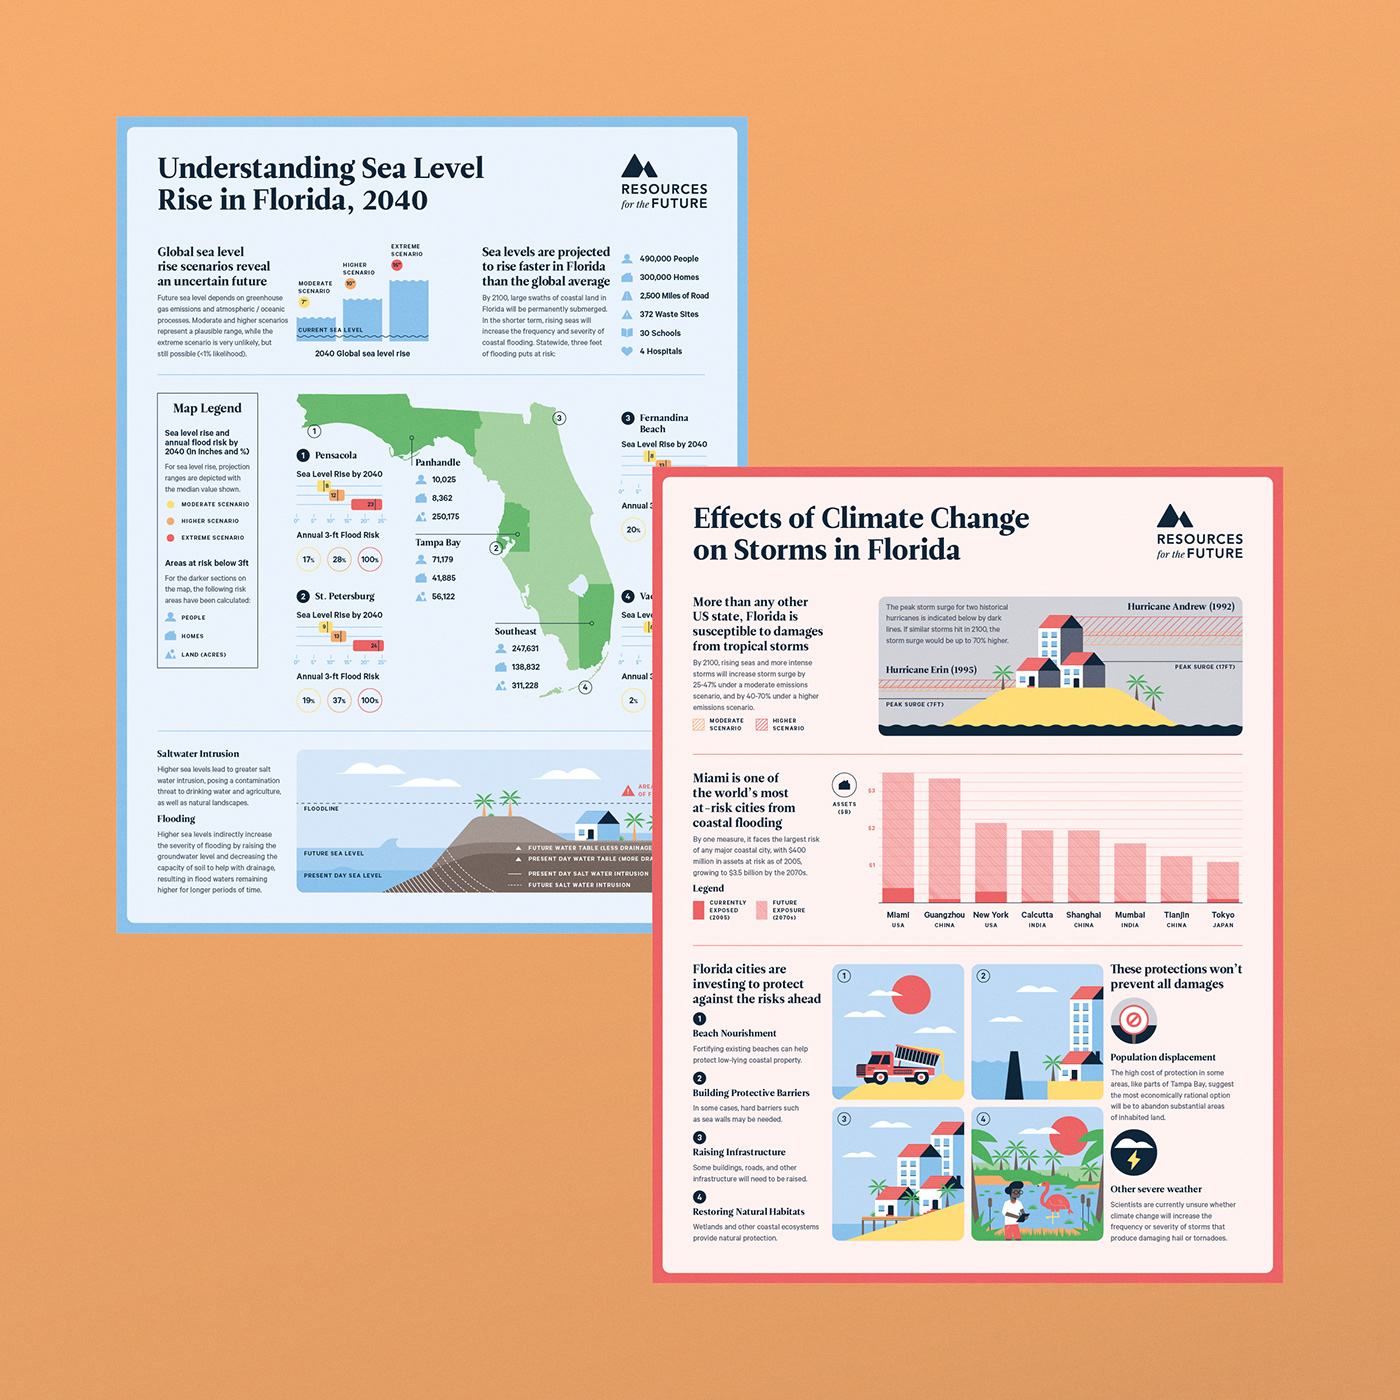
No. 4 / The Florida Climate Outlook
Client / Resources for the Future
–––––
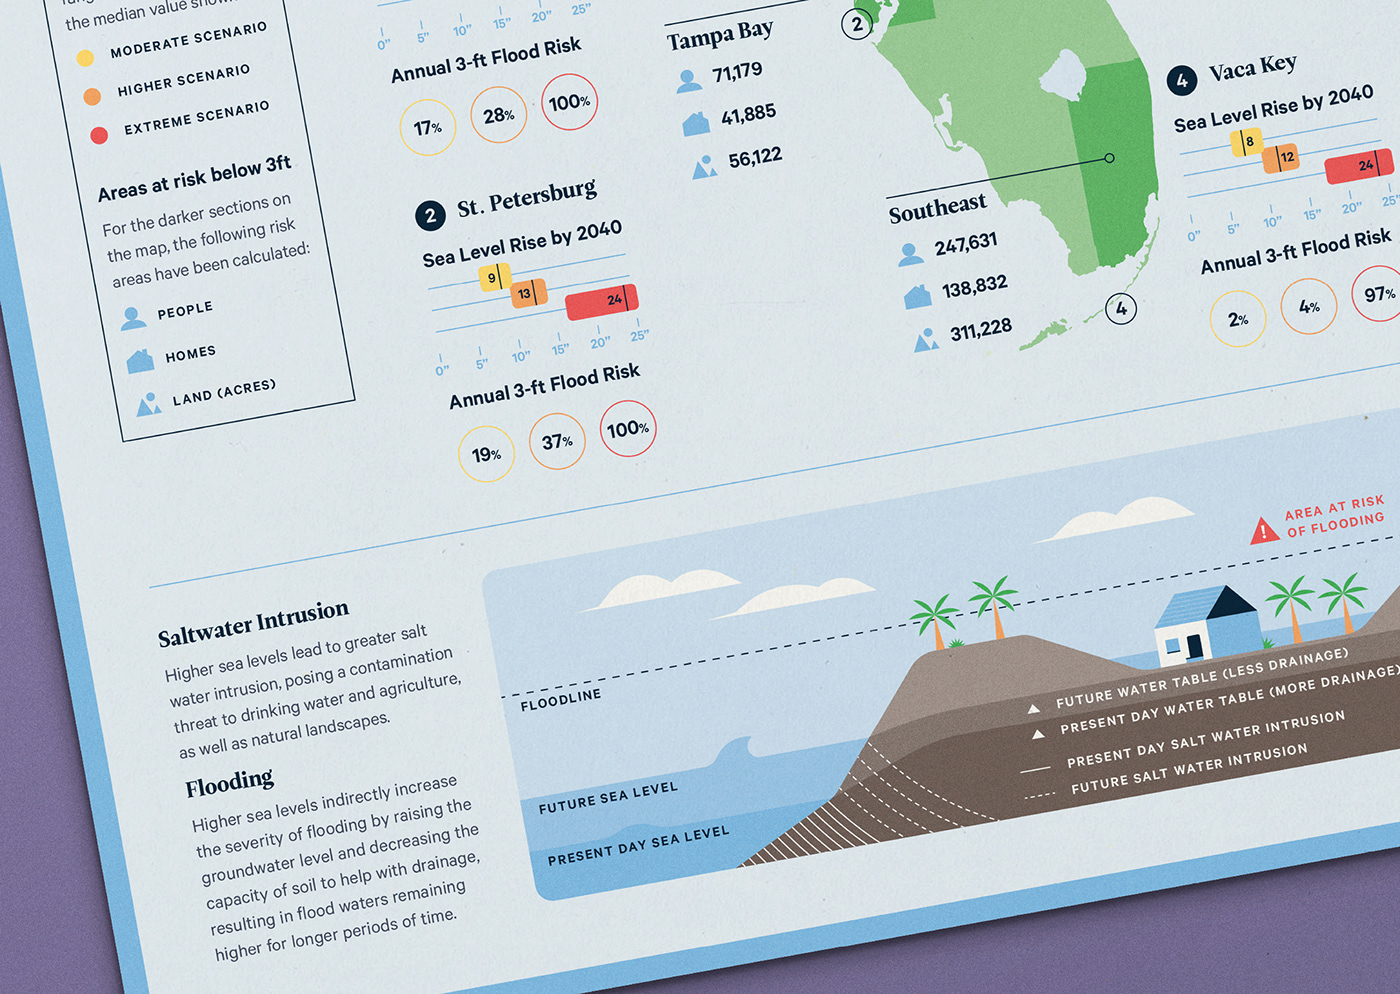
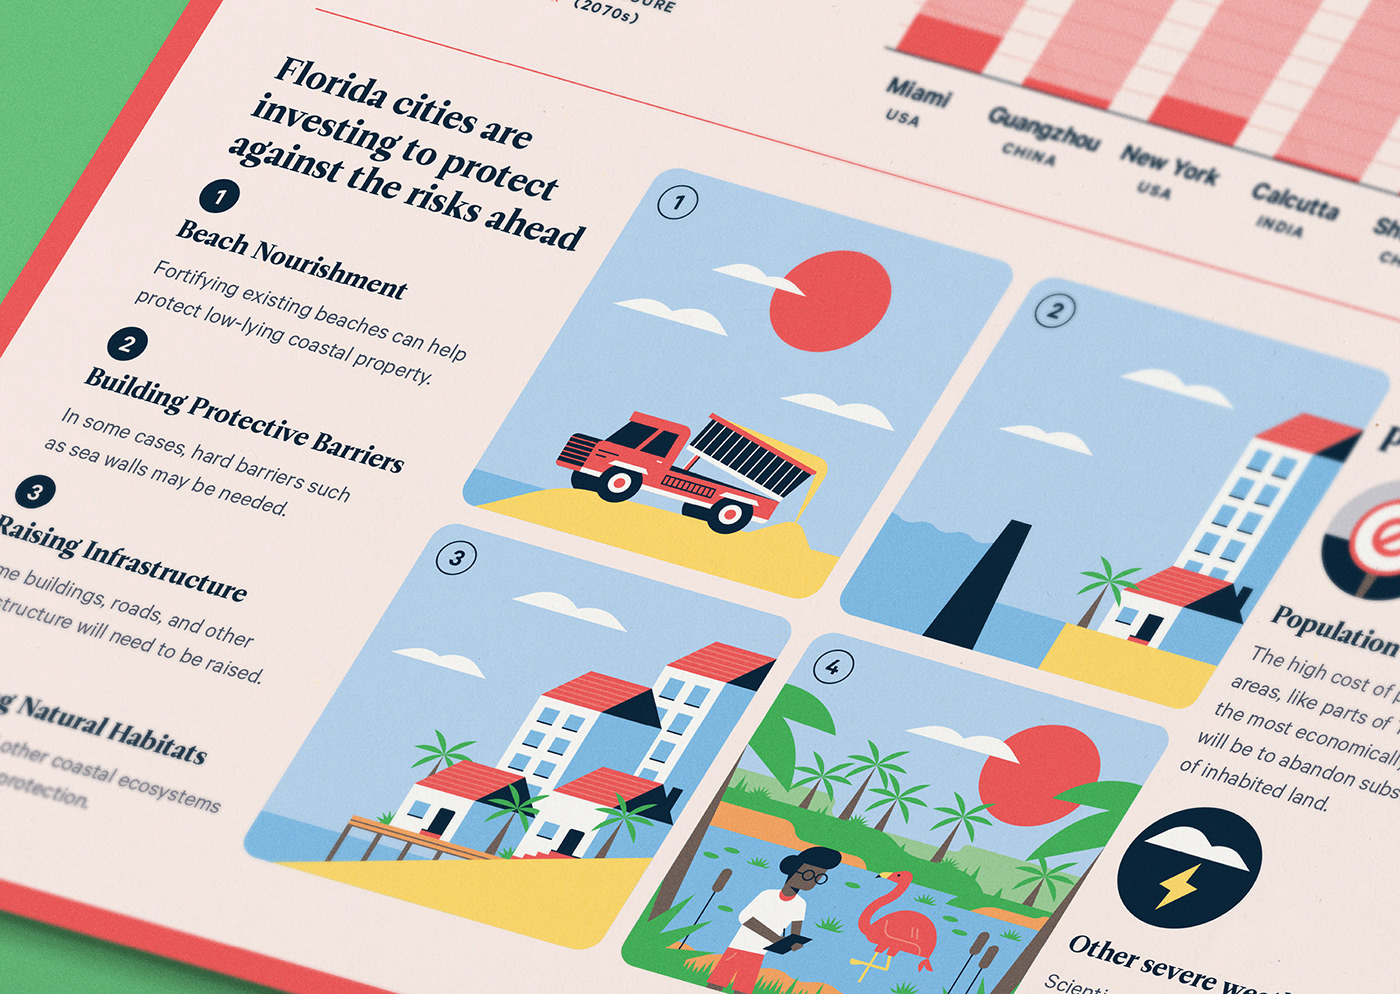
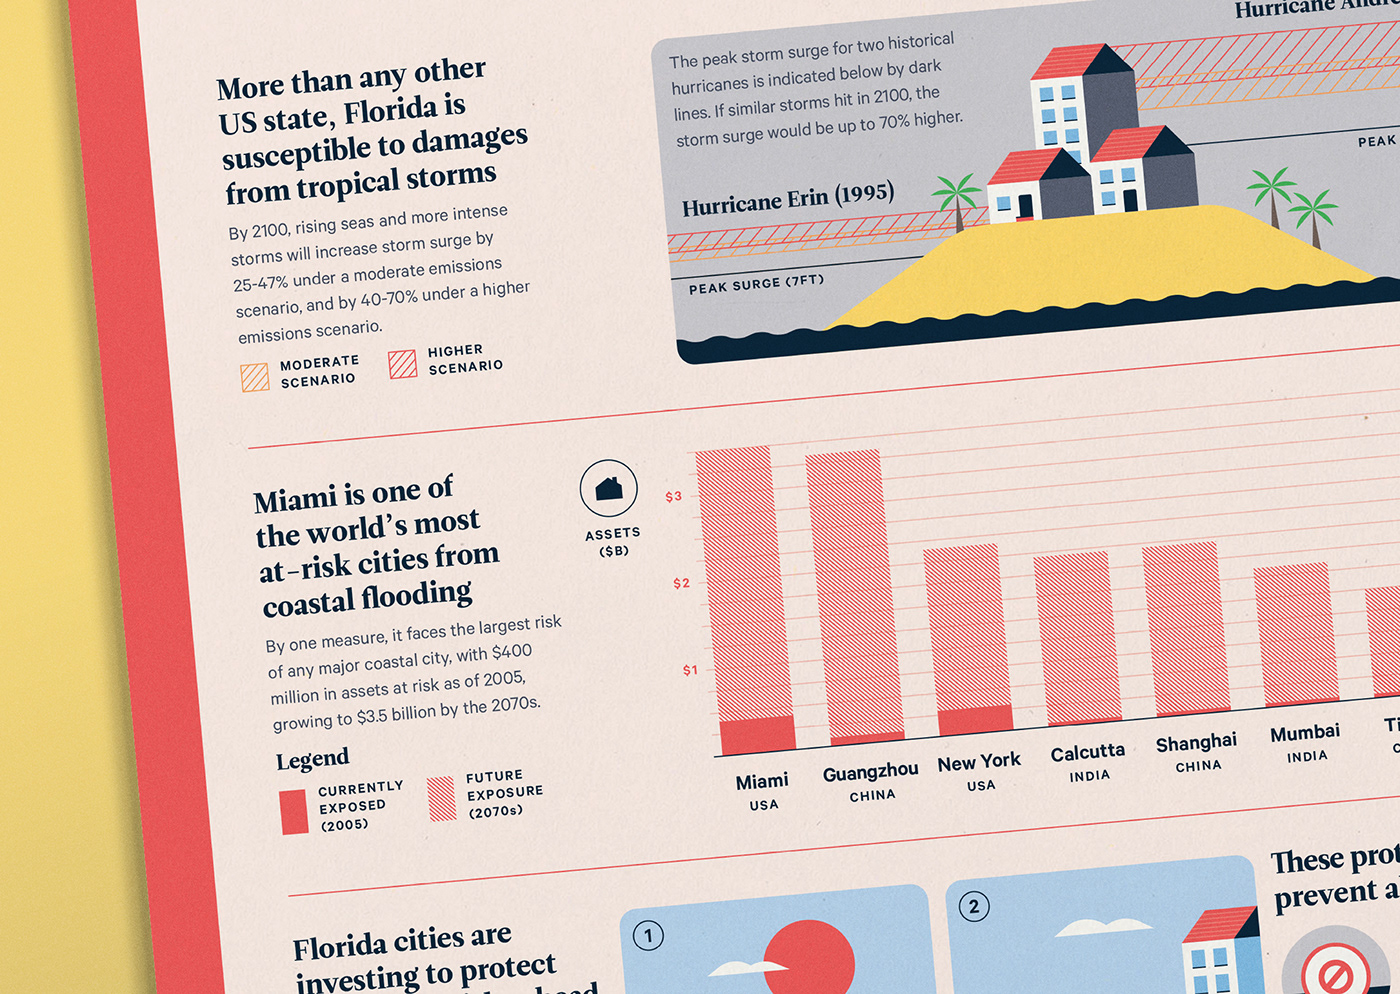
A series of infographics exploring the future impacts of climate change on Florida.
Two of five infographics are shown here. See the full project here

No. 5 / Cosmic Calls
–––––
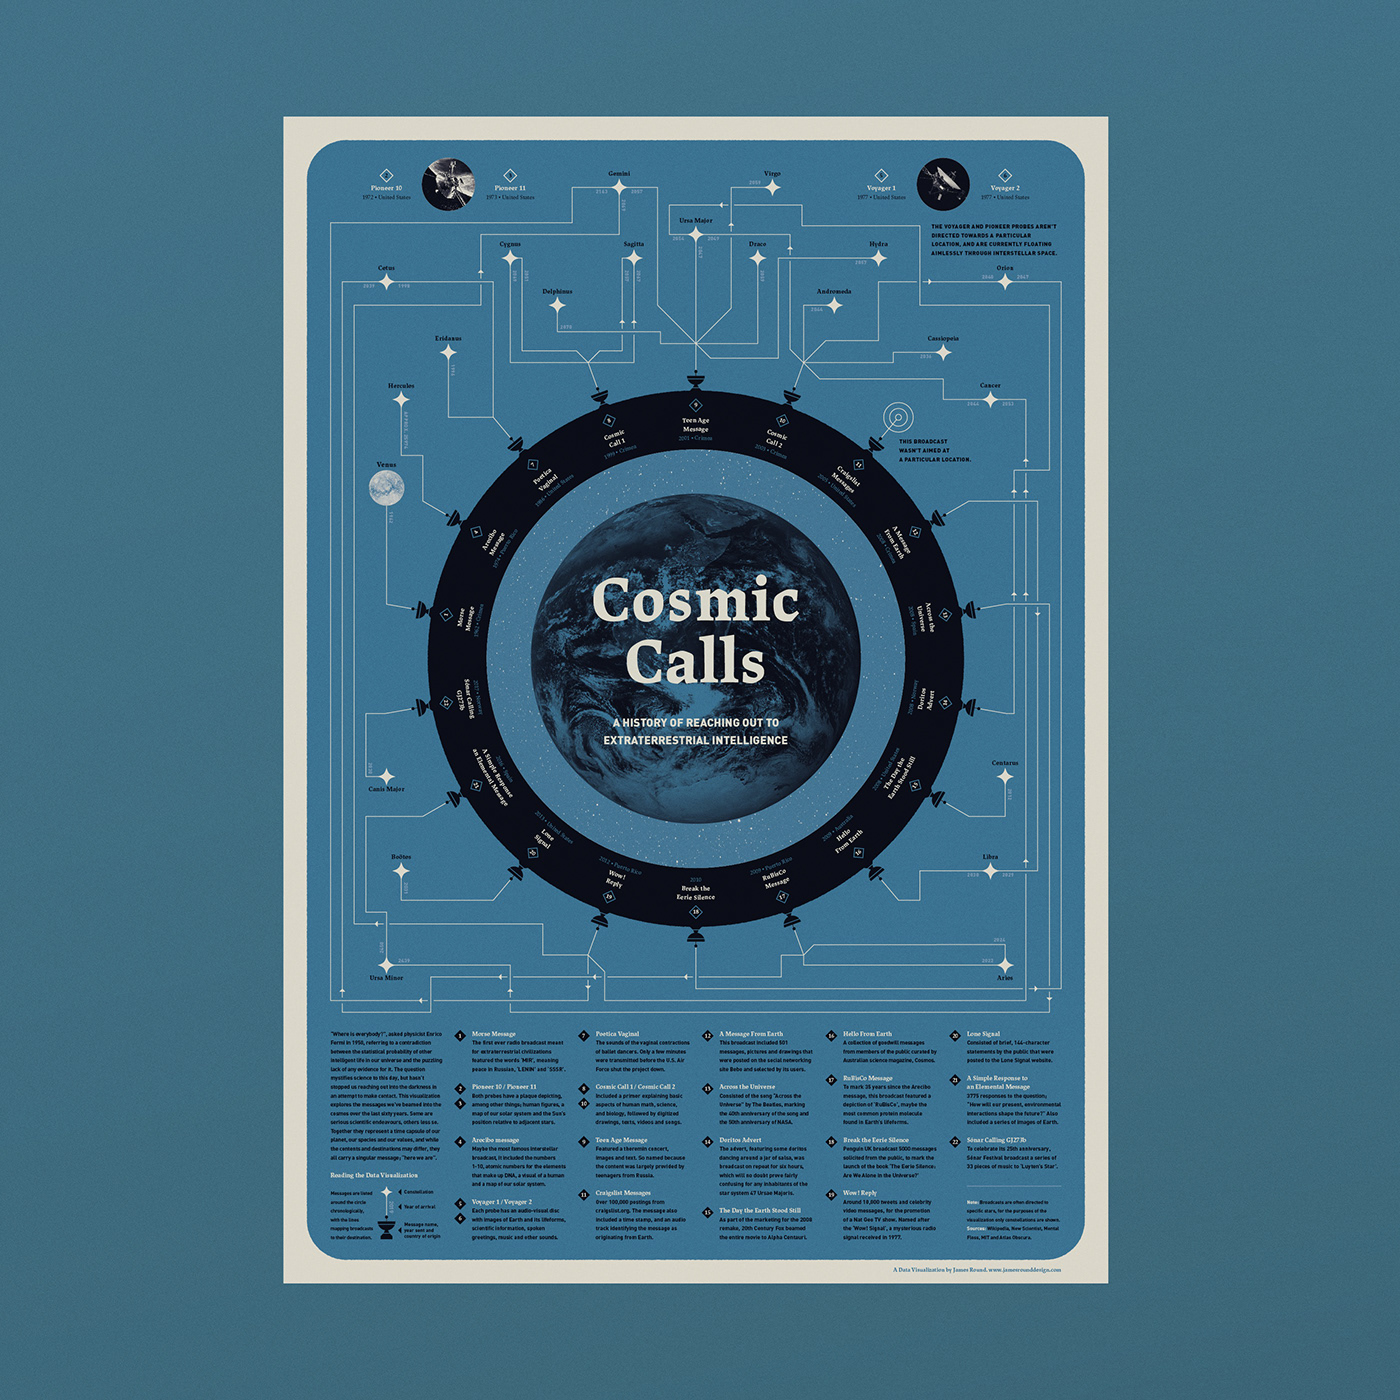
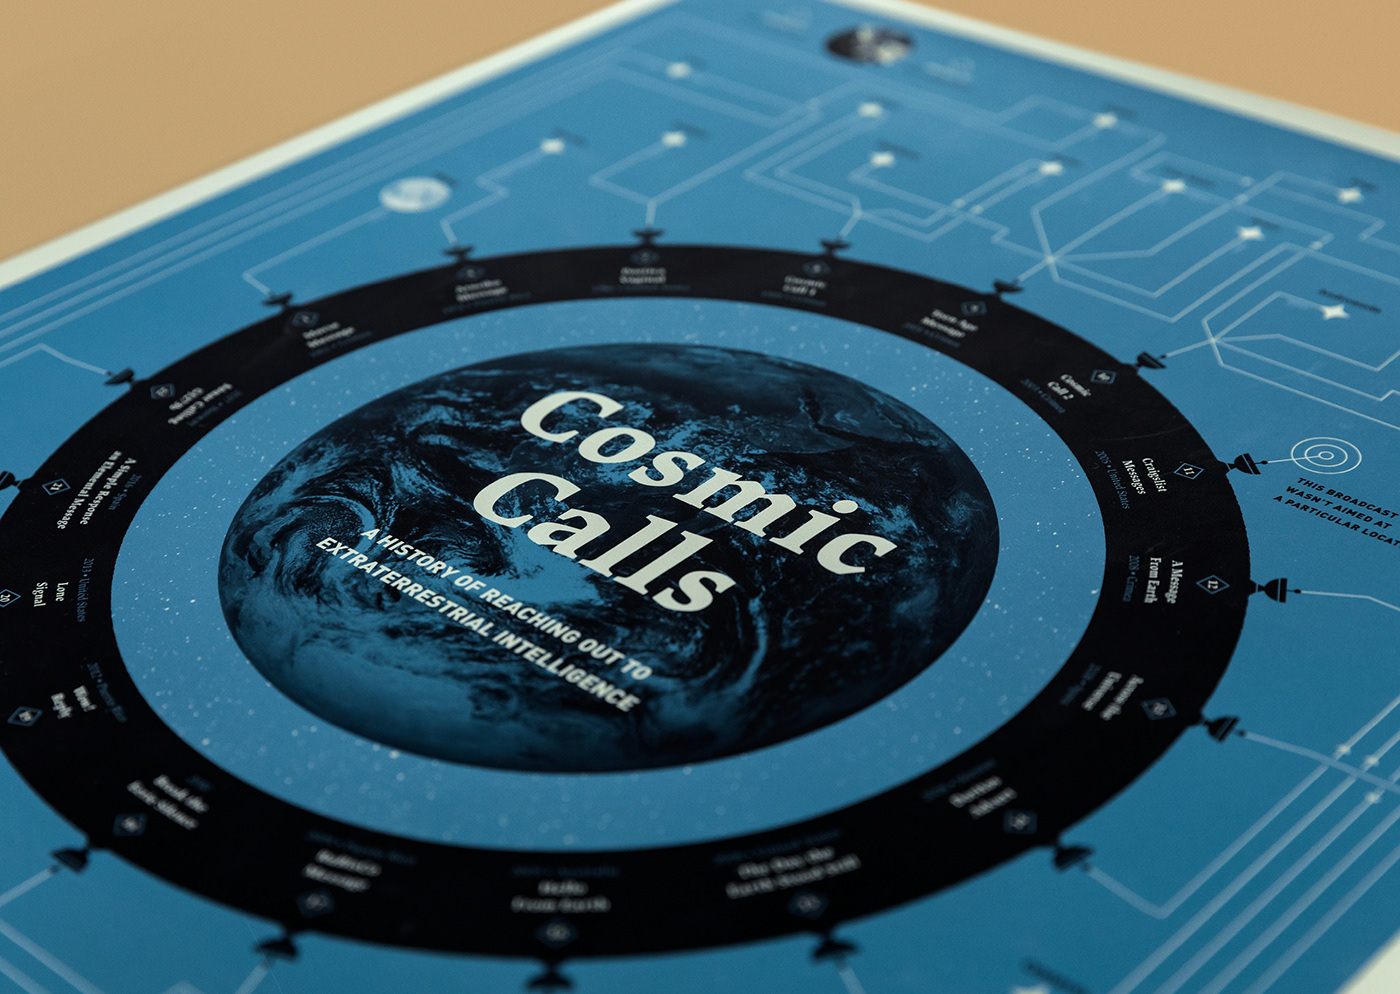
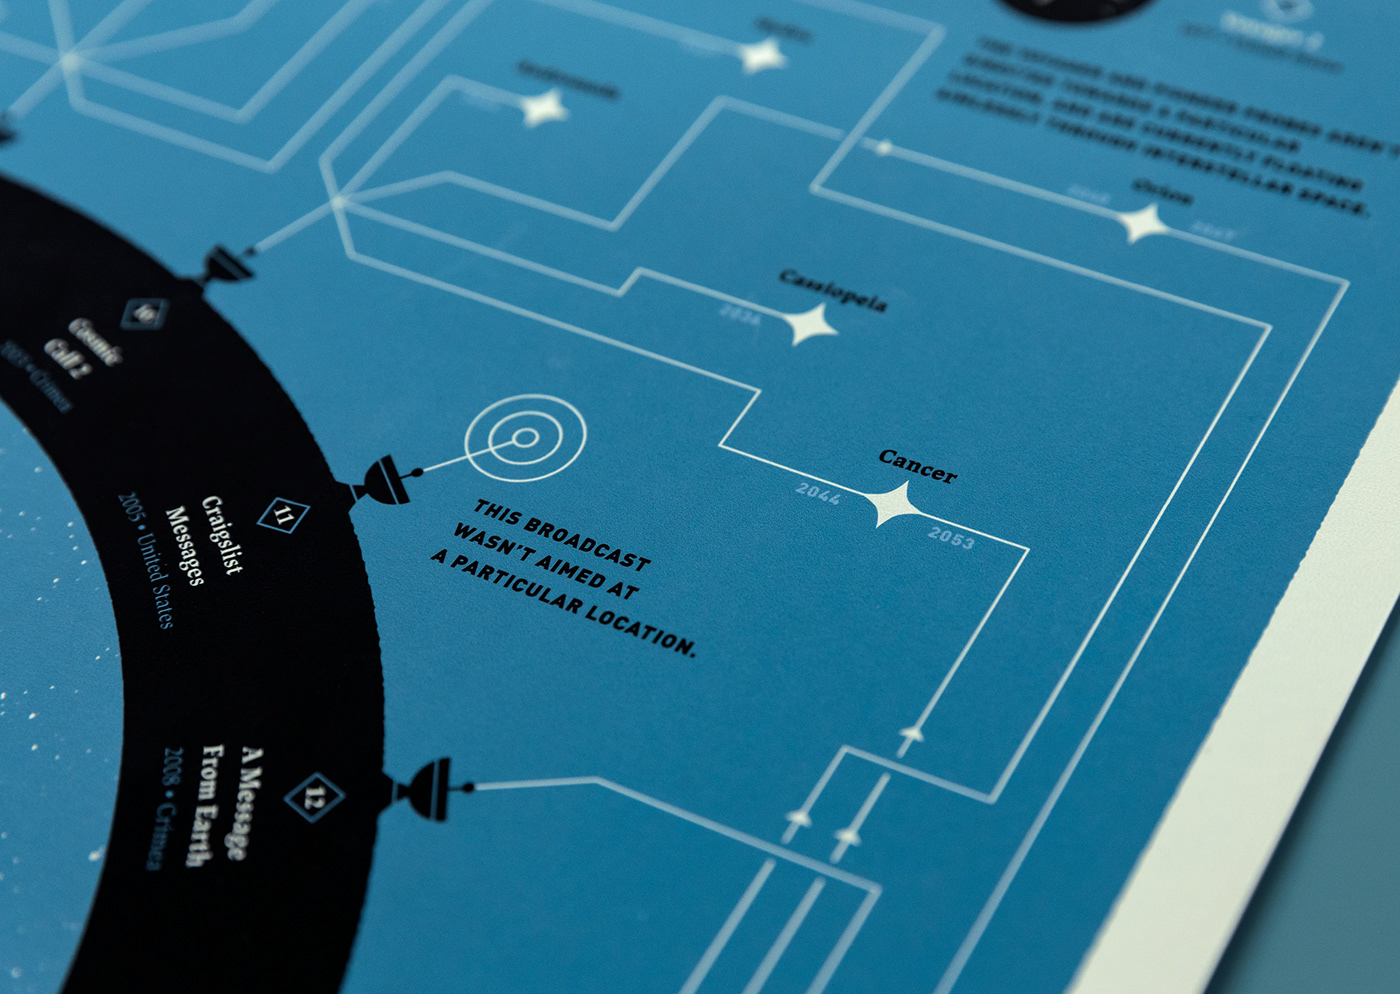
A data visualization exploring humanities attempts at messaging extraterrestrial civilizations.
See the full project here


No. 6 / Path to Pandemic
Client / BBC Science Focus
–––––
A detail focused and informative infographic exploring the rise of the COVID-19 global pandemic.



Thanks for looking!


