


.
EVALUATED APP
Do you know Bicimia?
Bicimia is a bike sharing system. There are 83 bike stations located in the city of Brescia in which is possible to borrow a bike using the official mobility card. The return of the bike can be done at a different point from the one where it was taken, to allow a multimodal transport integration.
The general objectives of this redesign were: (1) Improve the usability of Bicimia and (2) Improve the user experience while interacting with Bicimia. The specific ones are: (a) Identify usability problems and opportunities of improvement of Bicimia, (b) Evaluate emotional aspects of the user experience, (c) Check if users understand properly the interface elements and the concept of the application and (d) Outline an overview of users’ perceptions of Bicimia checking the apple store comments and score.
The conception and design, analysis and interpretation of the data, drafting this work and revising it, has no affiliation with any organisation with a direct or indirect financial interest.
.

.
USER PROFILES
What do we know about the users?
We didn’t had access to the users database of Bicimia. This is a sensitive information that is not public. It was decided to create 4 personas in the age range from 15 to 34 years that corresponds to 20,4% of Brescia's population ¹. Based on that we created 4 user profiles.
[1] https://www.tuttitalia.it/lombardia/65-brescia/statistiche/popolazione-eta-sesso-stato-civile-2019/
.
HEURISTIC EVALUATION
Let's evaluate the system!
Usability evaluation of desktop environments has been widely studied and mobile browsing from smartphones and tablets present new usability challenges ². It was performed a heuristic evaluation centered in mobile interfaces based on a checklist, that includes a compilation of recommended guidelines that takes usability into account - sub heuristics.
[2] R. Inostroza, C. Rusu, S. Roncagliolo, C. Jime ́nez, and V. Rusu, “Usability heuristics for touchscreen-based mobile devices,” in Proceedings of the 9th International Conference on Information Technology (ITNG '12), pp. 662–667, Las Vegas, Nev, USA, April 2012.
.

.
HEURISTIC EVALUATION
Mobile constraints must to be considered
Mobile interactions define a new paradigm characterised by a wide range of specific constraints: hardware limitations, context of use, type of tasks, limited processing capability and power, etc ³.
[3] Rosa Yáñez Gómez; Daniel Cascado Caballero; José-Luis Sevillano. 2014. Heuristic evaluation on mobile interfaces: A new checklist. The Scientific World Journal 2014, 1-19.
.
HEURISTIC EVALUATION
OK, so what's next?
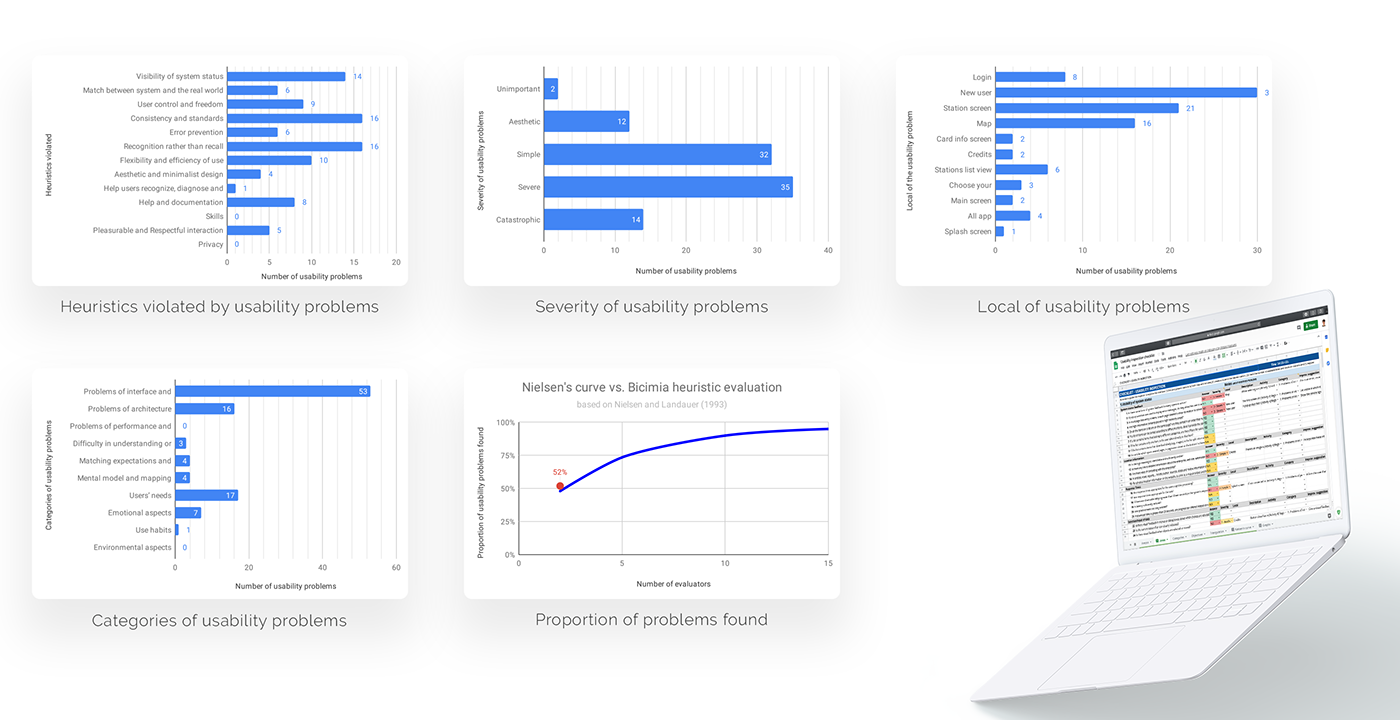
A mobile-specific usability heuristic checklist with a final compilation of heuristics that was used as a tool to evaluate usability of mobile interfaces. Composed by 230 questions with possible answers “yes/no/NA”. The number of “yes” answers provides a measure of the usability of the interface. The resulting usability rate for Bicimia was 48,9% based on items with positive evaluation.
.
.
HEURISTIC EVALUATION
Severity ratings and classification of usability problems
The 0 to 4 rating scale was be used to rate the severity of usability problems: (0) unimportant, (1) aesthetic, (2) simple, (3) severe, (4) Catastrophic ⁴. The classification was a list of 11 points with sub points regarding to Public Transport System
[4] https://www.nngroup.com/articles/how-to-rate-the-severity-of-usability-problems/
.
HEURISTIC EVALUATION & USER EVALUATION
Activities performed by both evaluators and users
(1) Find and present stations by both map and list view; (2) Create a route to the nearest station; (3) Check the number of available bikes and docks on stations; (4) Register/Login.
.

.
USER EVALUATION
Consent term & pretest questionnaire
After consenting to participate, the users were led to a quiet indoor space and the evaluators used contextual observation and Think Aloud technique⁵. Our group of users has age between 18 and 34 years, use public transport and study and/or work. For 60% of this group the most used public transport is subway and for 40% is bus, and all group uses shared bikes. 60% self considered advanced users and 40% intermediate. They satisfaction level is distributed between (40%) unsatisfied, (20%) neutral and (40%) satisfied. 80% of this group affirmed that knows how to use all the functions of the application. The Bicimia application meet the needs of all users, this result is contradictory when comparing with the satisfaction indicators.
[5] Janni Nielsen, Torkil Clemmensen, and Carsten Yssing. 2002. Getting access to what goes on in people's heads?: reflections on the think-aloud technique. In Proceedings of the second Nordic conference on Human-computer interaction (NordiCHI '02). ACM, New York, NY, USA, 101-110. DOI=http://dx.doi.org/10.1145/572020.572033
.
USER EVALUATION
SAM & post test questionnaire
The post test-test questionnaire was based on Computer System Usability Questionnaire (QSUQ)⁶ and Questionnaire for User Interface Satisfaction (QUIS)⁷. Finally, users responded to the Self-Assessment Manikin (SAM)⁸.
[6] James R. Lewis. 1992. Psychometric Evaluation of the Computer System Usability Questionnaire: the CSUQ. International Journal of Human-Computer Interaction 7, 1: 57-78
[7] John P. Chin, Virginia A. Diehl, and Kent L. Norman. 1988. Development of an instrument measuring user satisfaction of the human-computer interface. In Proceedings of the SIGCHI Conference on Human Factors in Computing Systems (CHI '88), J. J. O'Hare (Ed.). ACM, New York, NY, USA, 213-218. DOI=http://dx.doi.org/10.1145/57167.57203
[8] Margaret M. Bradley, Peter J. Lang. 1994. Measuring Emotion: The Self-Assessment Manikin and the Semantic Differential. Journal of Behavioral Therapy and Experimental Psychiatry 25, 49-59.
.

.
CONCLUSION
The final considerations
It was noticed that the users recognise the usefulness and relevance of the provided information, and for this reason, they face the usability problems with tolerance, even if they negatively affect their experience with the application. Changes in the UI affected positively the UX. Improvements in the sequence of screens, organisation of information and visual elements have generated an increase in users’ feelings of pleasure, dominance and security.


