Data Visualization
on Smart Market Supervision
——————————————————————————————
With the era of big data coming, "Internet+ Supervision" has become an inevitable trend for Market Supervision, which promote its Smart Supervision Platform based on new ICT technologies.


Application on Grid Supervision Center
This new supervision mode in return brings huge amount of data, which is on urgent demand of re-organizing, cleaning, analyzing and visualizing, in order to master the dynamic and logical development in real time.


Application on Grid Supervision Center
——————————————————————————————
Re-organizing Data - Resources Aggregation
Data from different business lines in the market supervision field (e.g. no-license, food production and special equipment) is supposed to be re-organized, so as to break down data silos and aggregating existing resources from all departments.
In Consequence, various supervision data converges back to grids.


Supervision on no-license / food-production / special equipment
By means of docking data of different type and from different source, market supervision is promoting its business to a integrated, visualized and comprehensive way.
——————————————————————————————
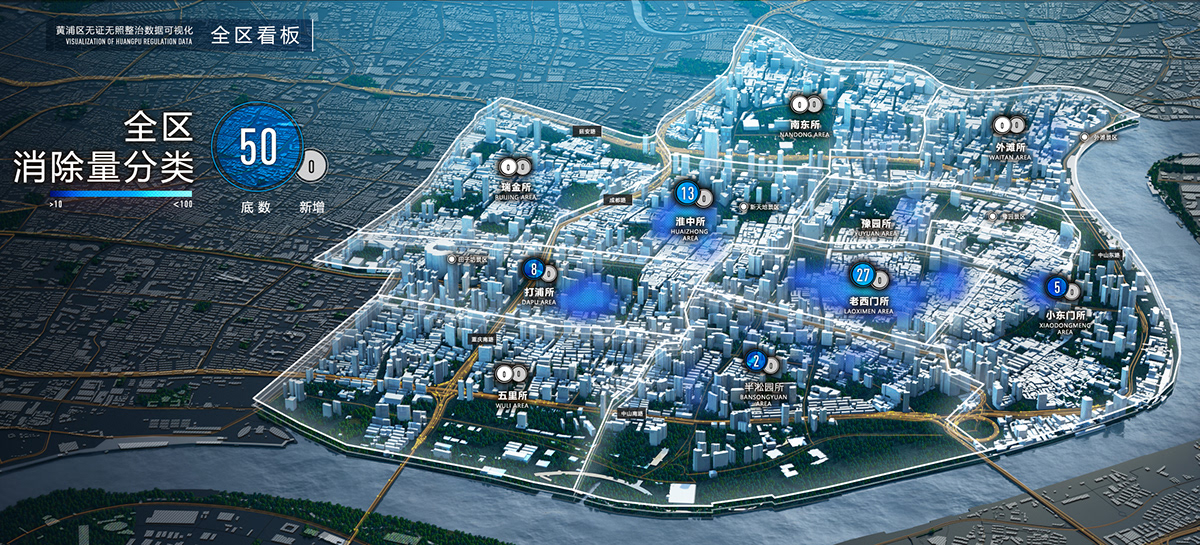
Probing Gird - Dynamic Supervision
Through the collection of data in a large range,a real-time distribution analysis shows directly the area where problems are concentrated and supervision objects that should be focused on.
No-license Supervision - Probing Grid
And another analysis based on GIS allows probing from district to block, even to the smallest grid, which further clarifies the supervision responsibility of each grid.

No-license Supervision - Probing Grid
Objects of each grid can be rapidly searched and located. Related geographic information and real-time data of each objects can accurately tell the supervision status in required aspects.
——————————————————————————————
Multi-dimensional Analysis - Additional Value
Multi-dimensional analysis is applied to meet multiple demands from various supervision objects and different business lines.

Food Production Supervision - regional analysis
Many analysis means, such as full life cycle analysis and deep category analysis, are used to put correlated data together to make it fully utilized, mining its additional value.

Food Production Supervision - full life cycle analysis
In a way, data from business re-work to assist business.
And the visualization in return support and promote Grid Supervision Mode.


