Planning, stage 1: Determining mood & data layout
When starting the design, I sat down and wondered how the infographic should “feel” to the viewer. I didn’t want a dry chart that would just spit out numbers and times; I wanted to visually express the beauty of the dynamics that govern tides.
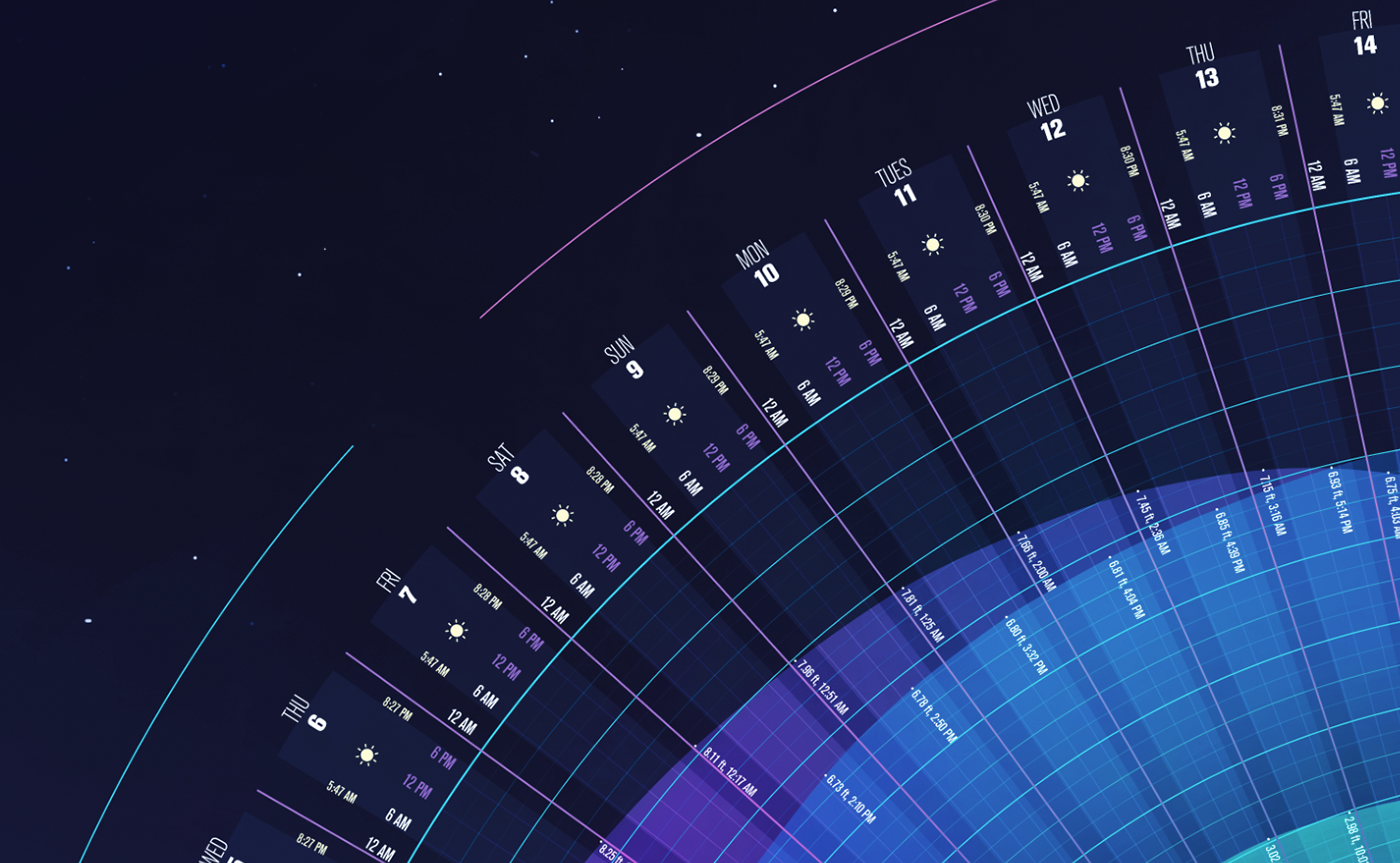
In laying out the data, I started with a radial grid base that would emphasize the smooth wave-like nature of the tide. I felt that a conventional linear graph wouldn’t flatter the ebb and flow of the tides as dramatically as a radial chart would.
Initial Visualization, stage 2: The quick and dirty mock-up
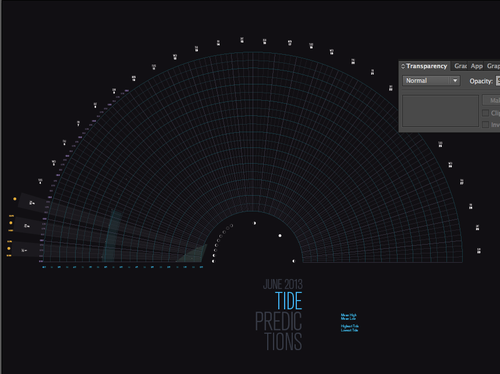
In Stage 2, I roughly sketched what I saw in my mind. I began to fill in information such as moon phases, individual calendar days for June 2013, and the tide height axis. To indicate the amounts of daylight and darkness for each day, I decided to show a visual ray of “light” illuminating the hours between sunrise and sunset for each day.
Progress, stage 3: Fix design issues
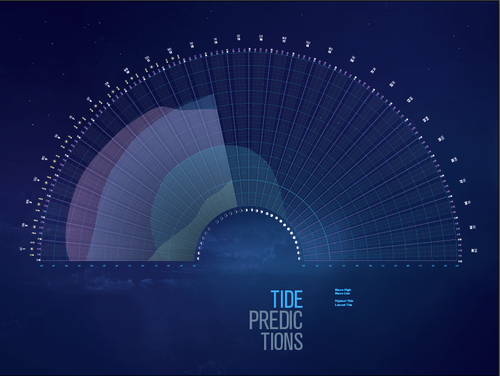
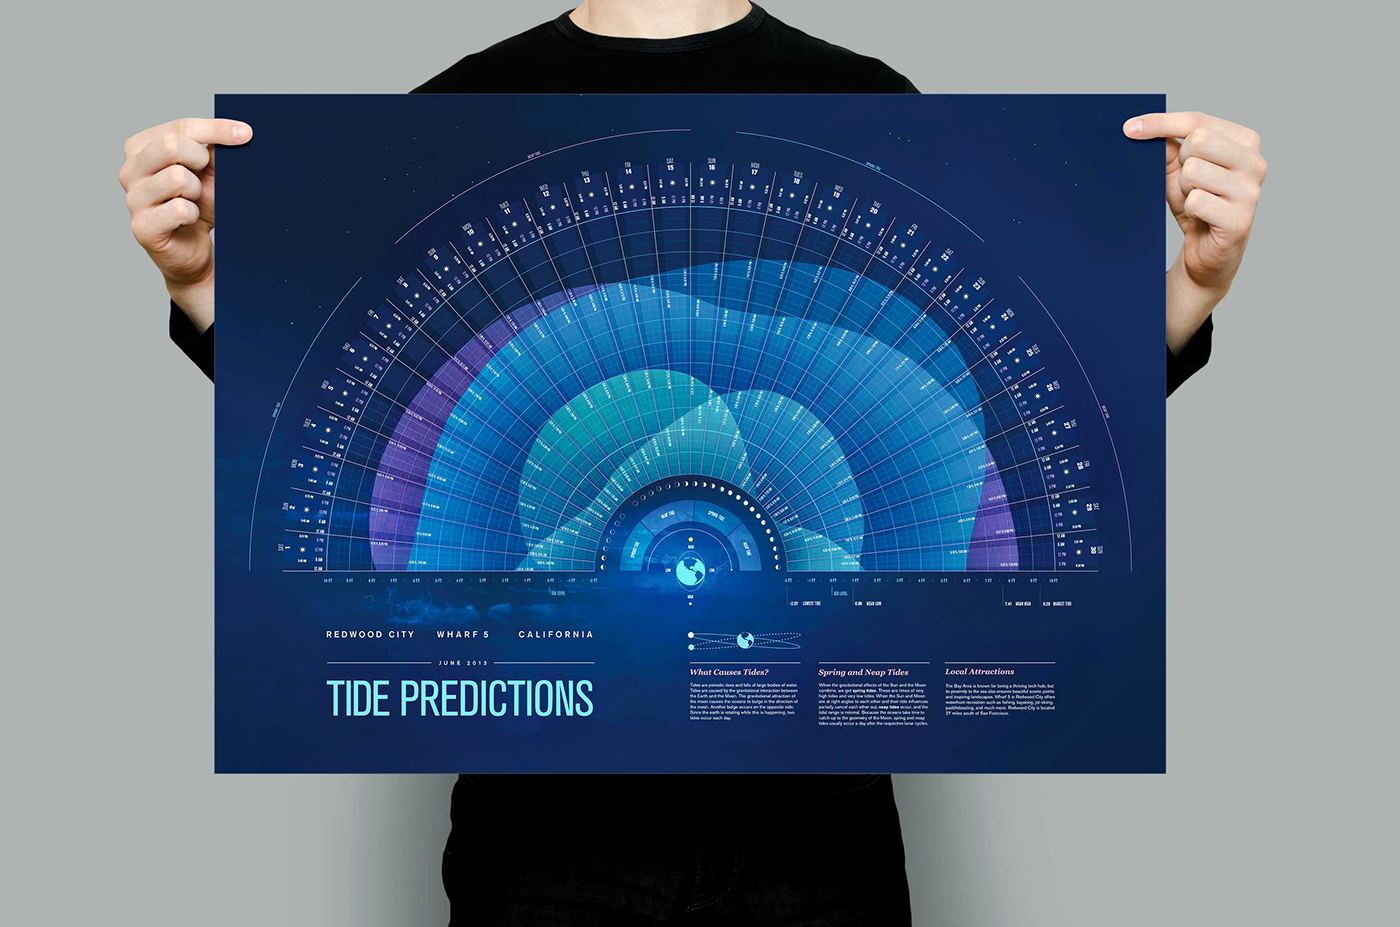
A lighter background with subtle incorporation of cosmic elements seemed to work better. I also felt the need to make the text just a touch bigger, with a bold setting, to hold its own against the strong blue of the background. I chose analogous colors for the tide waves so they would blend and overlap harmoniously.
Completion and final touches
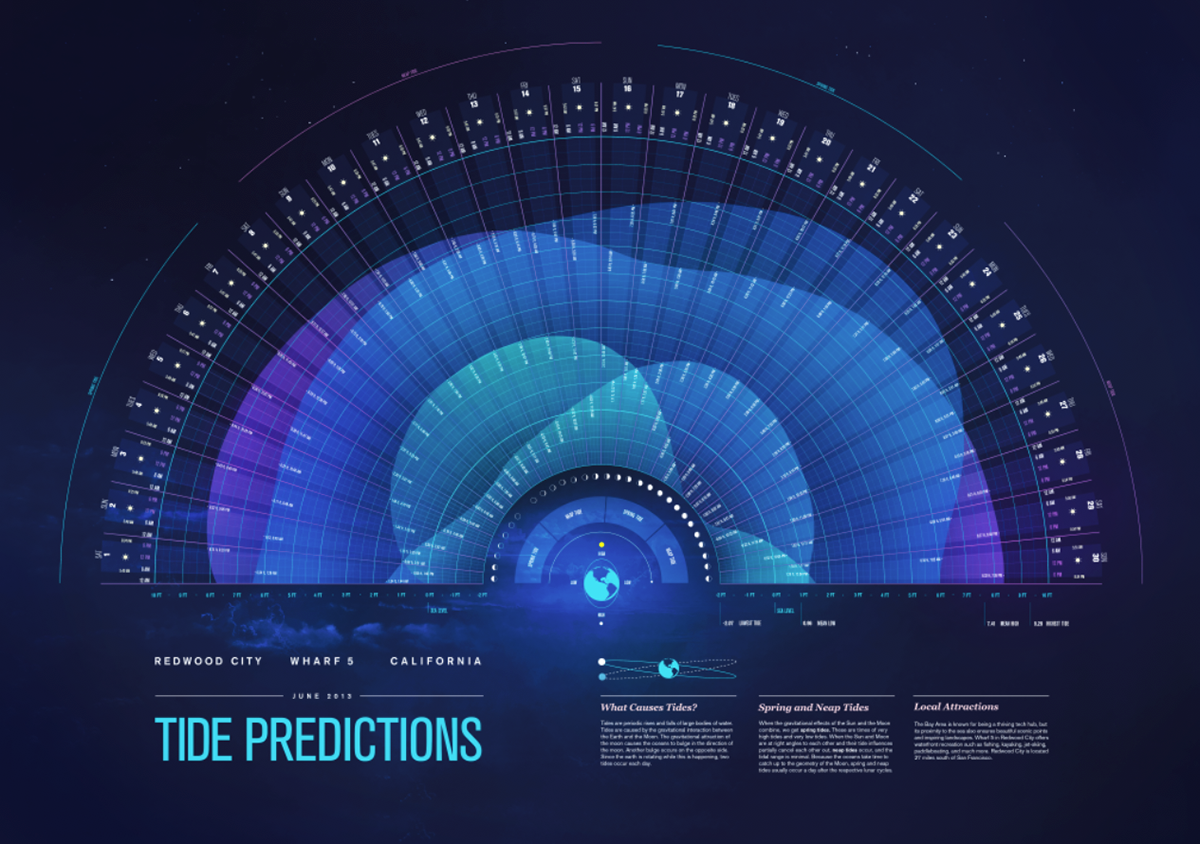
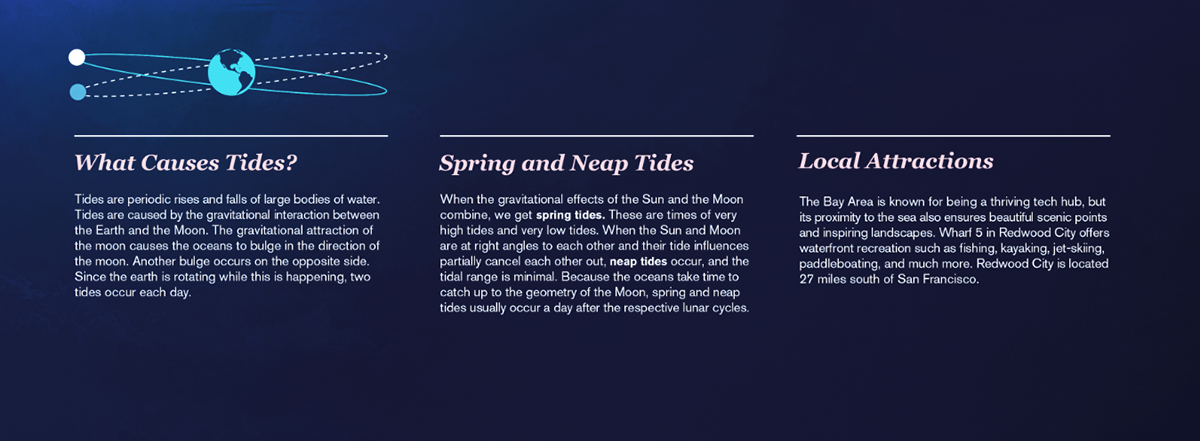
After incorporating the rest of the data, I laid out the title and other type to fall in the same gridlines as the radial chart. A little more tweaking was done to the type, lines, and tide waves to maintain visual hierarchy and provide better functionality.
After creating the infographic in Illustrator, I transferred the project over to Photoshop, where I added final touches on color and contrast for visuals that felt surreal and cosmic.
After creating the infographic in Illustrator, I transferred the project over to Photoshop, where I added final touches on color and contrast for visuals that felt surreal and cosmic.