
PROJECT
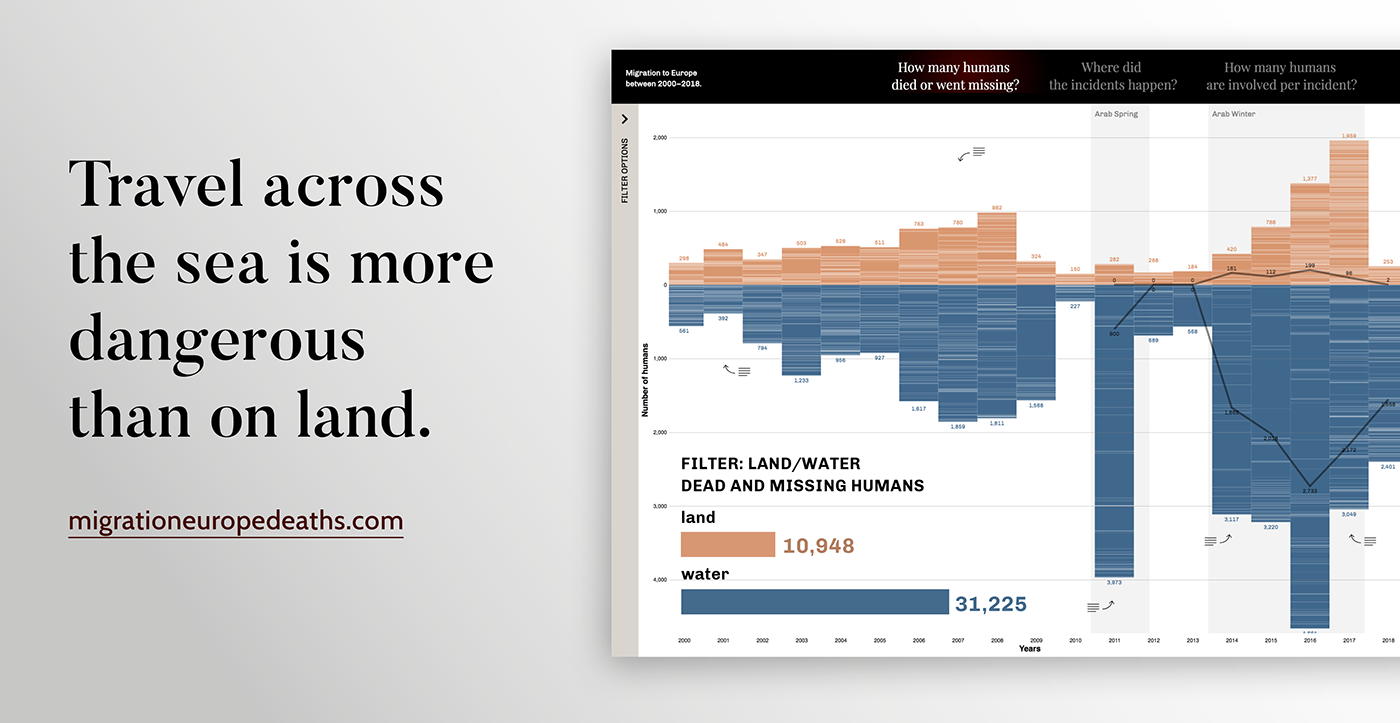
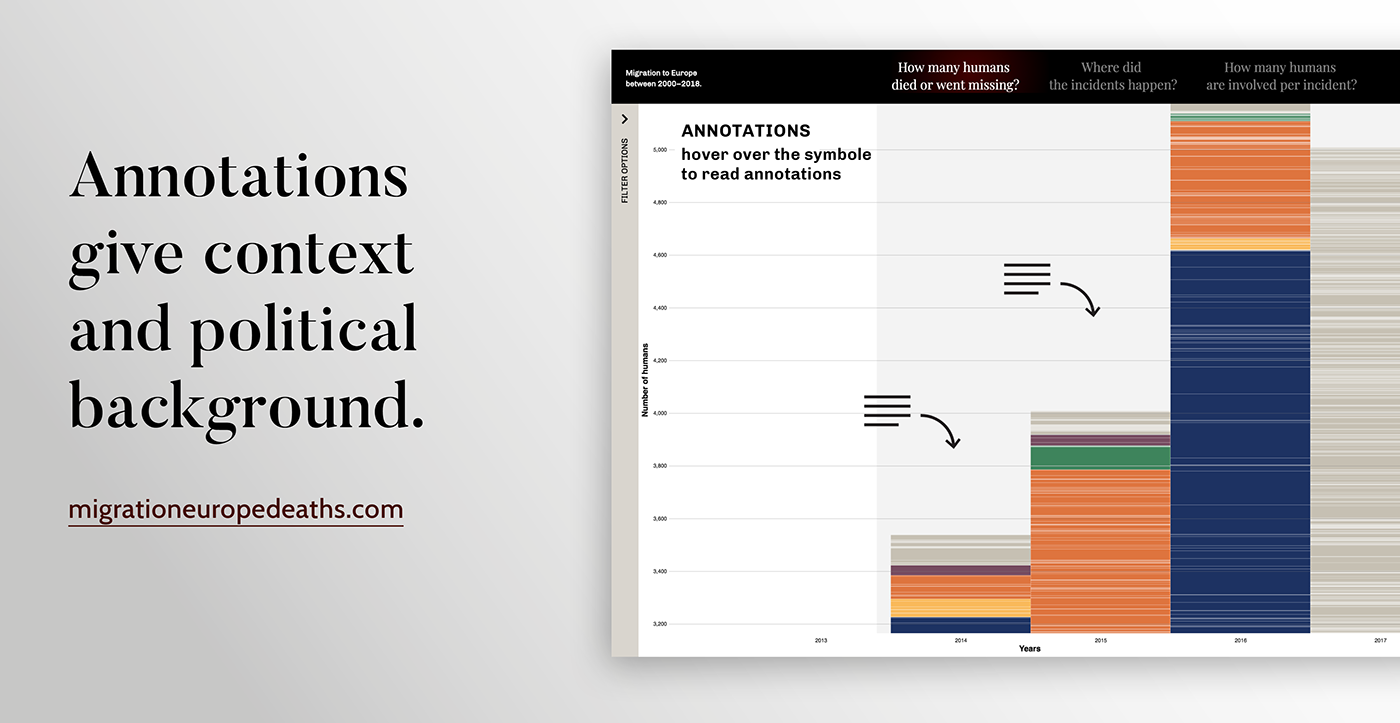
The aim of this data visualization is to discover the events of humans failing to reach Europe between 2000 and 2018. It allows readers to visualise incidents and the resulting casualties across common routes, accompanied by annotations that provide context and political background. Every incident is then further explained by a tooltip that gives deeper information about not just the deaths but also missing humans.
DATASET
Two datasets were merged to create this data visualization. Some data was not used as it was pertaining to different geographical areas or not relevant. Discrepancies in the data sets were not corrected as we felt it inappropriate to edit or manipulate the data itself.

TOOLTIP
Hovering the element shows a tooltip with deeper information about the incident.
Below the description, a bar displays the ratio of dead to missing humans for the selected incident.
Below the description, a bar displays the ratio of dead to missing humans for the selected incident.


visit us on Instagram: www.instagram.com/migrationeuropedeaths


