User Behavior - Quality Data
What.
Track user interactions (clicks - scroll - move).
Collect all quality data in one presentation hub.
why.
Define the most efficient UX flow for user behavior and user acquisition to enhance the flow and increase revenue.
Easy to generate and track daily, weekly, and monthly reporting.
How.
Create layout/design variations and generate A/B testing using Google Optimize..
Track user interactions/behavior by generating custom Google Tag Manager events triggering the click on some DOM element(s) or scroll to a specific DOM element(s) and convert it to mean-full Google Analytics events, PIWIK/Hotjar/Crazyegg heat and session recordings.
Collecting user behavior flow data. view in drow.io
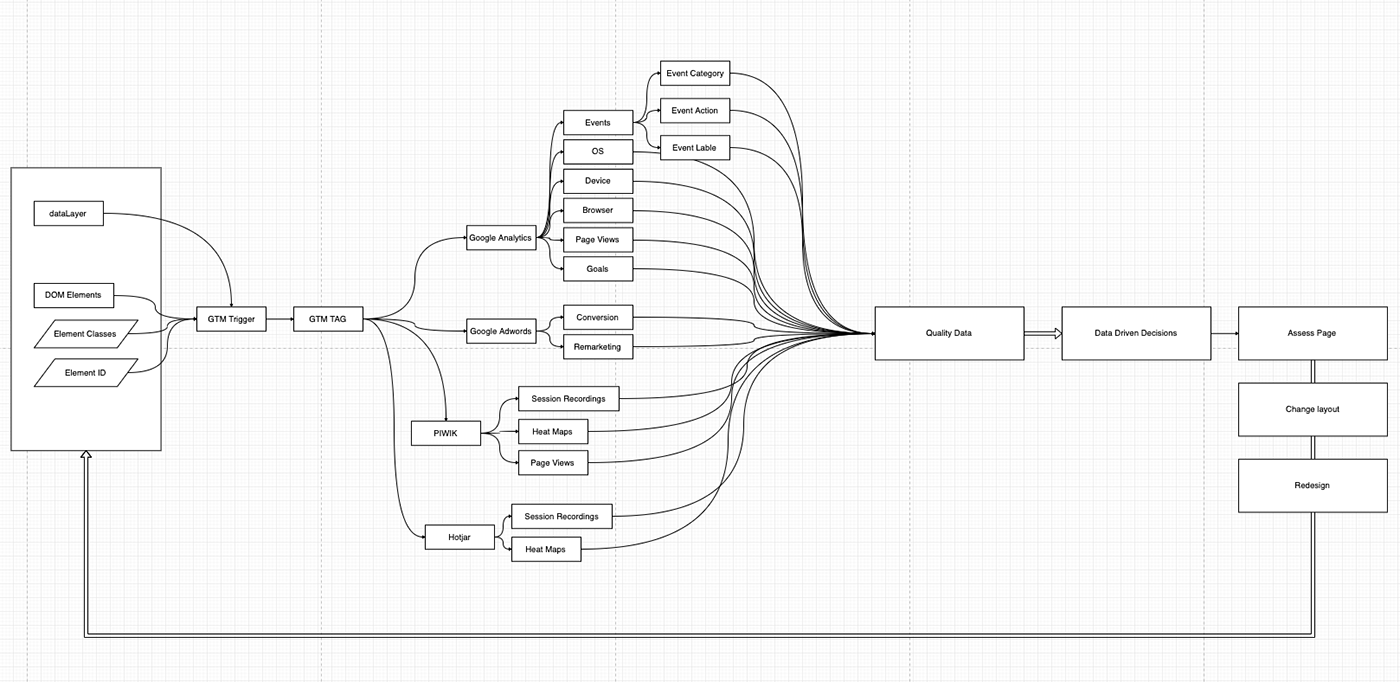
Collecting user behavior flow data.
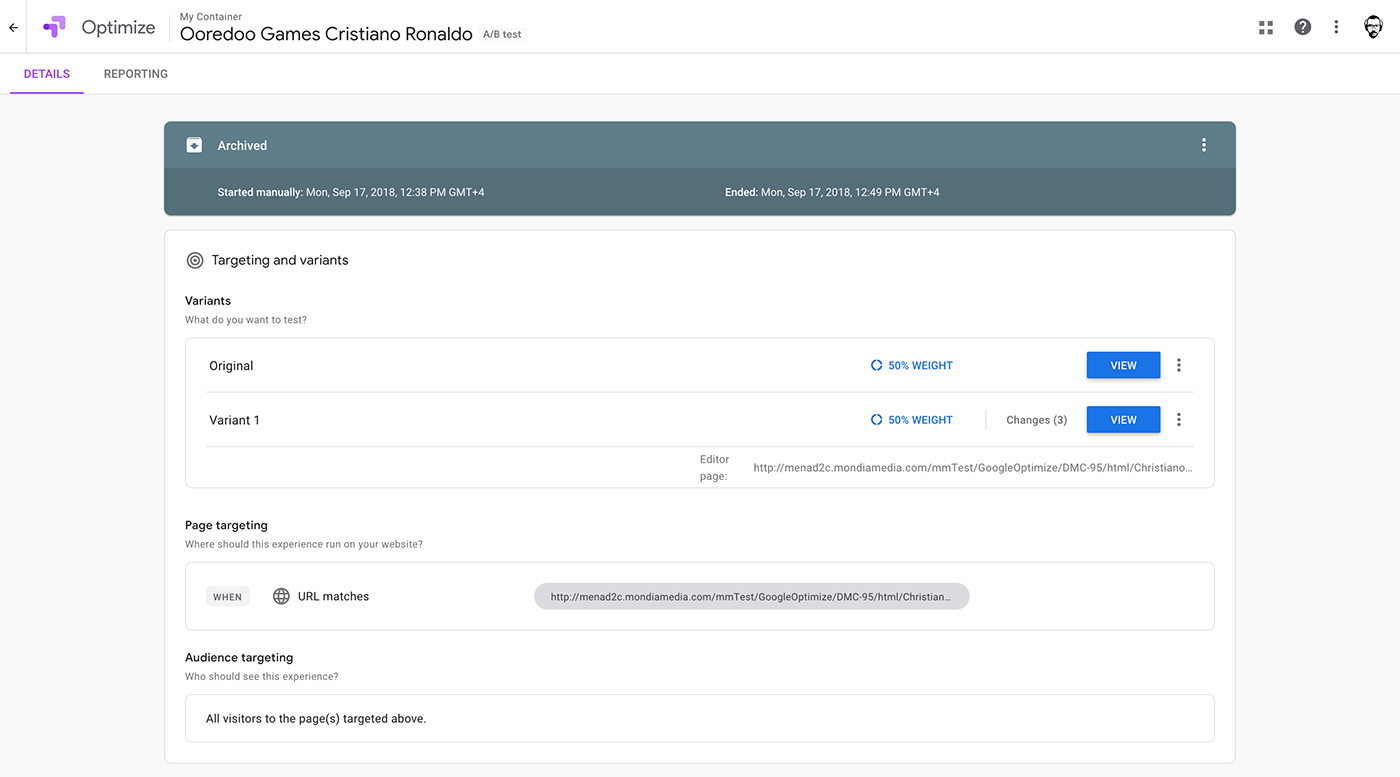
Create A/B testing with Google Optimize.
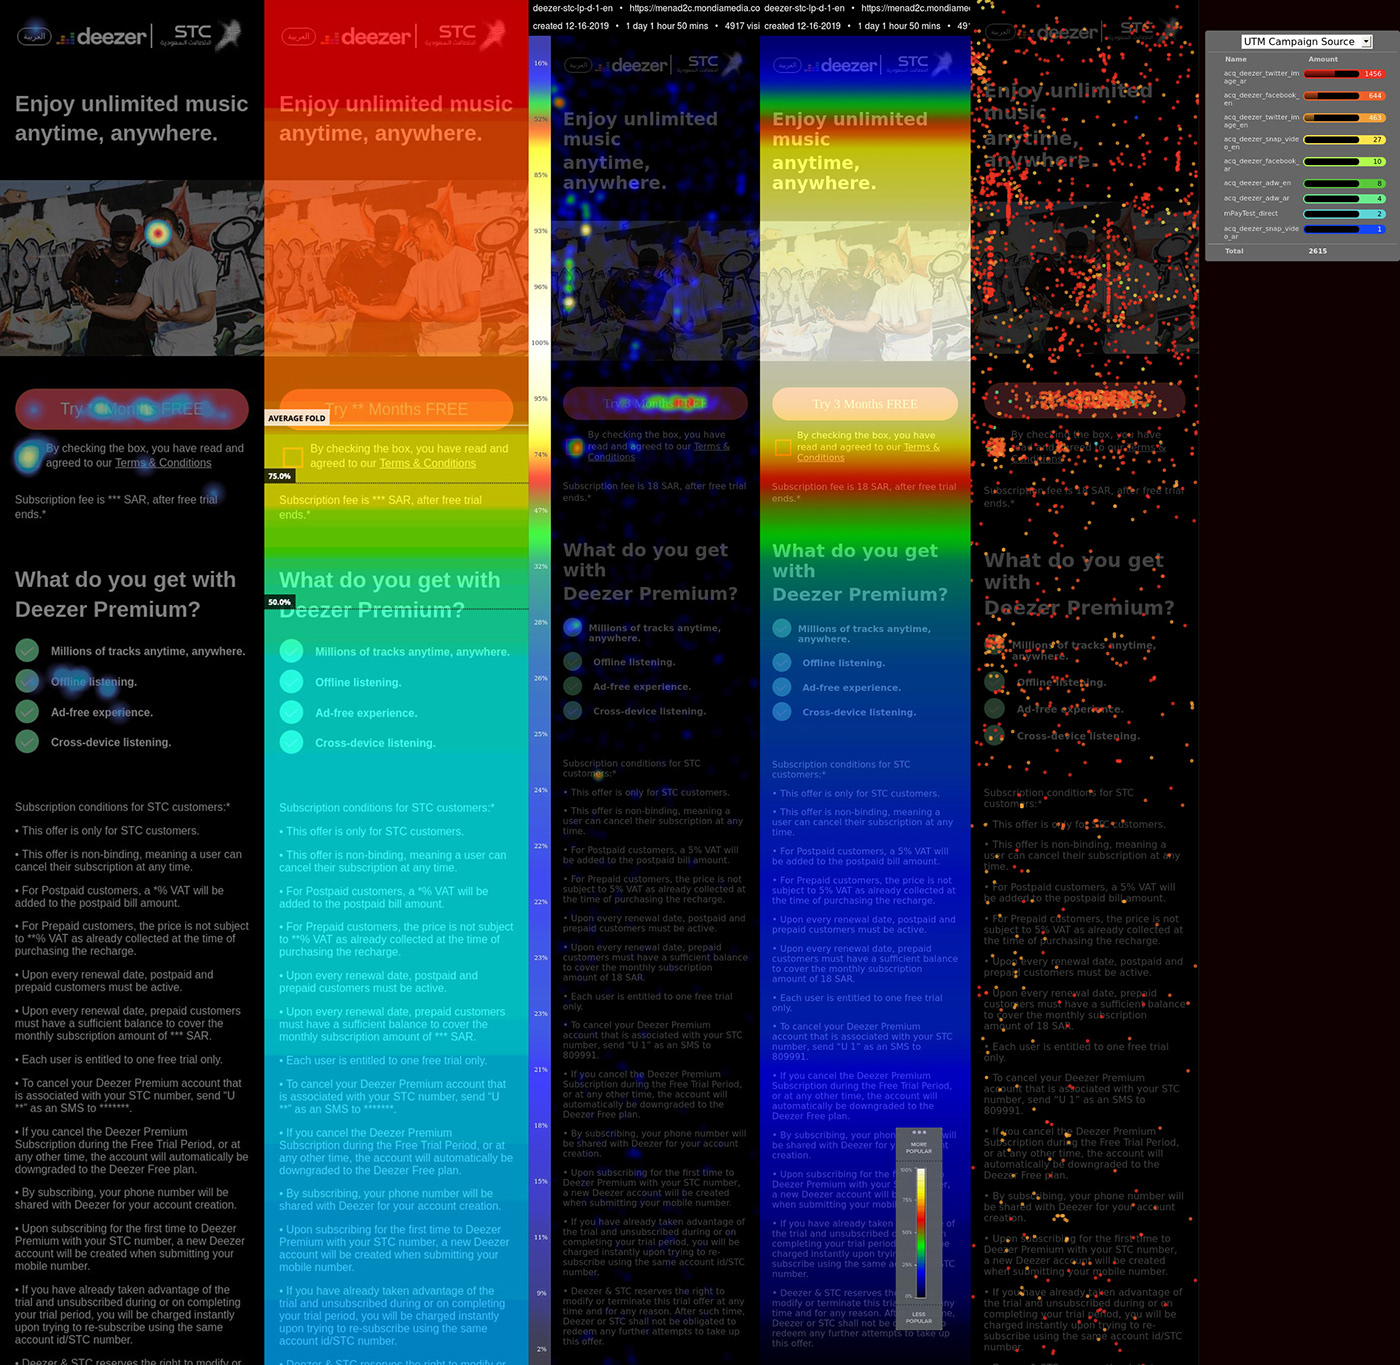
Hotjar - Crazyegg Heatmap
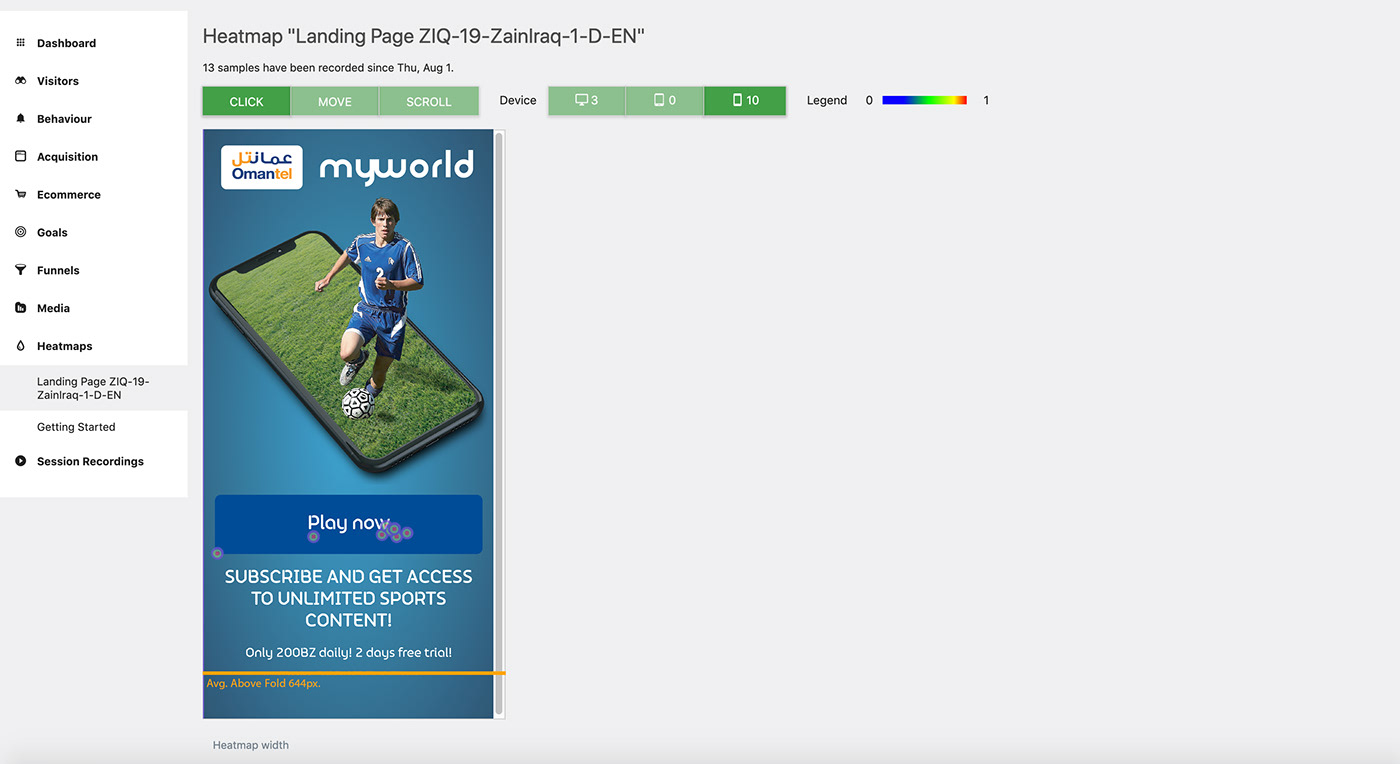
PIWIK Heat map.
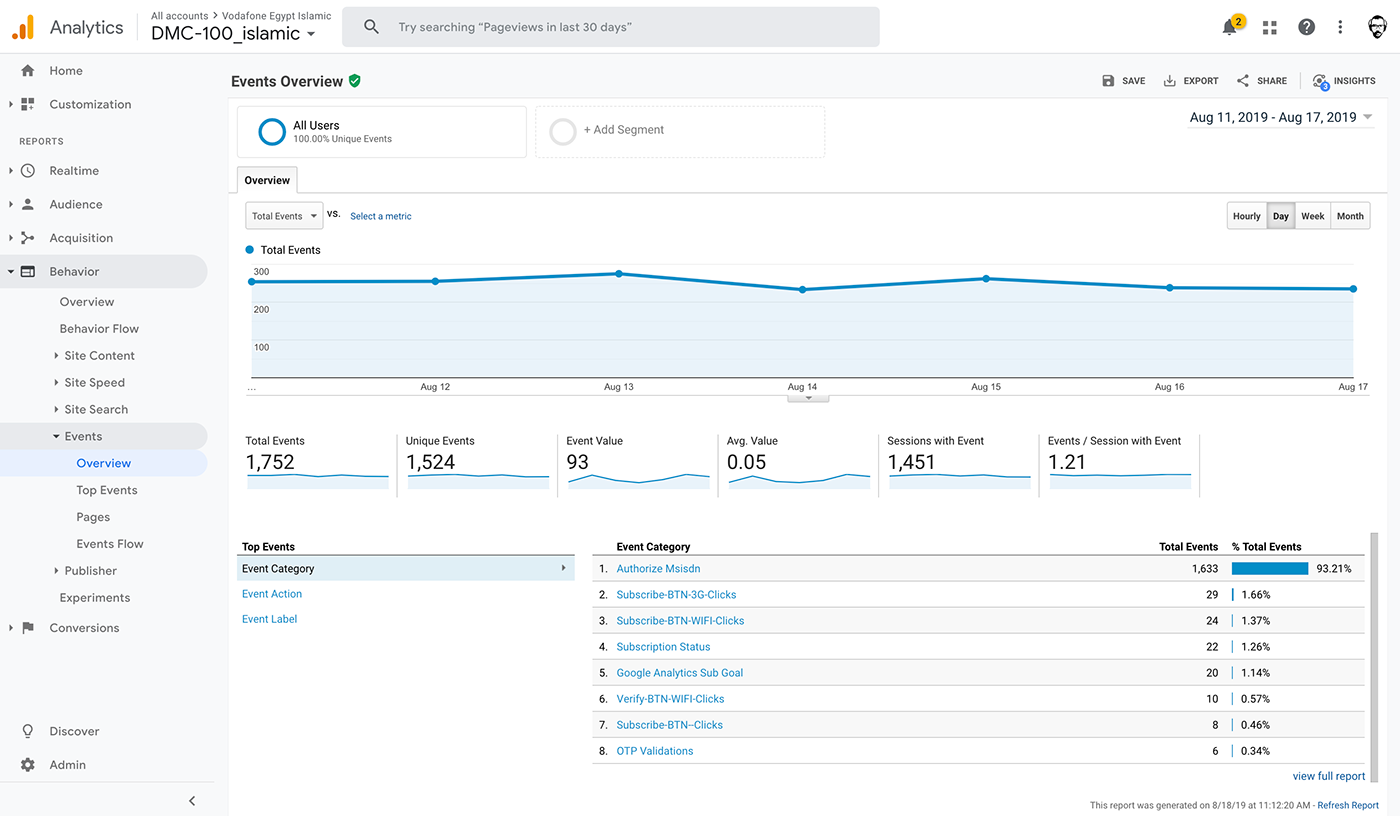
Google Analytics custom events.
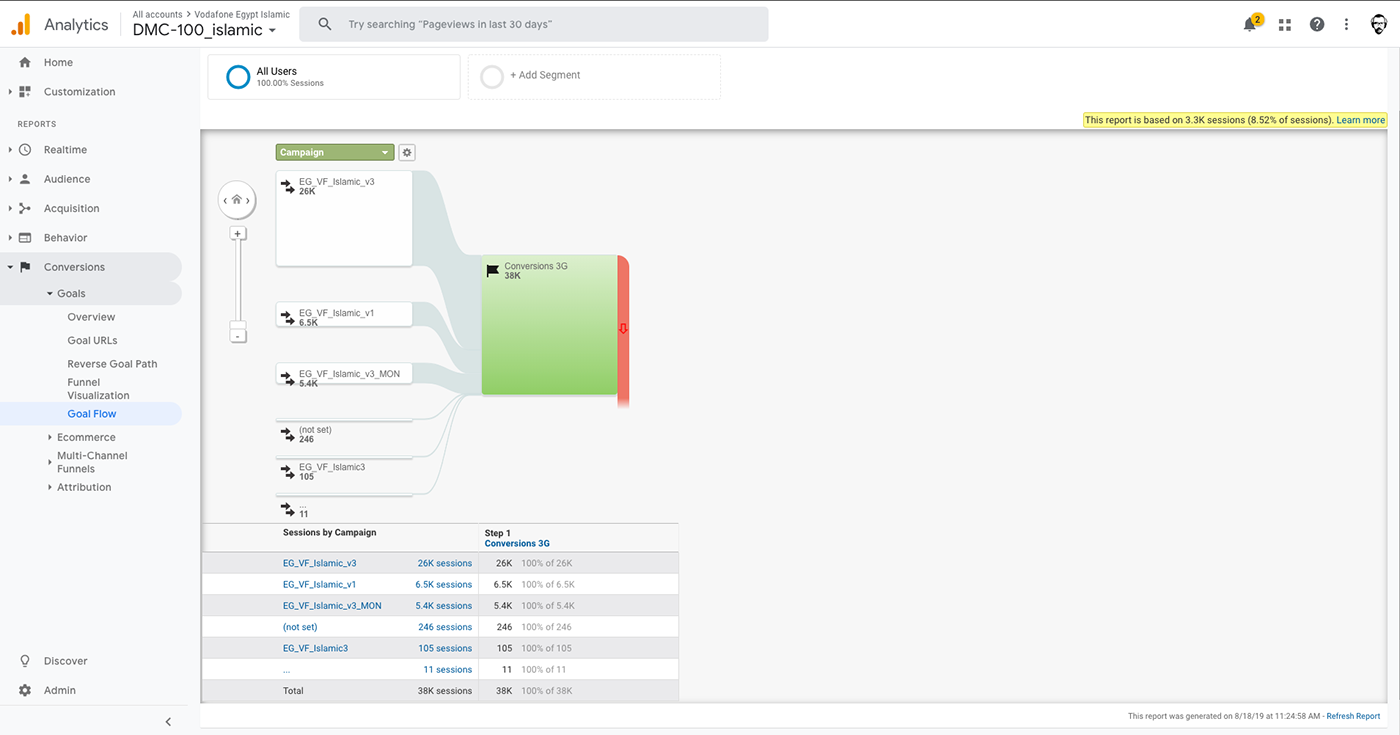
Google Analytics custom goals.

Google Data Studio presentation.


