The team at Data:re approached me one day to help them polish up the current state of their MVP as well as work on upcoming features as they come up. The idea is to create a dashboard for sales, marketing and product departments inside insurance companies to get real time insights into their product-market fit as well as help them position new products and marketing campaigns better.
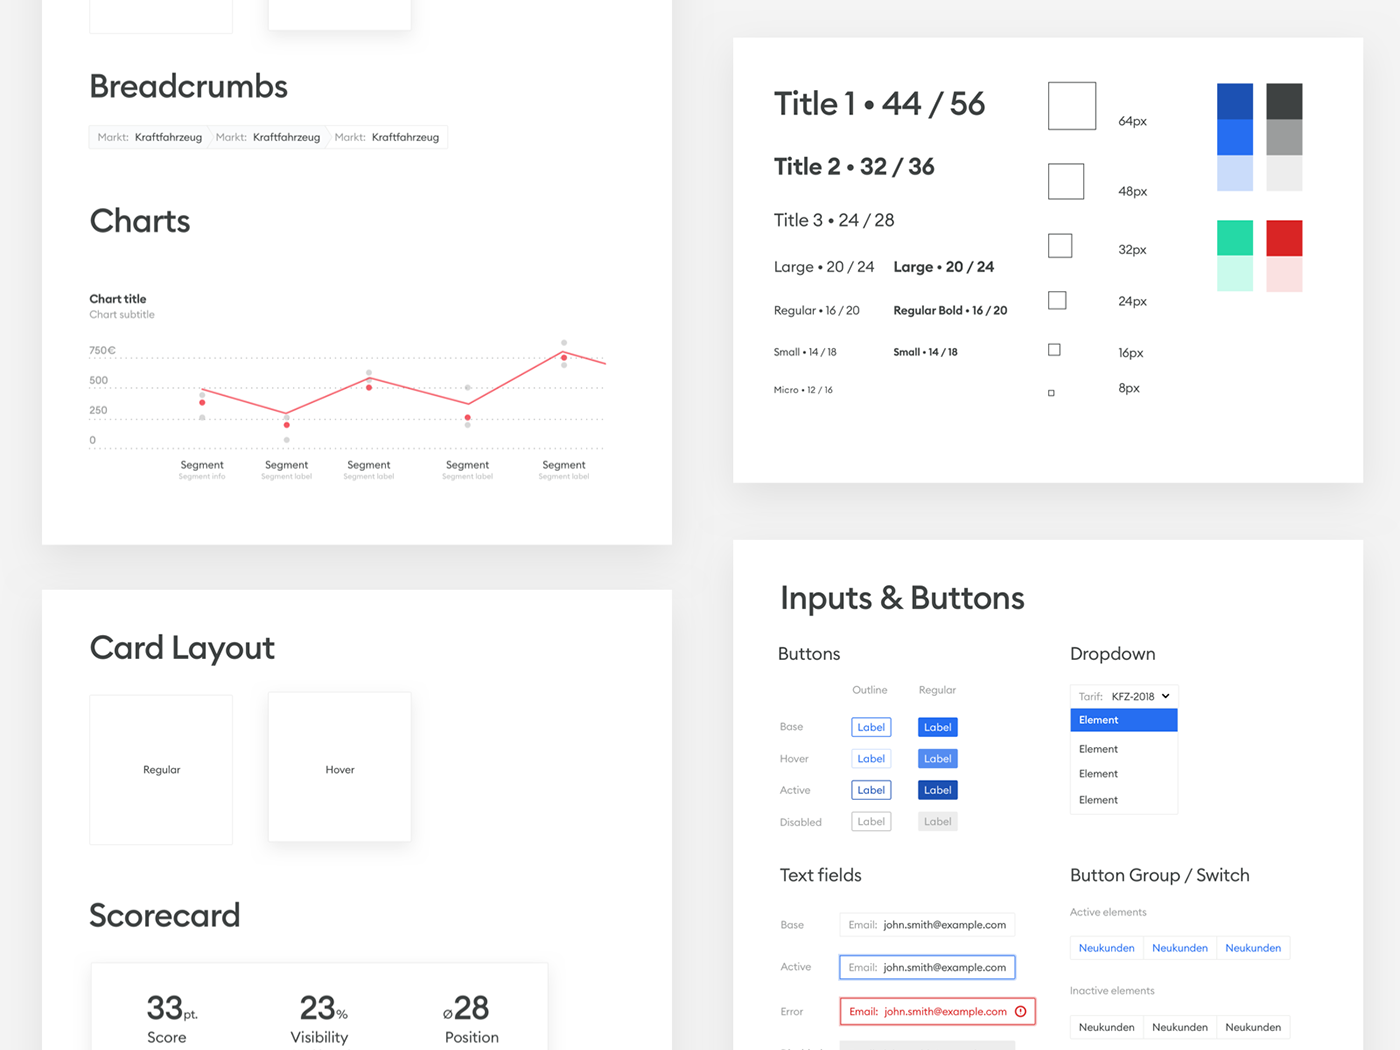
The work begun with cleaning up the current state of the application, structuring and cleaning up the design, and moving reusable parts of the interface to a component library to be able to generate high quality prototypes quicker and more efficiently.
My part of work was mostly focusing on user experience, from figuring out what might be the optimal user flow to creating prototypes in Marvel and handing off approved work to development.
In the process, we have worked on creating all sorts of data visualization cards that could be used across the dashboard view as well as reports being sent to the users. One of the most fun challenges to solve was figuring out which data visualization method works best for certain use cases, as well as making sure that the users understand that while they can manipulate two inputs (positions they're targeting on comparison websites and market size), one depends on the other.
It all started with sketching out the flows and requirements, as well as scouring through a lot of data visualization methods to find the perfect one (also, I got to read through entire "Storytelling with Data" thanks to this project):


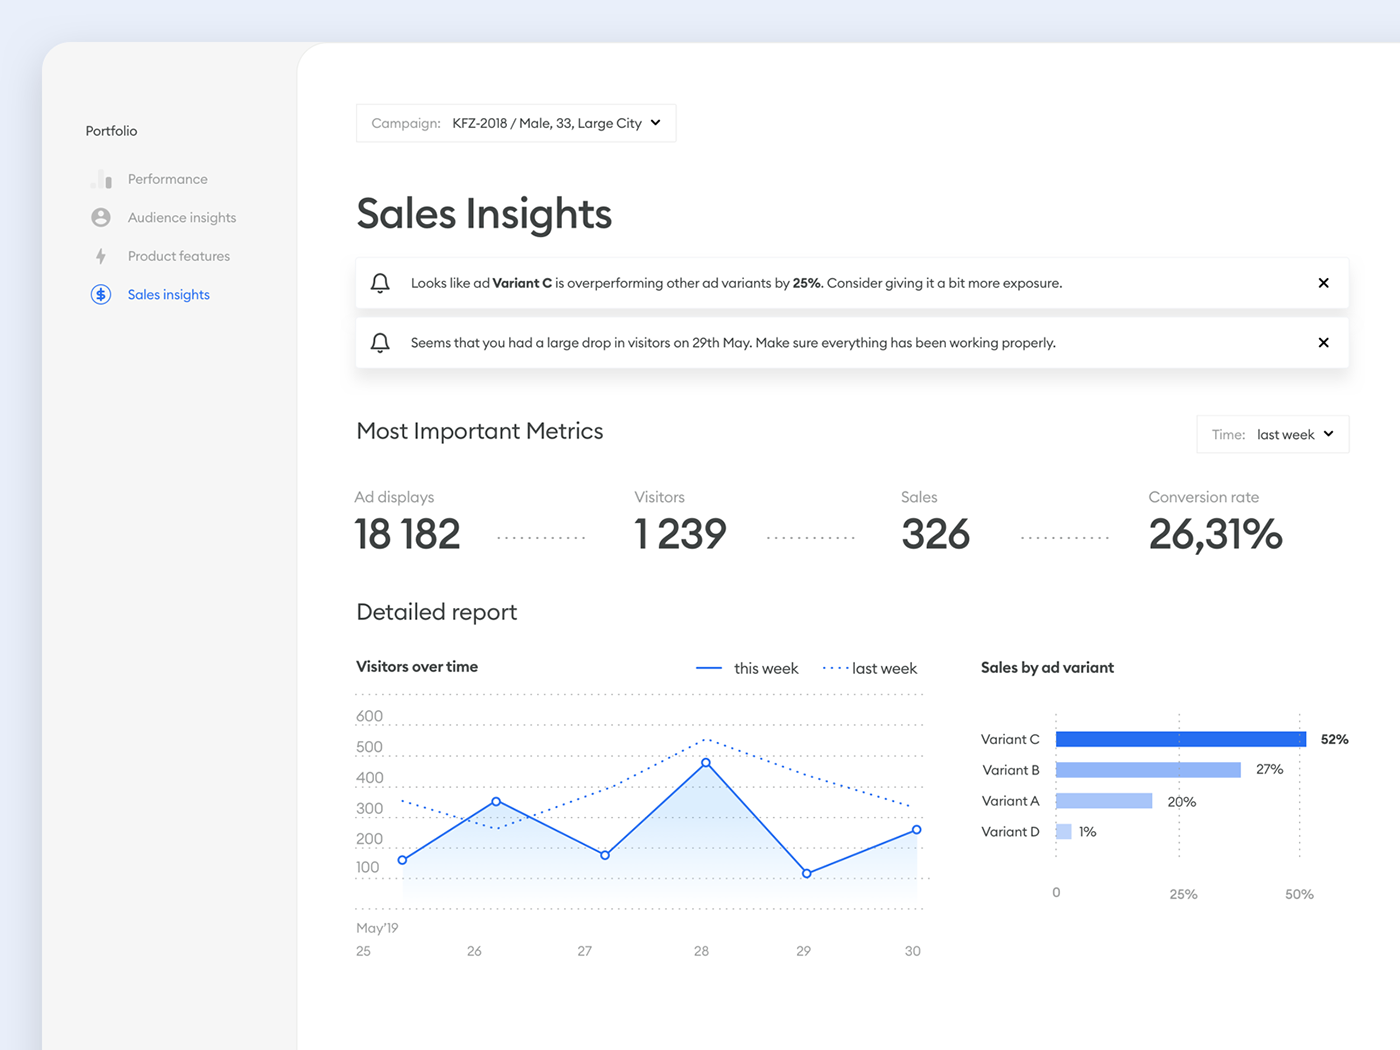
And ended with polished, modular component library that could be implemented across the product as cards:

One important part of the project was making sure that even less technical users in marketing and sales departments understand how to use the product.
Clarity of information was job one, so we've spent quite a bit of time on a comprehensive user onboarding and explanation infrastructure to make sure everyone understands what's going on.

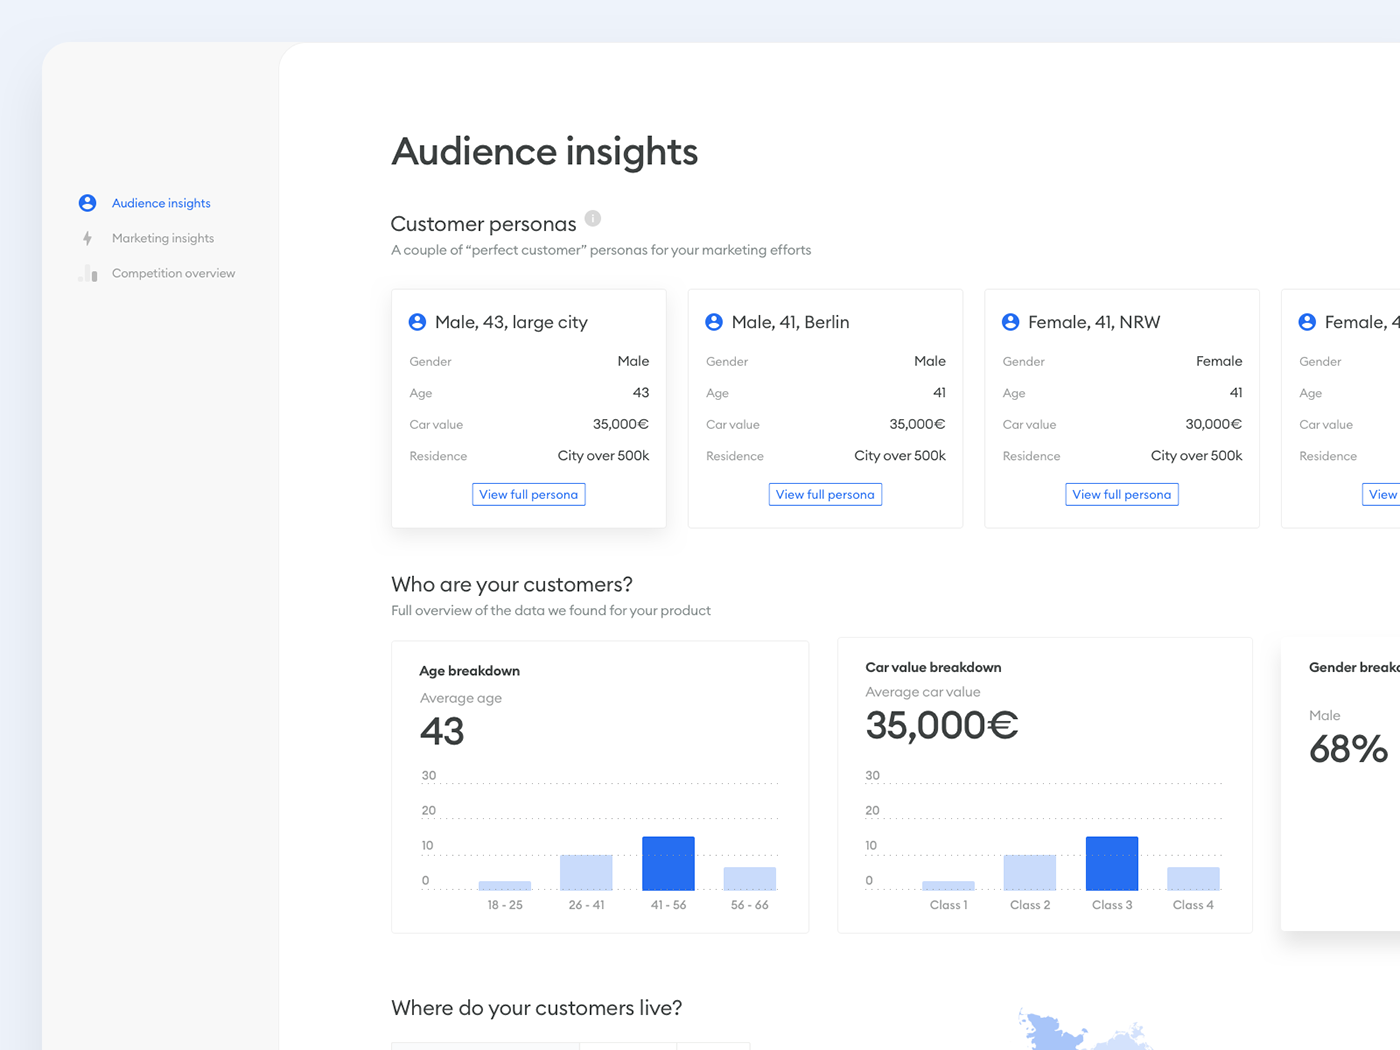
One of the “killer apps” we were able to come up with during our feature brainstorming sessions and user interviews was gathering the available data into user-friendly personas that could be reused in advertising campaigns as well as sales processes to make sure the customers are targeting the right market with their products.
The goal was — as previously — understanding the data easier and helped them understand who are the people they are selling for.
One of the side ideas that we explored was creating a marketing insights view, in which the user could install a pixel on the landing page connected to their campaign to see if the data provided by us works.
The product itself is currently in development and should be coming soon.
Thanks for reading!