My maps showcase (2017-2018)
Cover. Part of Cherkasy printed map
The most used tools by me
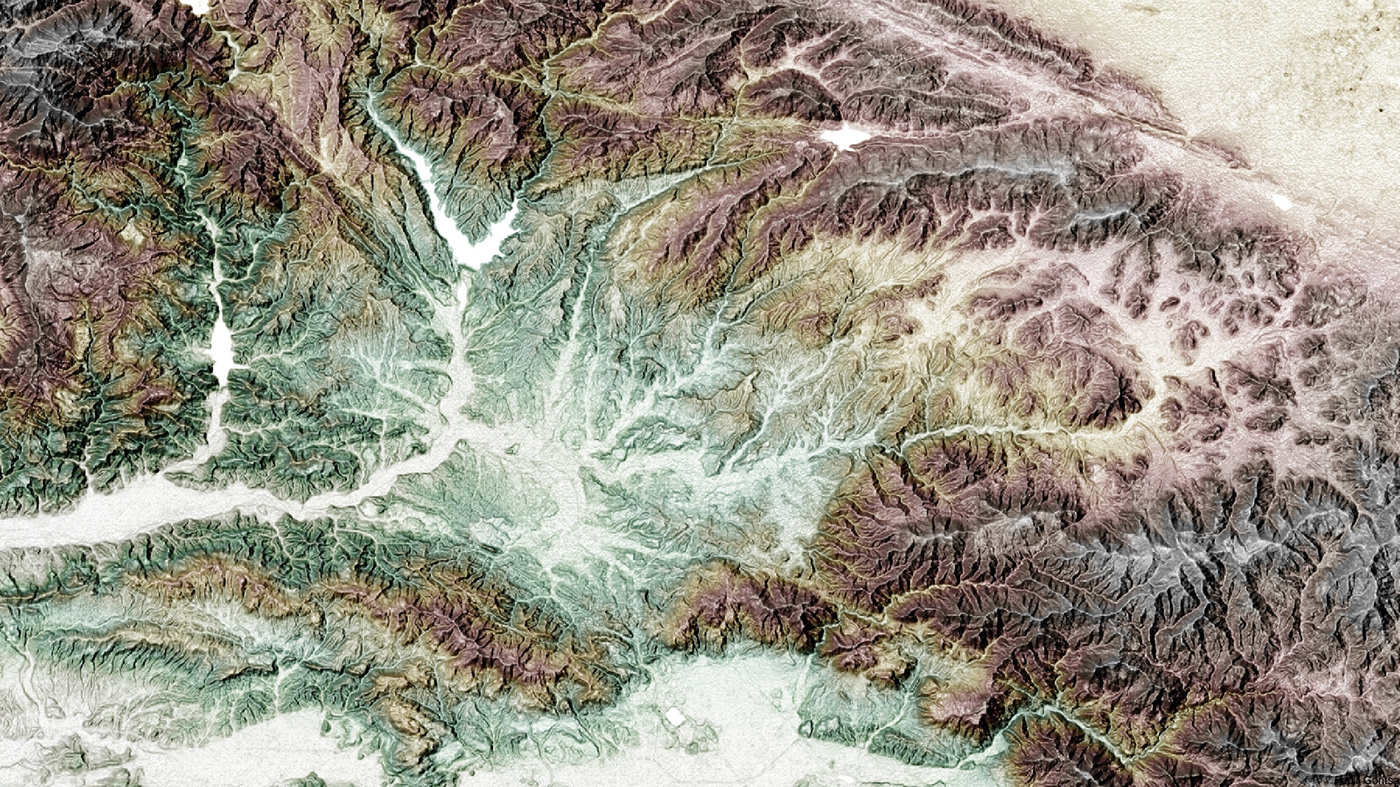
Somewhere at dawn in the Swiss Alps.
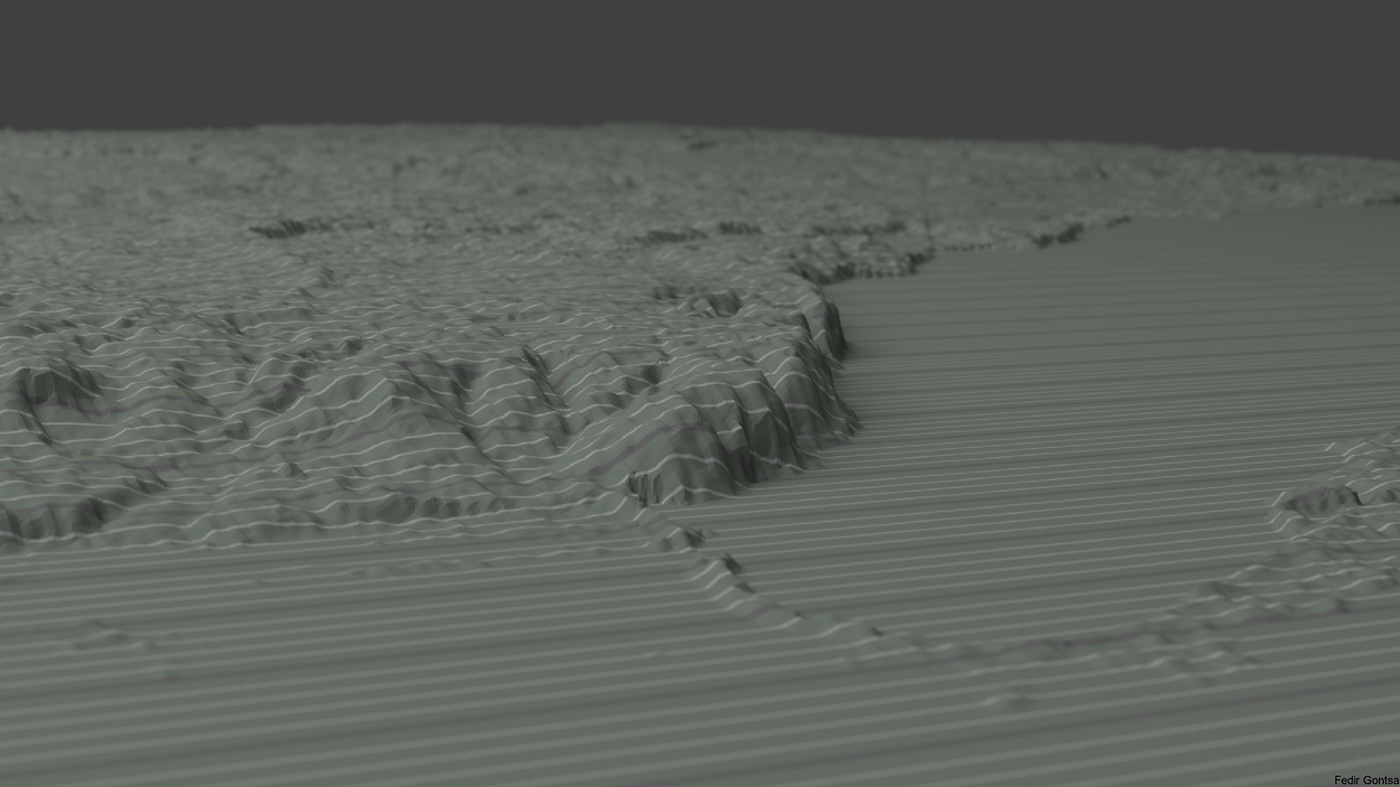
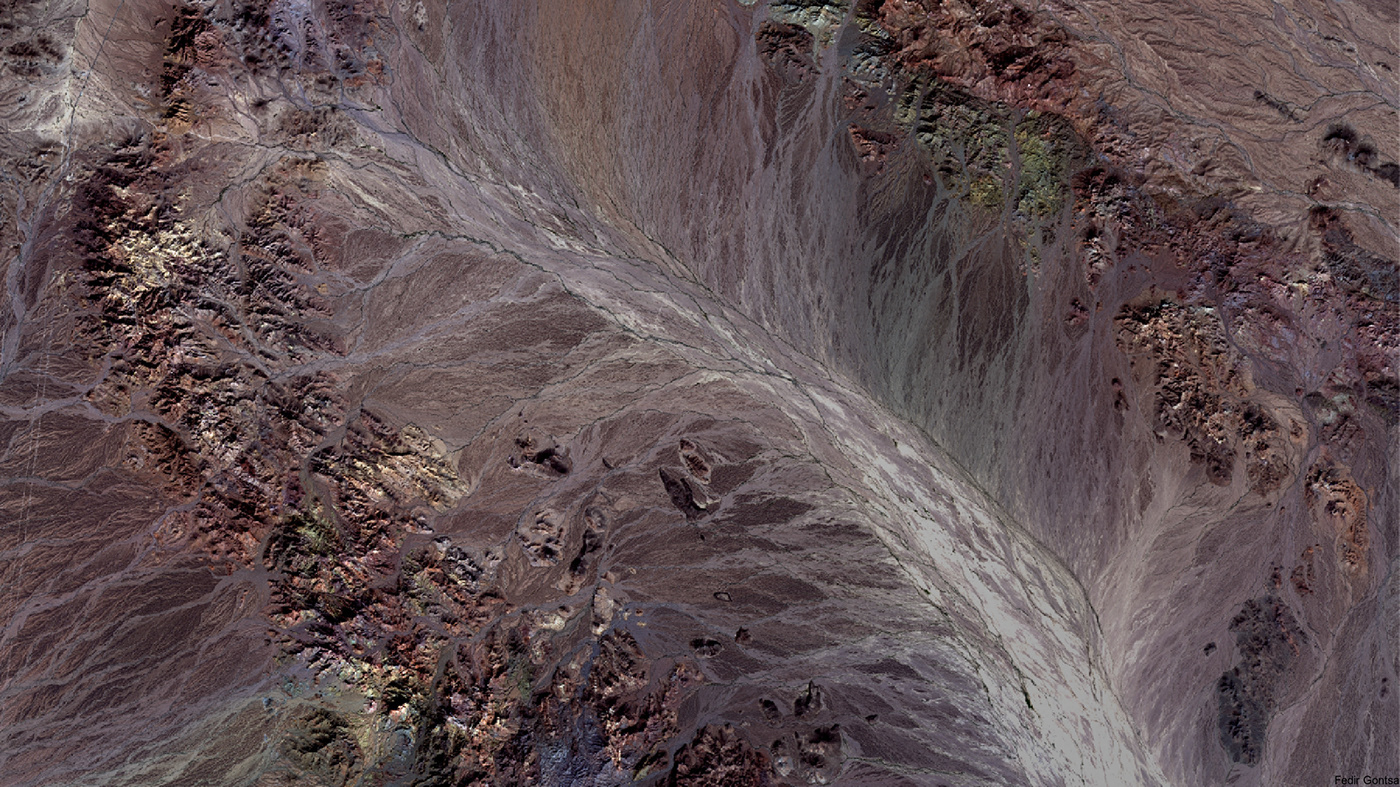
Part of the Bernese Alps, part of the Grimsel Pass.
A mountain range of the Alps, located in Switzerland.
Scale: 500,000
Source: Sentinel-2A, SRTM
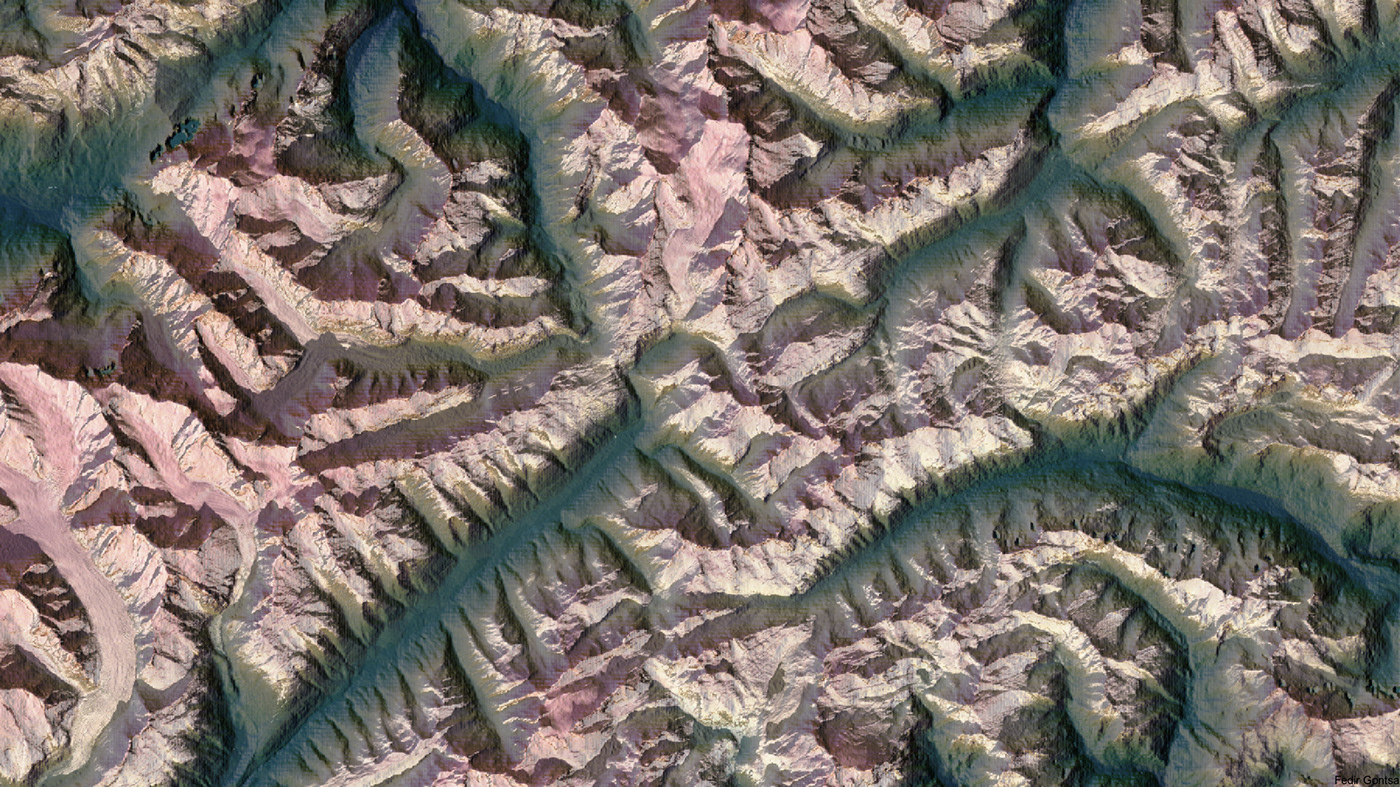
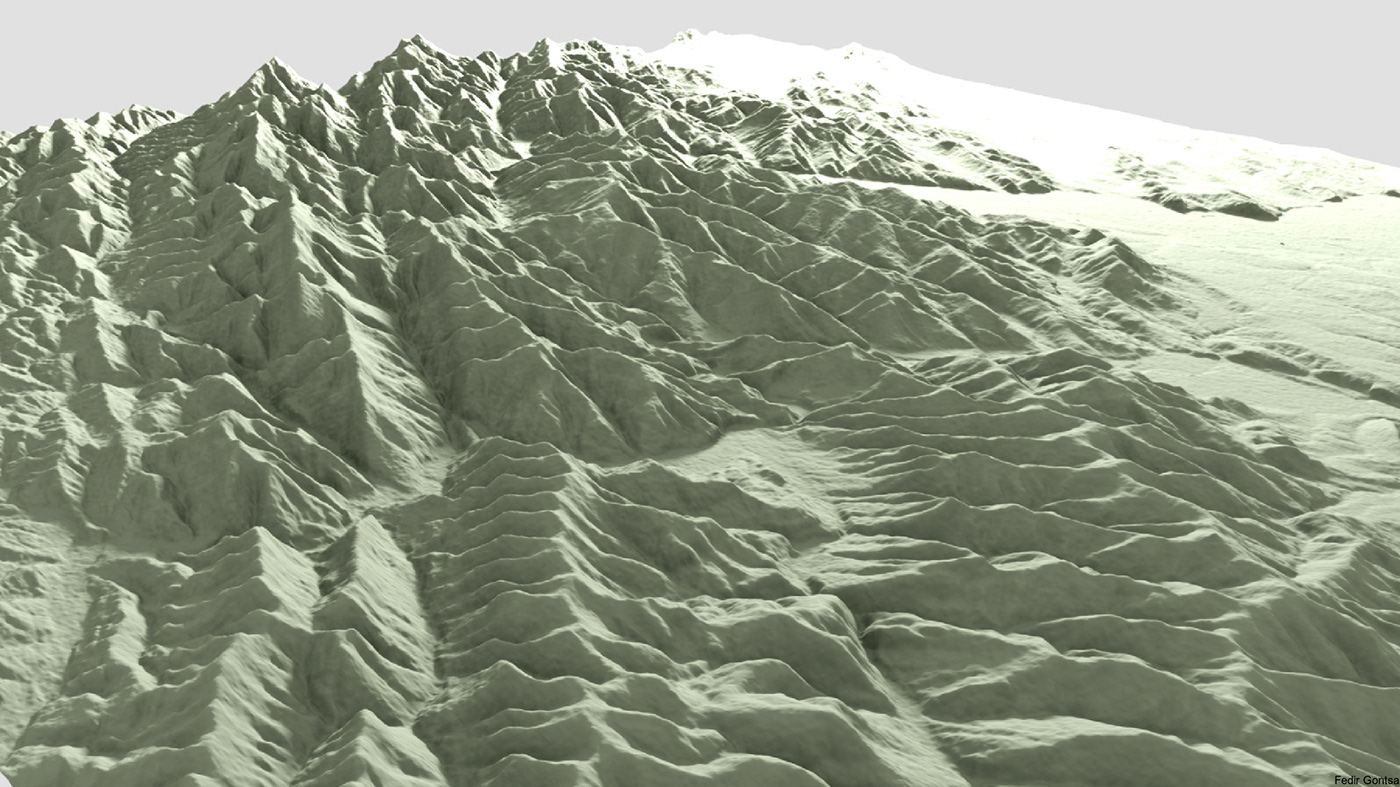
Part of the Bernese Alps, part of the Grimsel Pass.
A mountain range of the Alps, located in Switzerland.
Scale: 500,000
Source: Sentinel-2A, SRTM
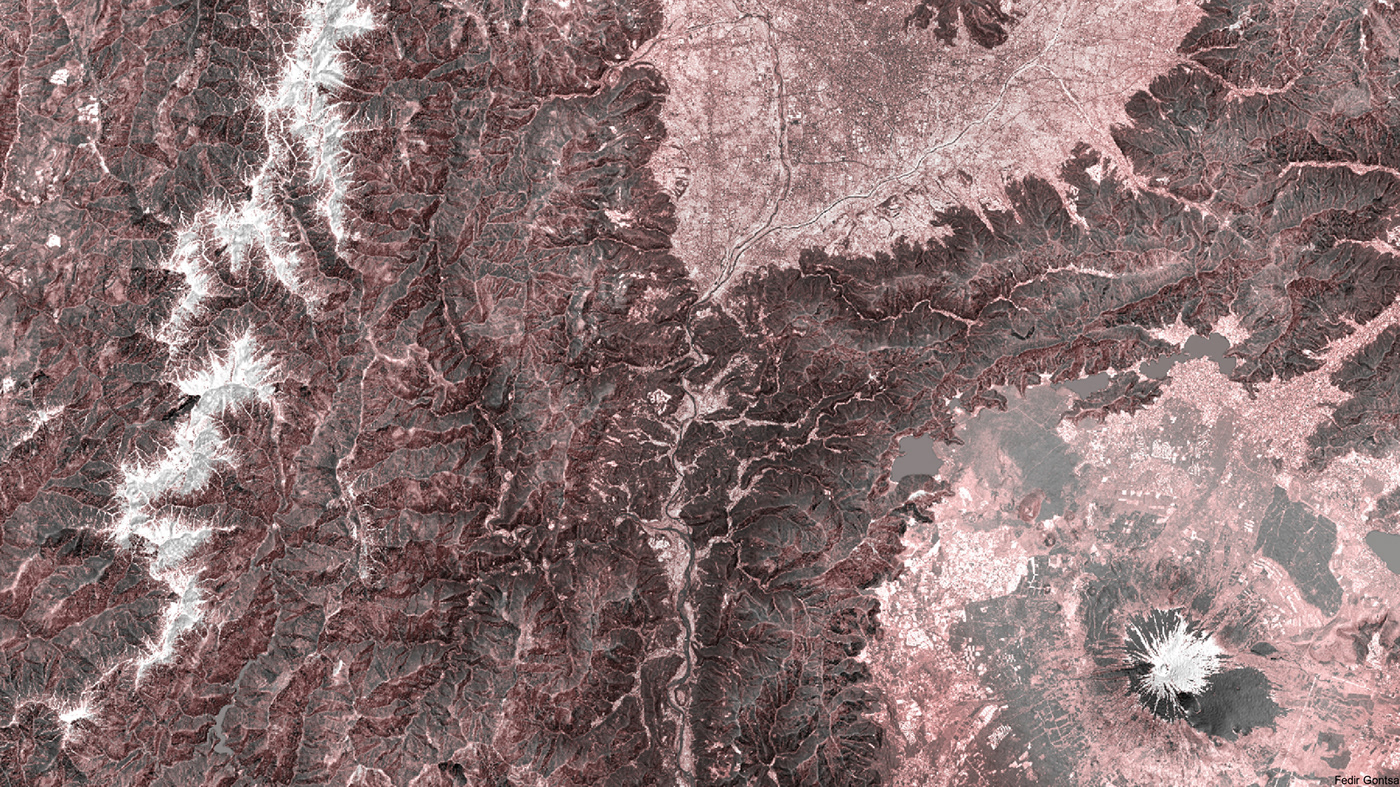
(富士山 Fujisan) located on Honshu Island, is the highest mountain in Japan at 3,776.24 m.
Data: Sentinel 2A, SRTM
Data: Sentinel 2A, SRTM
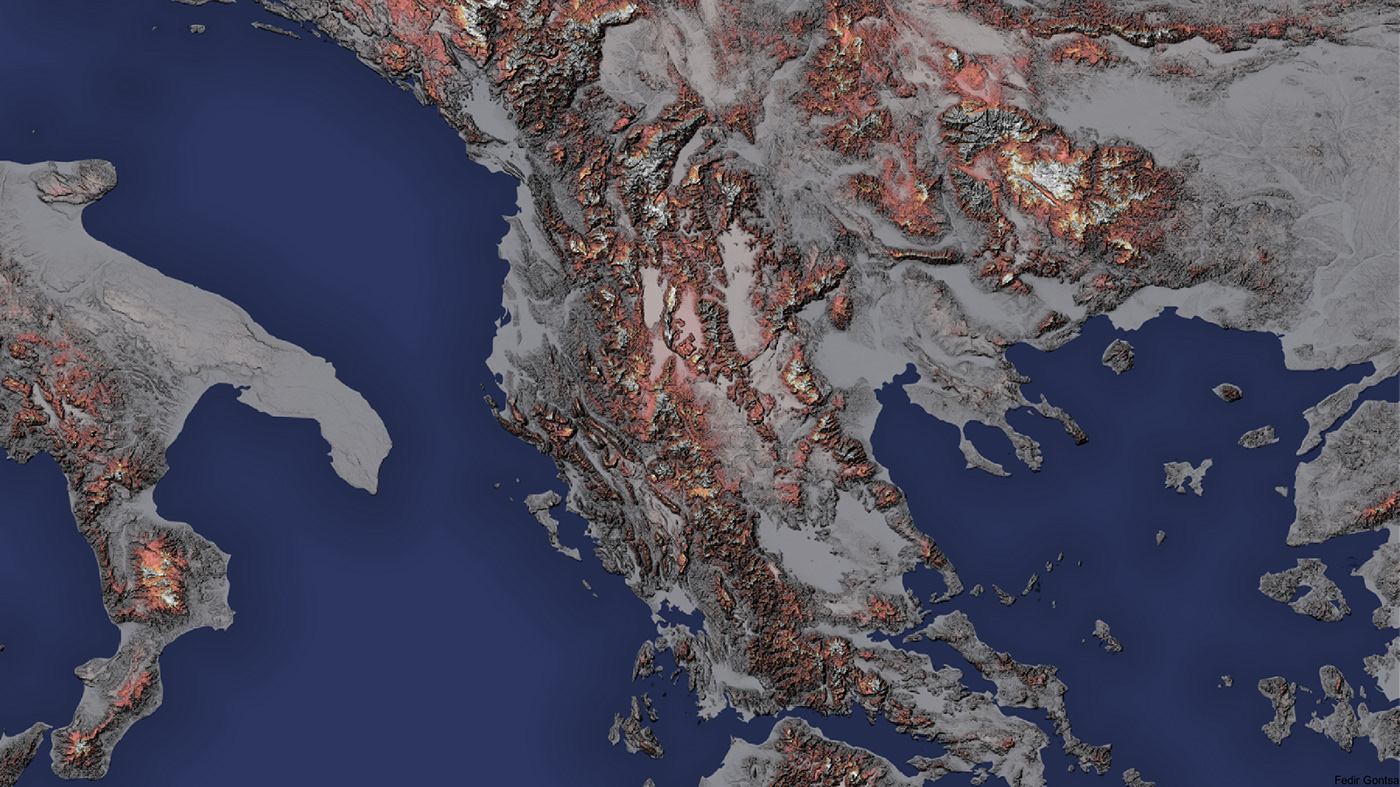
The Balkans are the birthplace of many cultures and peoples.
The Balkans, or the Balkan Peninsula, is a geographic area in Eastern and Southeastern Europe.
Data: GMTED2010
The Balkans, or the Balkan Peninsula, is a geographic area in Eastern and Southeastern Europe.
Data: GMTED2010

Medobory Hills.
Medobory-Toltry (Tovtry) ridge.
This is the only mountain ridge in the world that appeared not due to tectonic processes but formed by living organisms - an ancient barrier reef formed by the sea in the Miocene period.
Source: SRTM + OpenStreetMap
Medobory-Toltry (Tovtry) ridge.
This is the only mountain ridge in the world that appeared not due to tectonic processes but formed by living organisms - an ancient barrier reef formed by the sea in the Miocene period.
Source: SRTM + OpenStreetMap
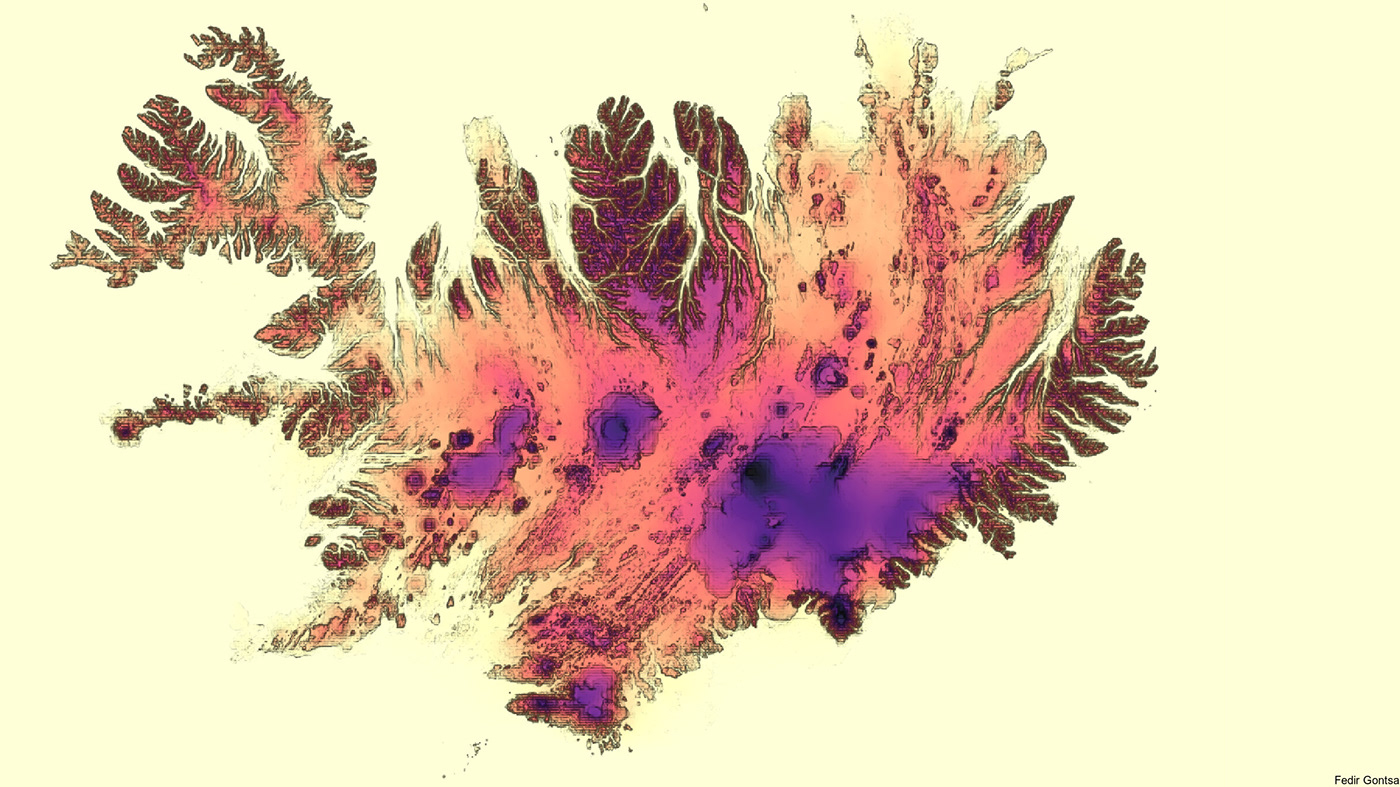
Iceland.
Combined digital terrain model.
Scale: 1:9 000 000
Data: GMTED2010
Combined digital terrain model.
Scale: 1:9 000 000
Data: GMTED2010
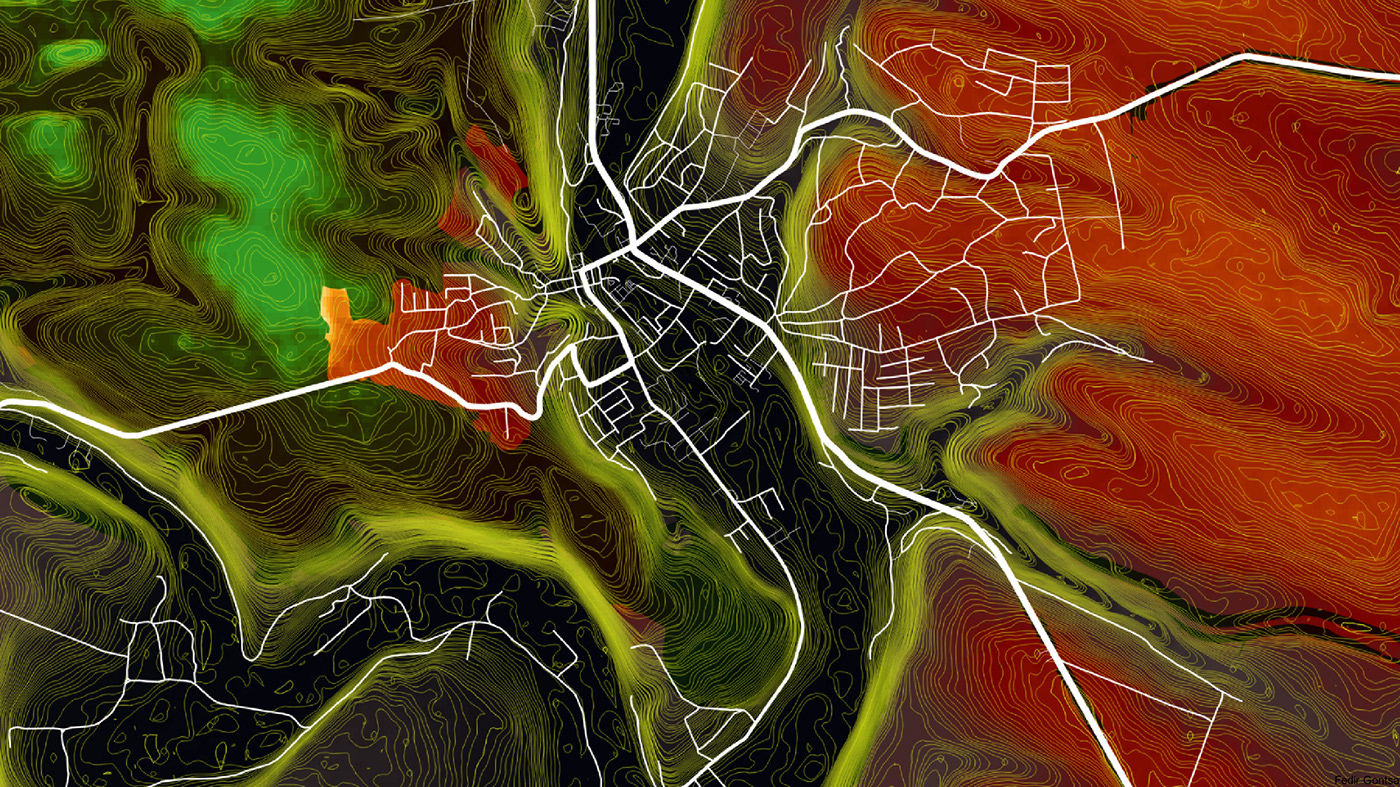
Terebovlya on the Galicia Podillya, administrative center of the Terebovlya district in the Ternopil region.
Digital Abstract model
Source: SRTM, OpenStreetMap
Digital Abstract model
Source: SRTM, OpenStreetMap
Carpathians.
Data: SRTM
Data: SRTM
Software: Blender
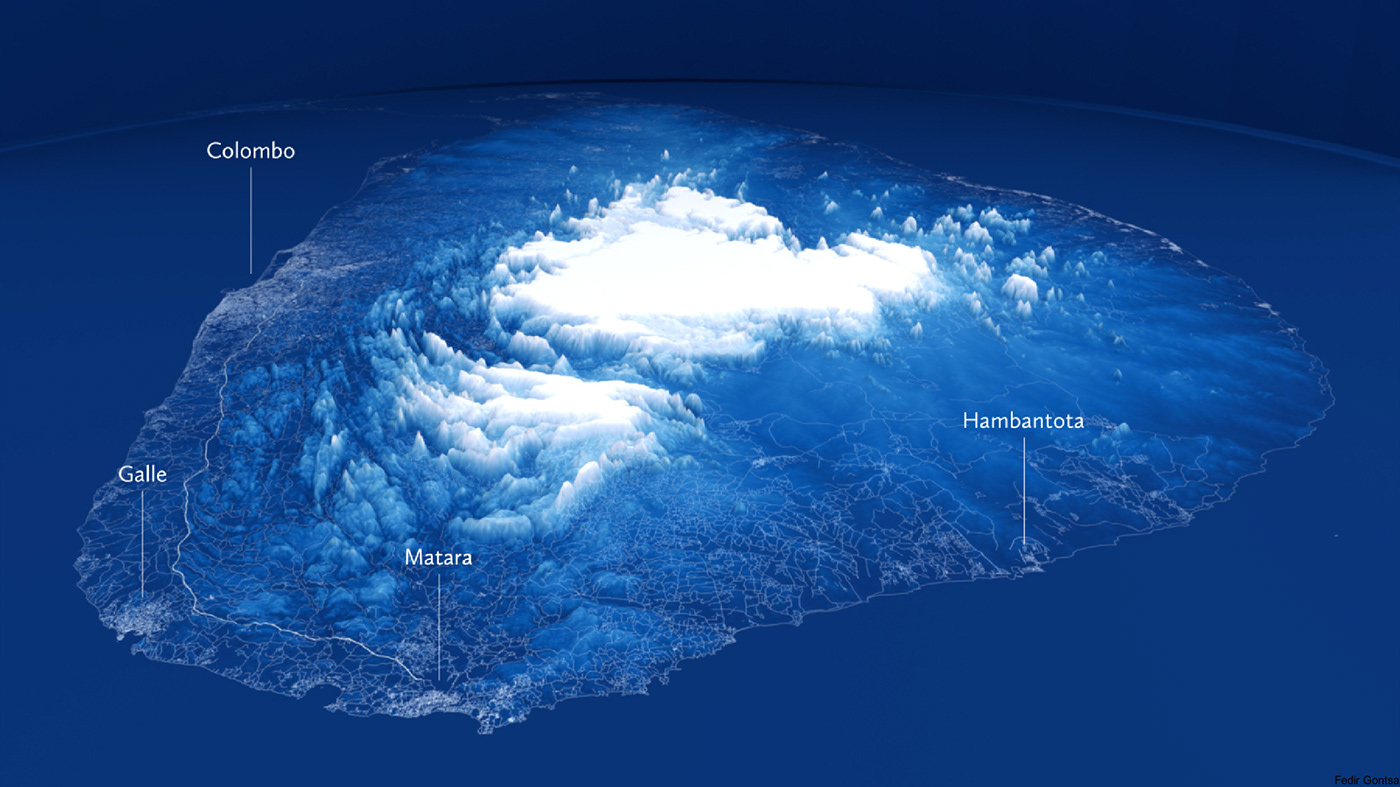
Sri Lanka
Source: SRTM + OpenStreetMap
Software: QGIS, Blender, Inkscape
Source: SRTM + OpenStreetMap
Software: QGIS, Blender, Inkscape
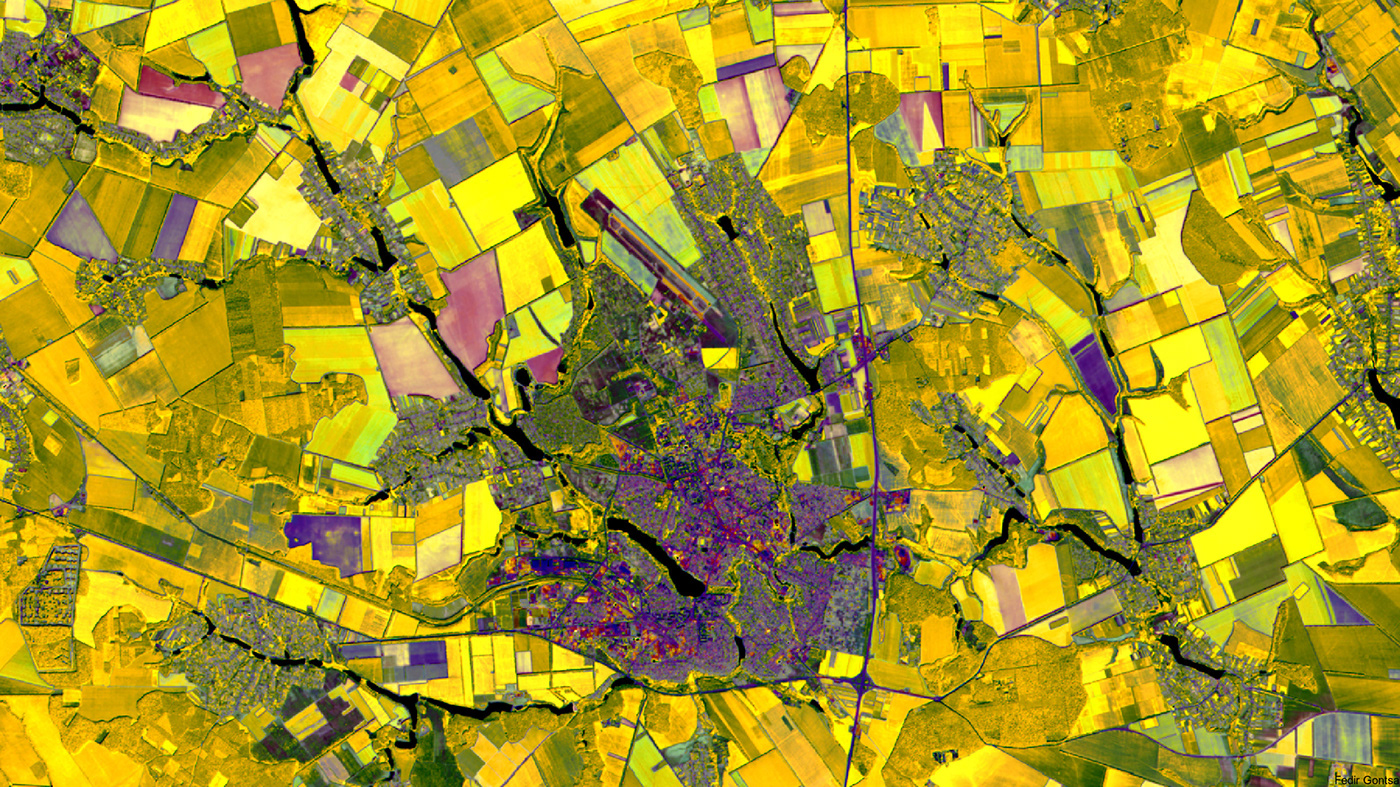
Uman (Human), Cherkasy region. Central Ukraine.
Unique Combined Visualization Technique — combined landsat 8 raster data (12, 8, 4) + (8, 11, 4) bands.
Scale 1: 160,000
Data: Landsat 8
Unique Combined Visualization Technique — combined landsat 8 raster data (12, 8, 4) + (8, 11, 4) bands.
Scale 1: 160,000
Data: Landsat 8
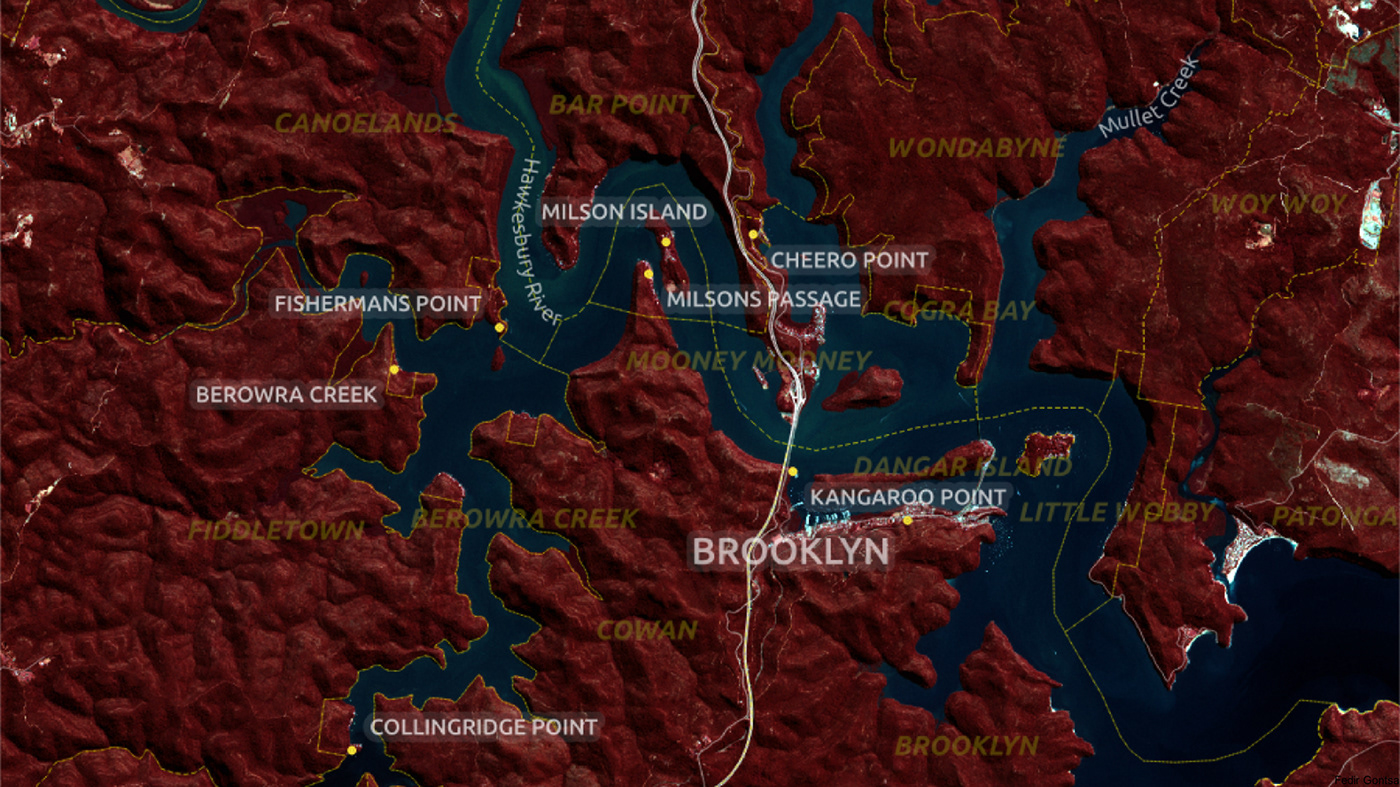
My new cartographic style for common maps (web or print).
Scale: 1:270 000
Region: The Council of the Shire of Hornsby, Sydney
Software: QGIS+ GDAL
Data: Sentinel-2A + OpenStreetMap
Scale: 1:270 000
Region: The Council of the Shire of Hornsby, Sydney
Software: QGIS+ GDAL
Data: Sentinel-2A + OpenStreetMap
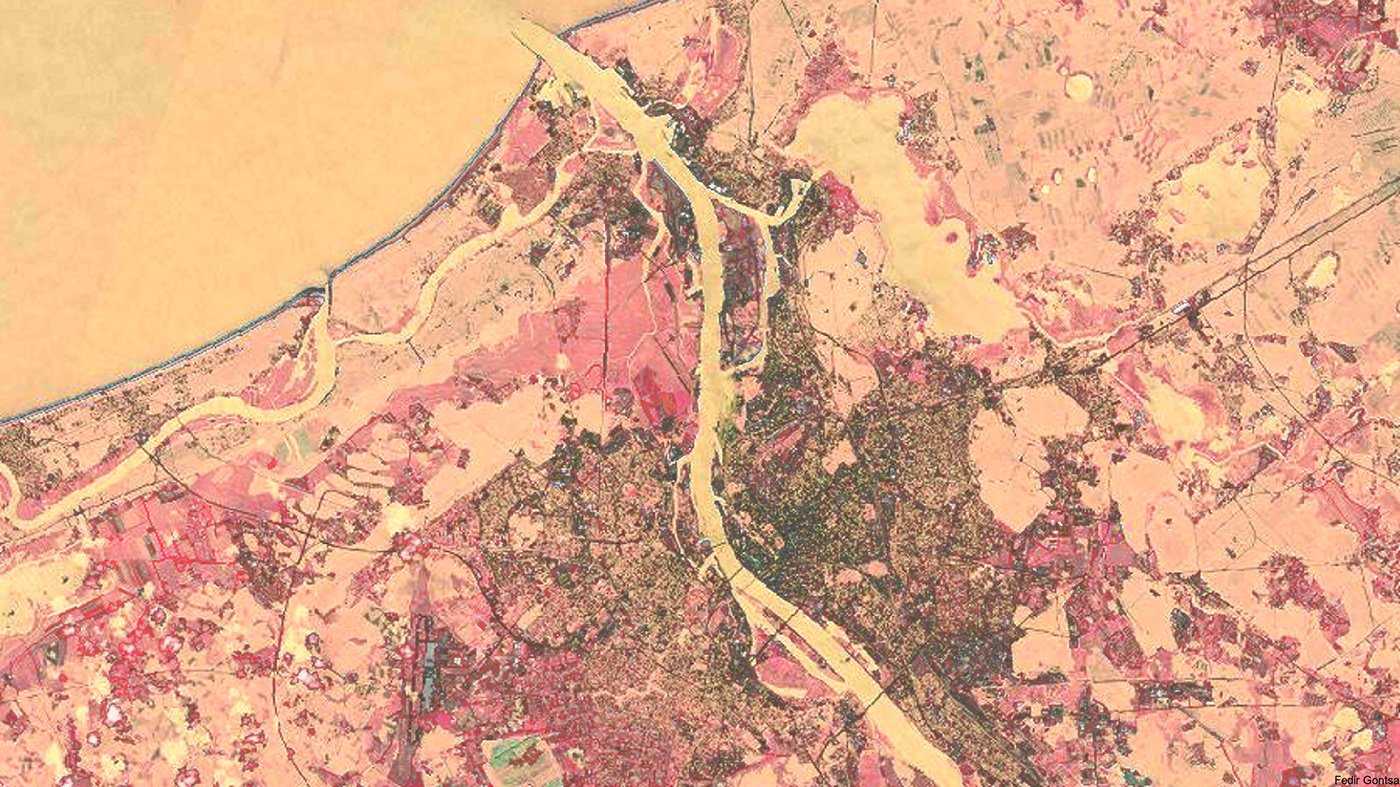
The capital of Latvia.
This map is a complicated, combined raster image from the satellite Santinel-2A
Created by combining channels 4, 3, 2 and 8, 4, 3 - invert natural color and infrared.
This map is a complicated, combined raster image from the satellite Santinel-2A
Created by combining channels 4, 3, 2 and 8, 4, 3 - invert natural color and infrared.
Data: Sentinel 2A

Uzhhorod. Abstracts Edition.
Scale: 1:75 000
Unique Combined Visualization Technique
Source: Sentinel-2A, SRTM, OpenStreetMap
Scale: 1:75 000
Unique Combined Visualization Technique
Source: Sentinel-2A, SRTM, OpenStreetMap

Kharkiv autumn. Dark Edition.
Source: Landsat + OpenStreetMap
Scale 1: 300,000
October, 2017
Source: Landsat + OpenStreetMap
Scale 1: 300,000
October, 2017
Featured images on Week 44 (from Monday 30 October 2017 to Sunday 5 November 2017) in Wiki.OpenStreetMap.org
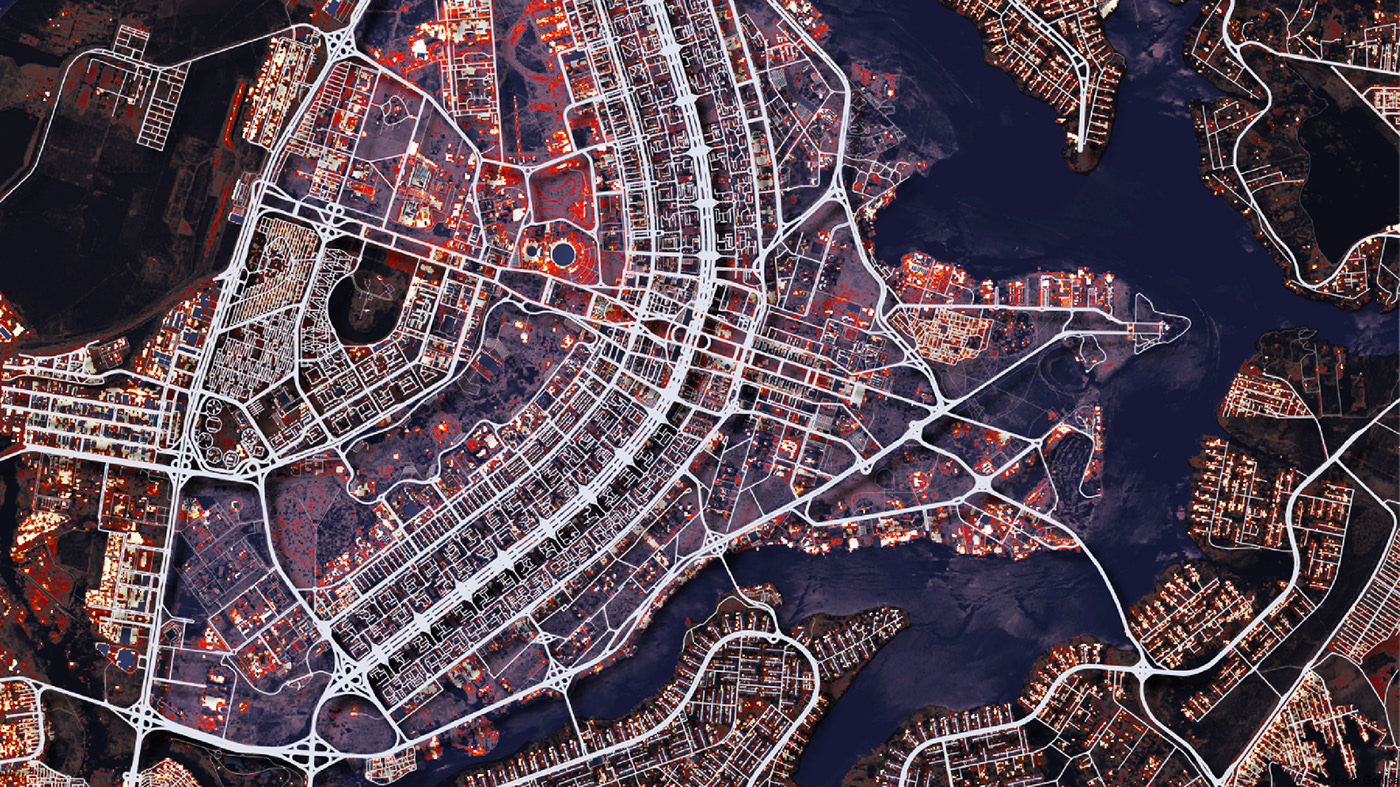
Brasília was planned and developed by Lúcio Costa and Oscar Niemeyer in 1956 to move the capital from Rio de Janeiro to a more central location. The landscape architect was Roberto Burle Marx. The city's design divides it into numbered blocks as well as sectors for specified activities, such as the Hotel Sector, the Banking Sector and the Embassy Sector. Brasília was chosen as a UNESCO World Heritage Site due to its modernist architecture and uniquely artistic urban planning. (Wikipedia)
Scale: 1:120 000
Source: Landsat + OpenStreetMap
Scale: 1:120 000
Source: Landsat + OpenStreetMap
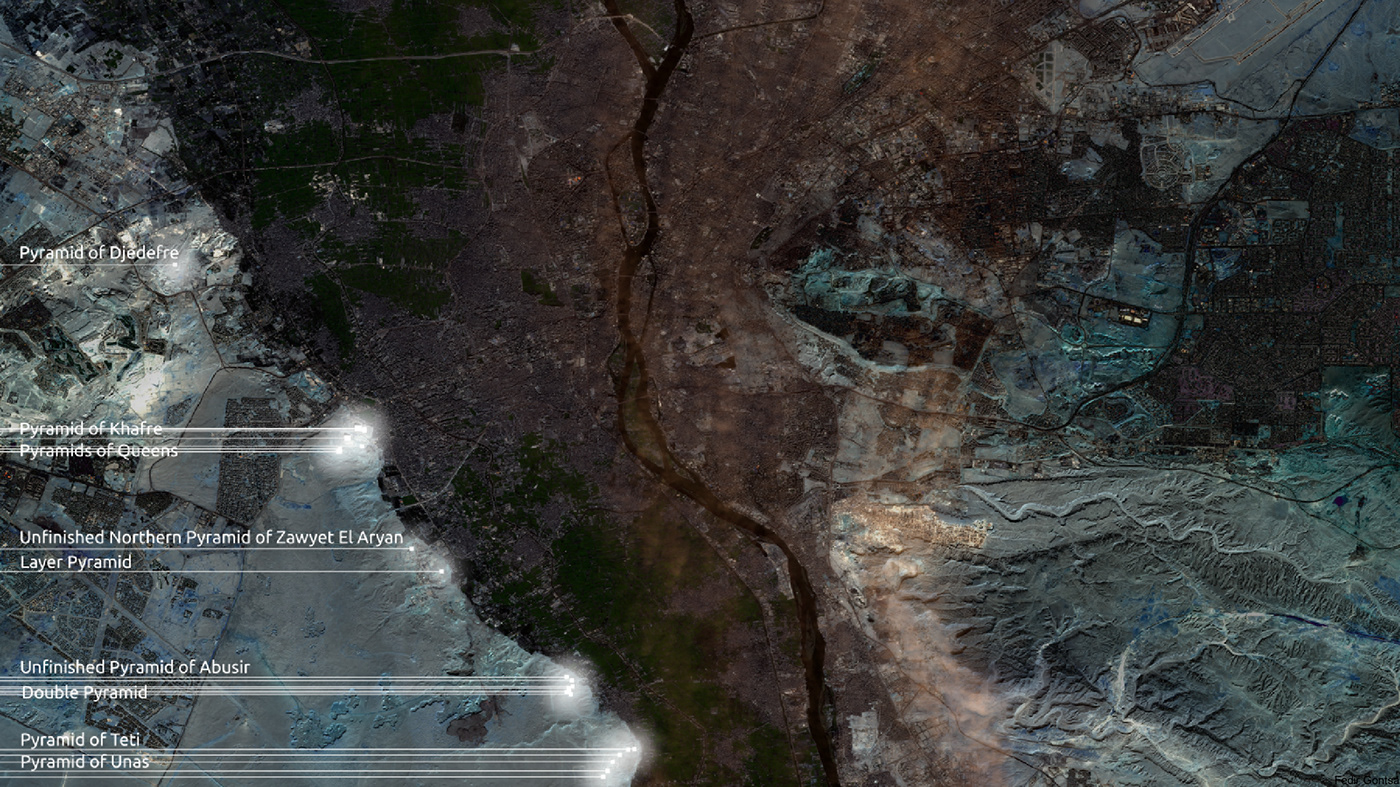
Cairo. Egypt. Dark Edition.
It is always worth rethinking the acquired knowledge before.
Not clearly imagined the location of pyramids in Giza because it usually appears on the plan of only popular pyramids. Ancient history of architecture is taught in the first year of the university, is forgotten.
It turned out that the pyramids were located along the edge, groups, over the valley along the coast. This is only part of the pyramids that are found in Egypt.
Data: Sentinel + OpenStreetMap
Palm Canyon. Kofa National Wildlife Refuge
Scale: 1:300,000
Source: Landsat 8.
Scale: 1:300,000
Source: Landsat 8.
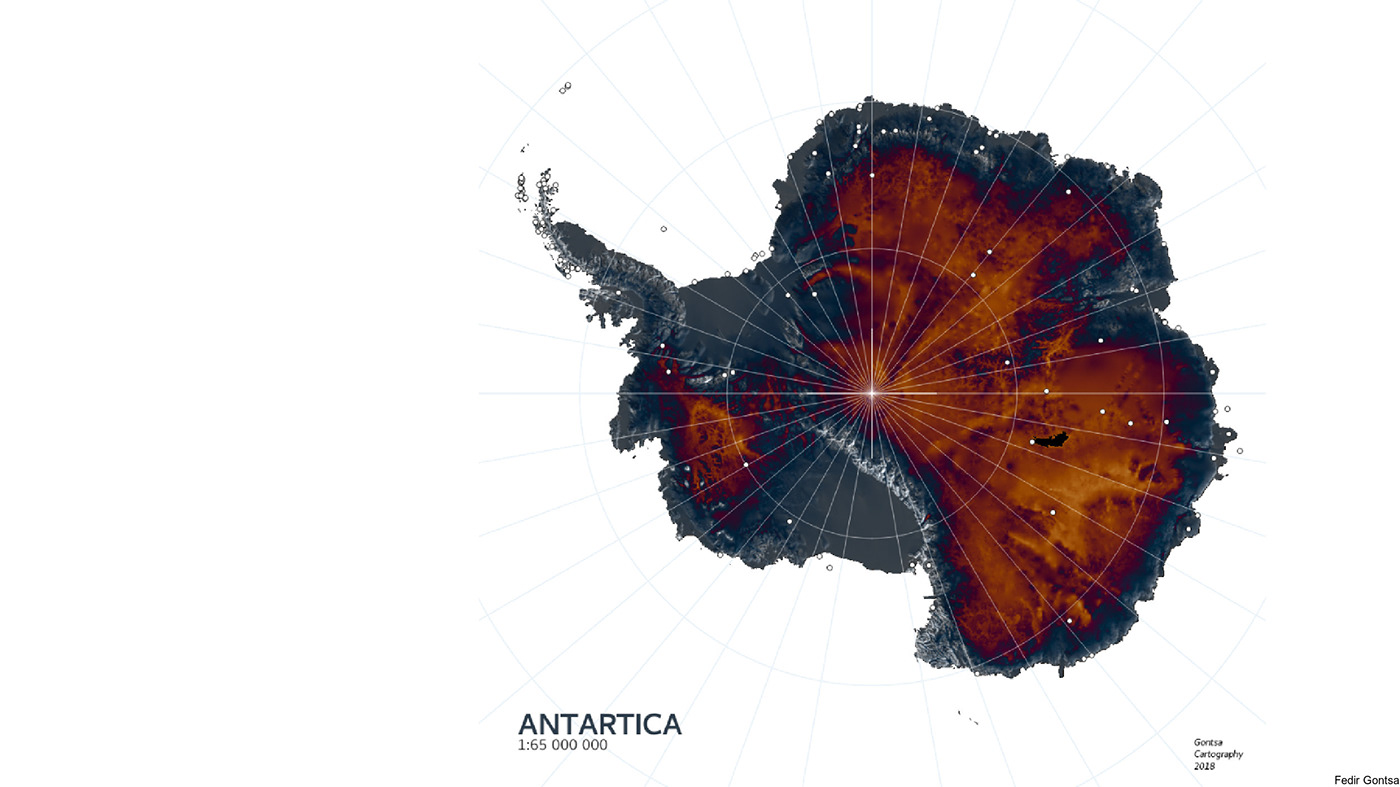
ANTARCTICA.
White point — research stations in Antarctica.
Software: QGIS + GDAL
Data: Bedmap2 datasets and associated grids (5th March 2013), Natural Earth Data V4 (graticules), Wikipedia (station locations).
White point — research stations in Antarctica.
Software: QGIS + GDAL
Data: Bedmap2 datasets and associated grids (5th March 2013), Natural Earth Data V4 (graticules), Wikipedia (station locations).
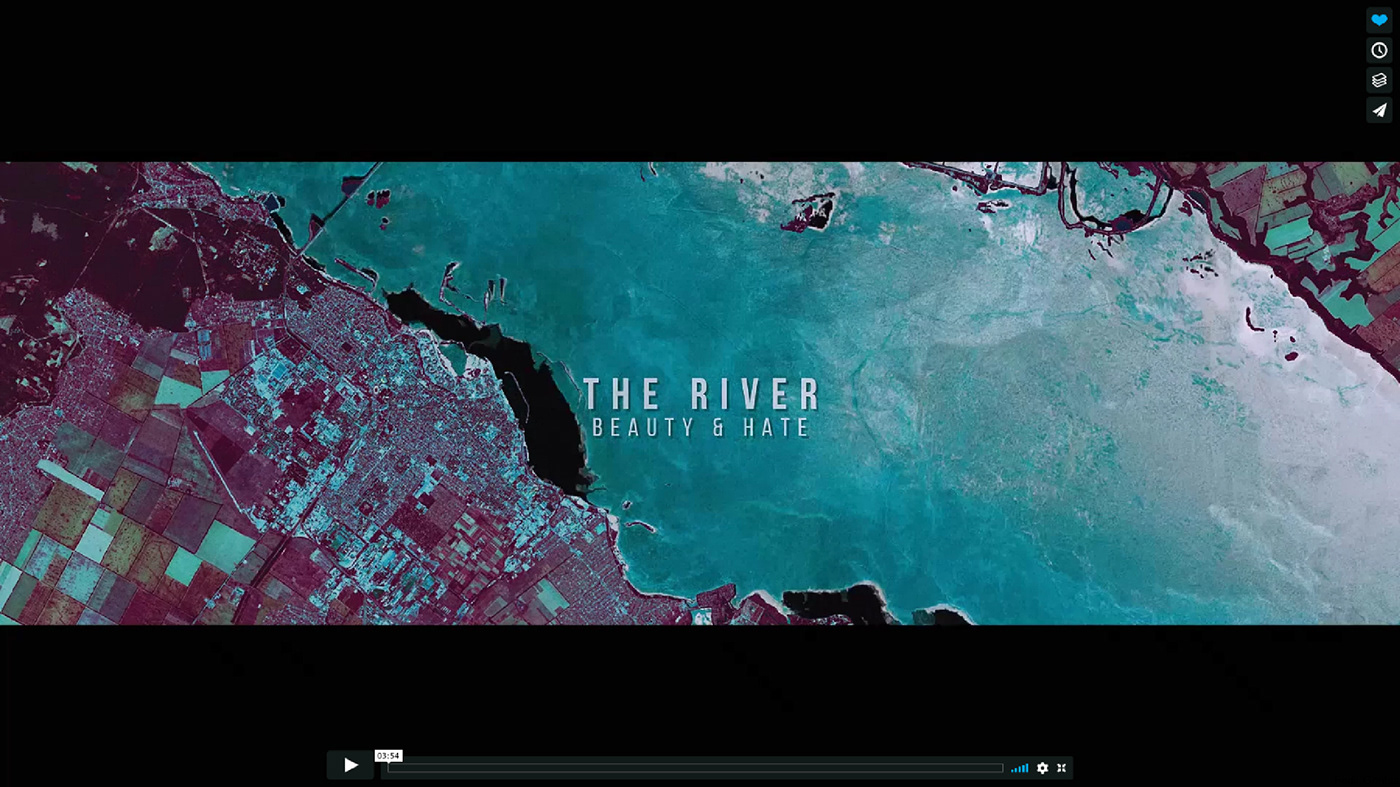
THE RIVER. BEAUTY & HATE.
I participated in a great video as a GIS specialist. During the 2 months of the spring I shook photos from the satellites and processed them specifically for this movie. Vadim Sapatrylo shot his excellent time lapse videos about the river Dnipro. His great merit in that!
http://bit.ly/TheRiver17
I participated in a great video as a GIS specialist. During the 2 months of the spring I shook photos from the satellites and processed them specifically for this movie. Vadim Sapatrylo shot his excellent time lapse videos about the river Dnipro. His great merit in that!
http://bit.ly/TheRiver17
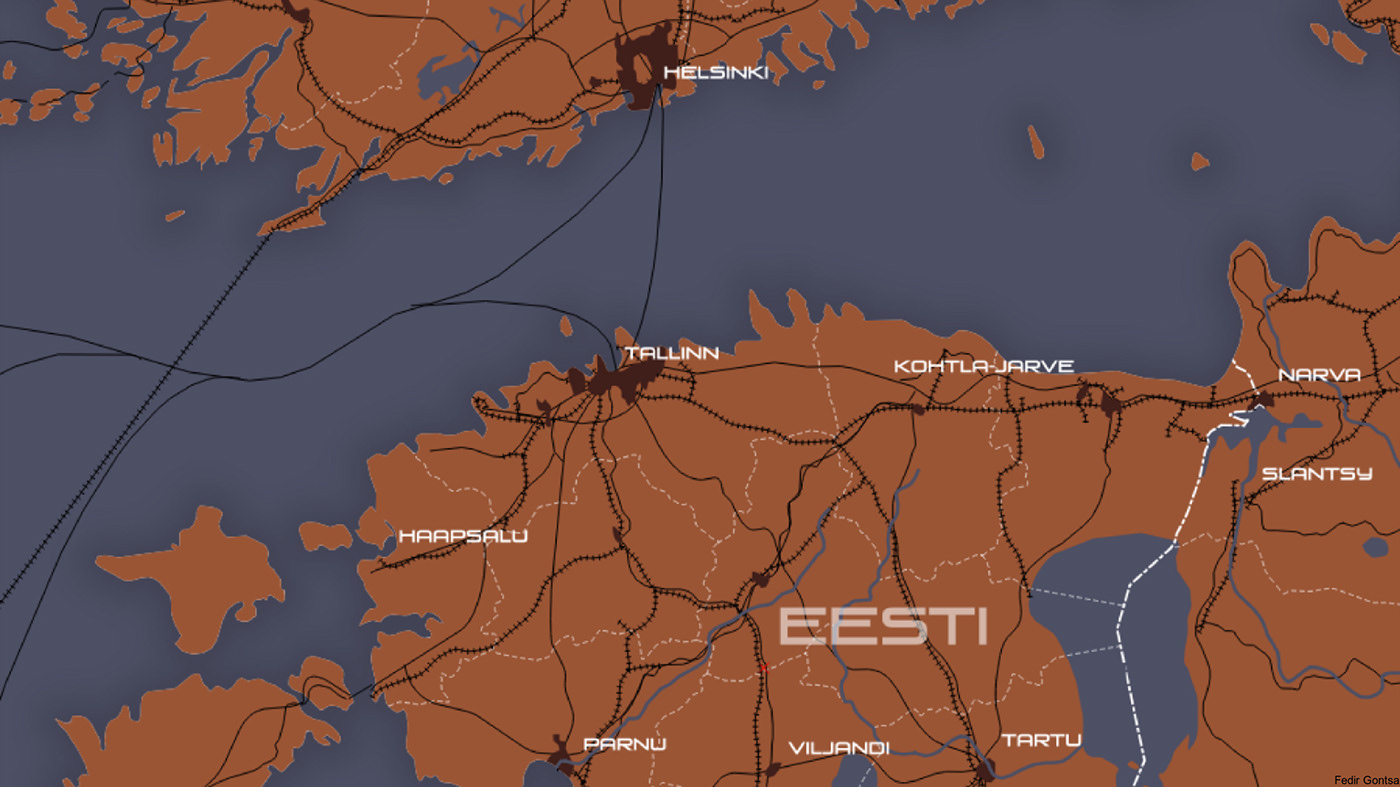
Estonia (Eesti) is a country in the Baltic region of Northern Europe.
Data: Natural Earth Data
Data: Natural Earth Data
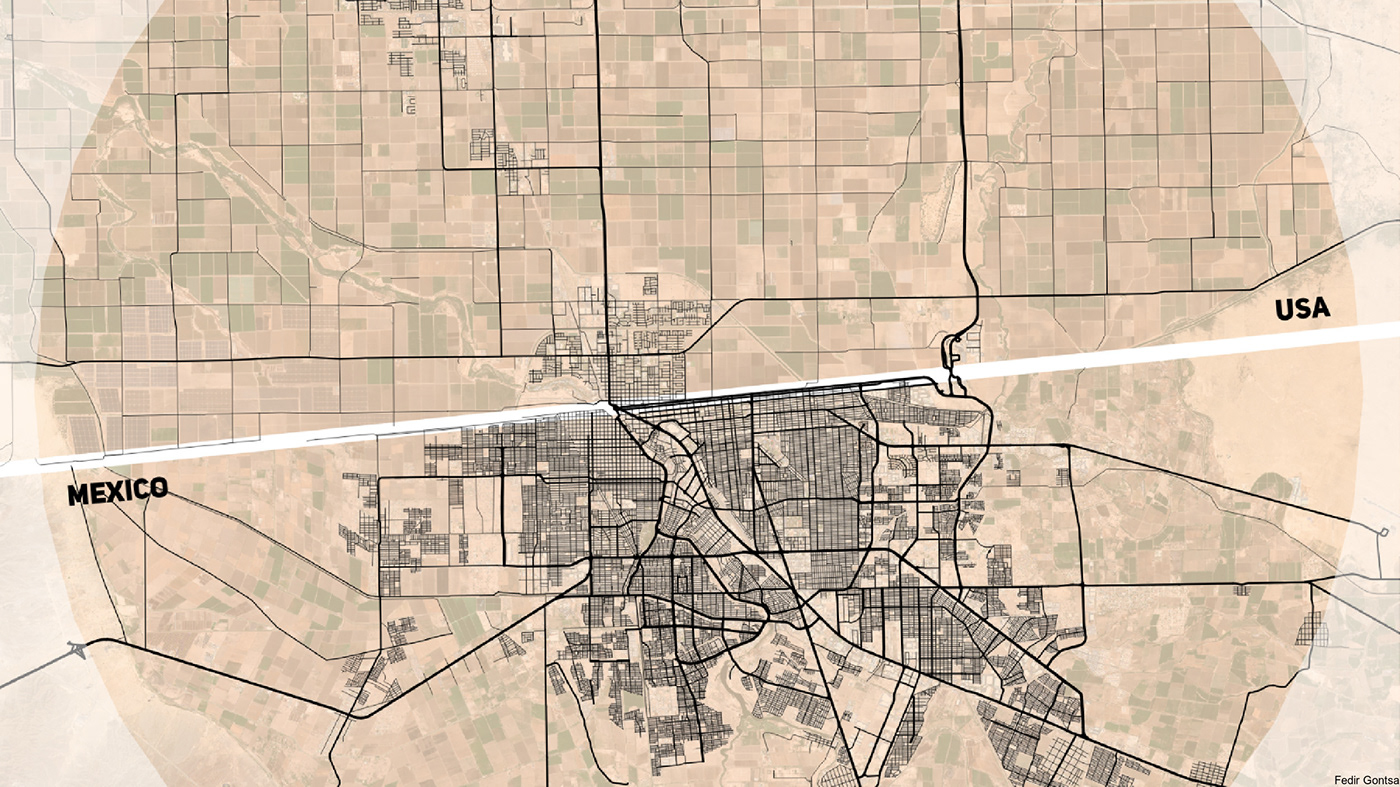
Calexico and Mexicali.
USA-Mexico border. California.
Scale: 250,000
Source: Sentinel-2A, OpenStreetMap
USA-Mexico border. California.
Scale: 250,000
Source: Sentinel-2A, OpenStreetMap
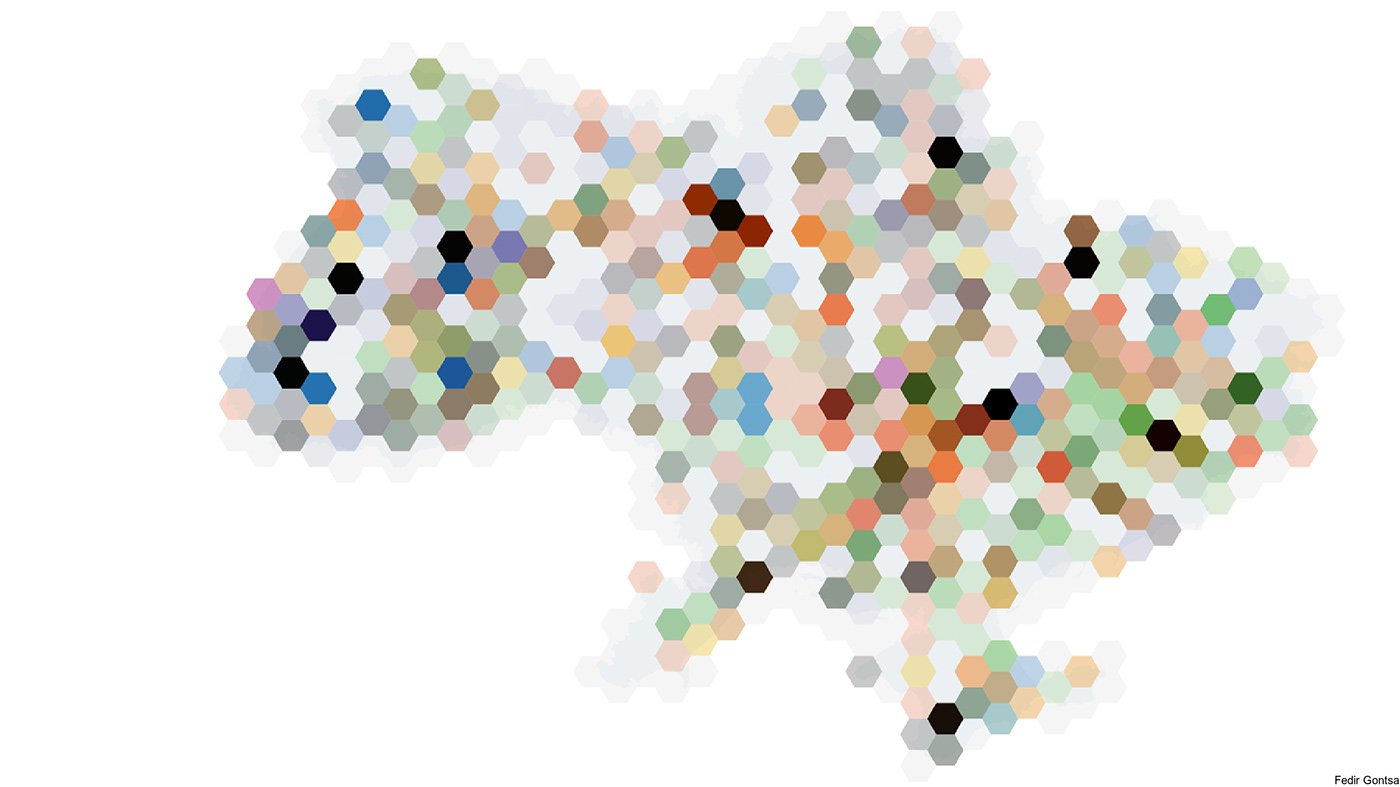
Color names Ukraine (big files)
In Ukraine, many "color names" - hamlets, villages, towns, forests, rivers, ponds, ravines, peaks, streets and other facilities.
I decided to test it - results of check on thematic maps.
In work used QGIS, OpenStreetMap data, GDAL
In Ukraine, many "color names" - hamlets, villages, towns, forests, rivers, ponds, ravines, peaks, streets and other facilities.
I decided to test it - results of check on thematic maps.
In work used QGIS, OpenStreetMap data, GDAL
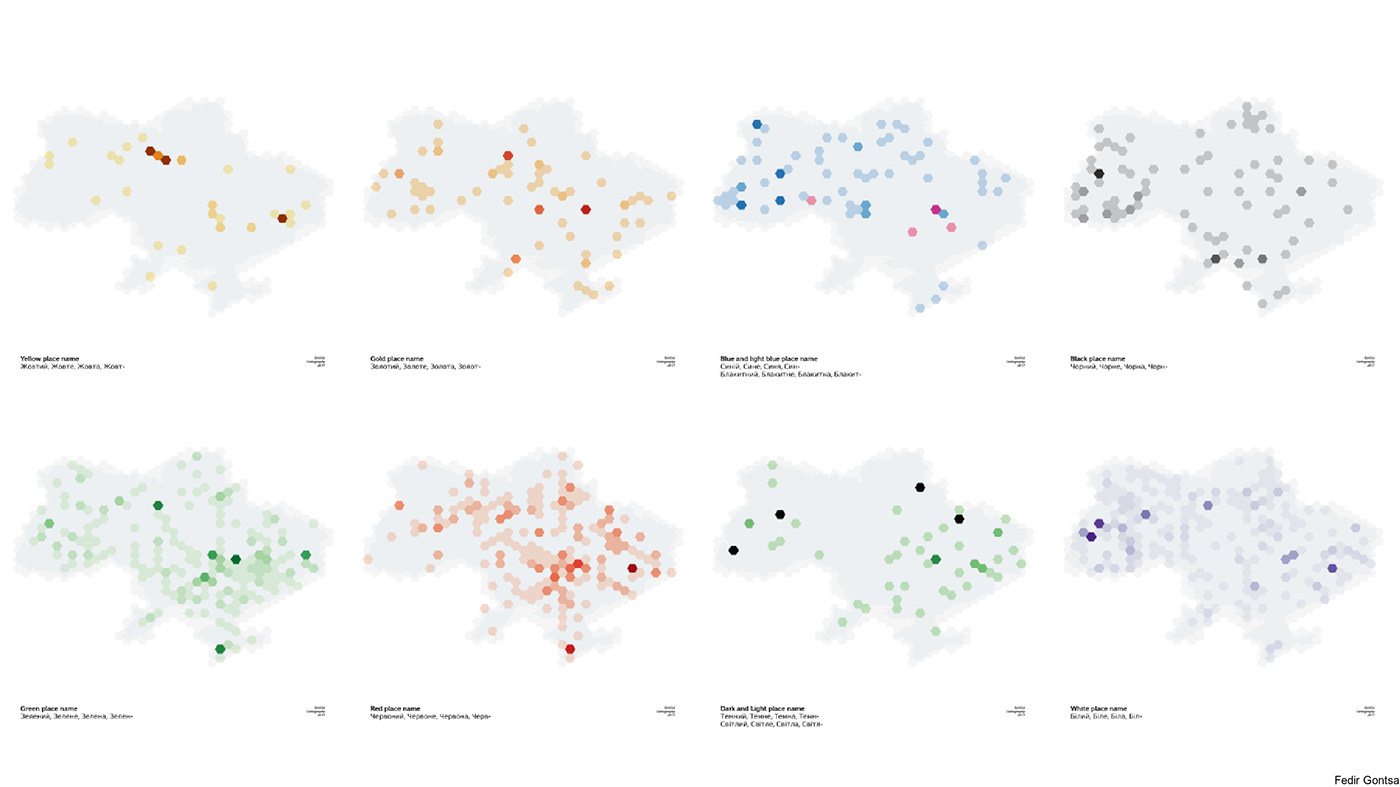
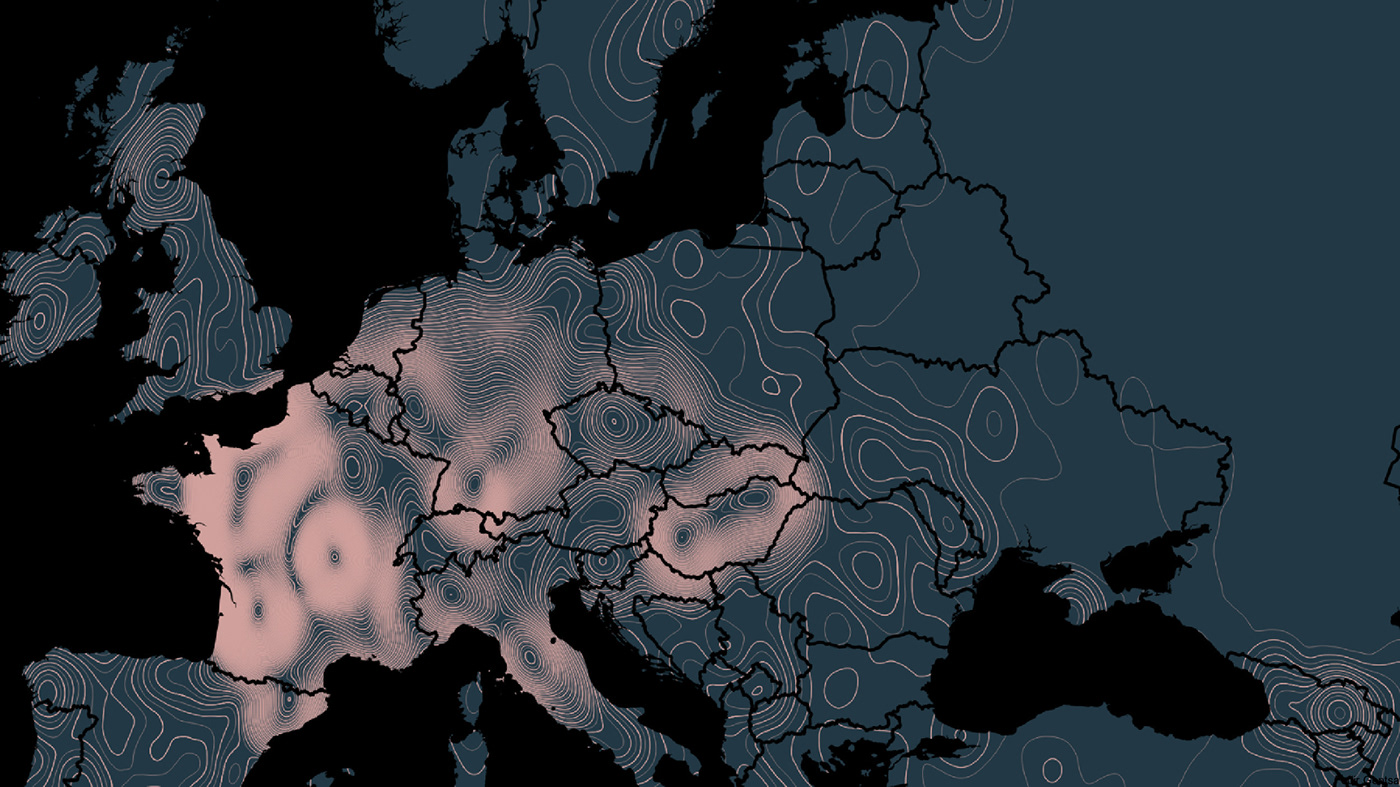
The density of castles in central Europe.
The tag "historic=castle" is used in OpenStreetMap for various kinds of castles, palaces, fortresses, manors, stately homes, kremlins, shiros and other.
Sourse: NaturalEarthData and OpenStreetMap
The tag "historic=castle" is used in OpenStreetMap for various kinds of castles, palaces, fortresses, manors, stately homes, kremlins, shiros and other.
Sourse: NaturalEarthData and OpenStreetMap
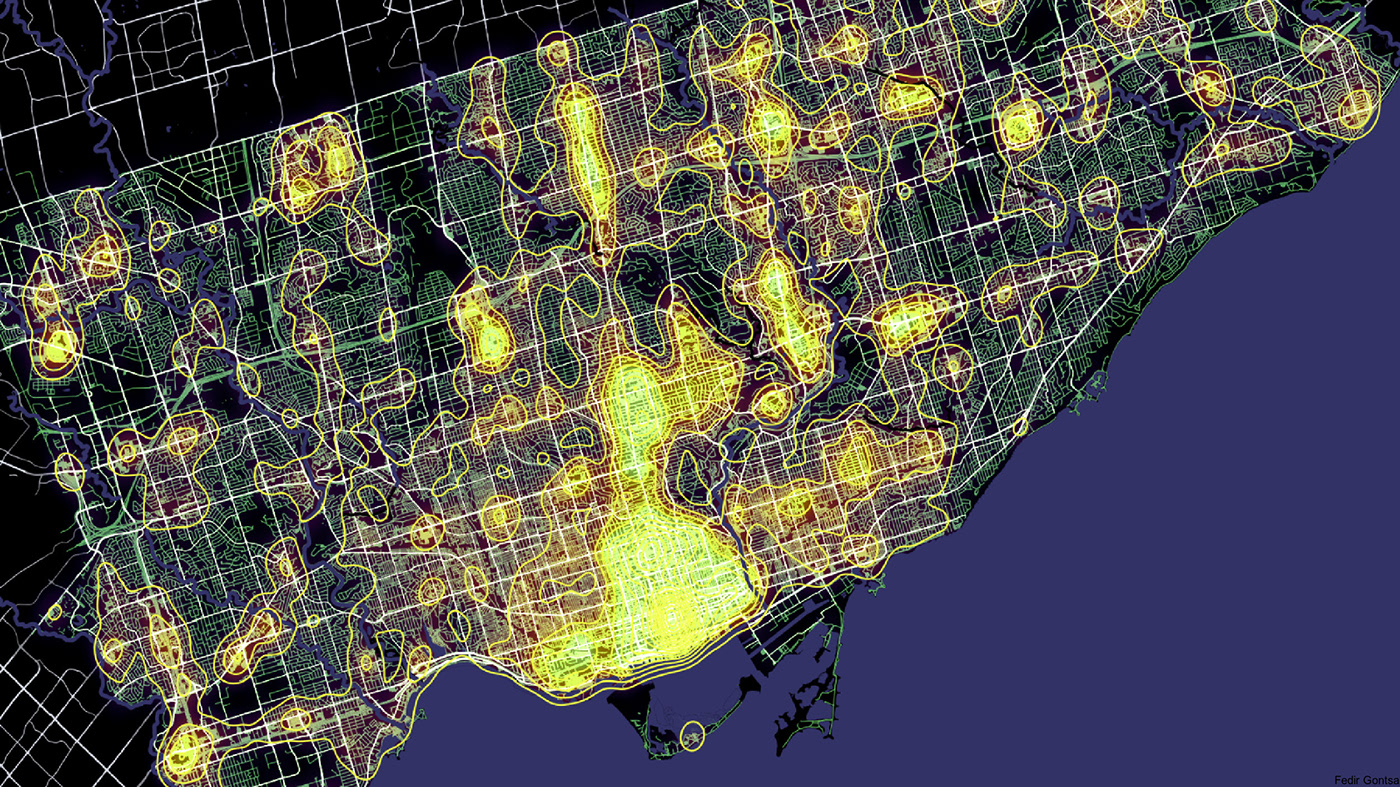
This is data from Strava Metro data services, including Streets (Edges), Origin / Destination, Intersections (Nodes) examples of Toronto data and decided to try them in a few ways to visualize.
On the first step I created a heat map of places popular with users.
Scale: 1:350 000
Source: OpenStreetMap + Strava
On the first step I created a heat map of places popular with users.
Scale: 1:350 000
Source: OpenStreetMap + Strava
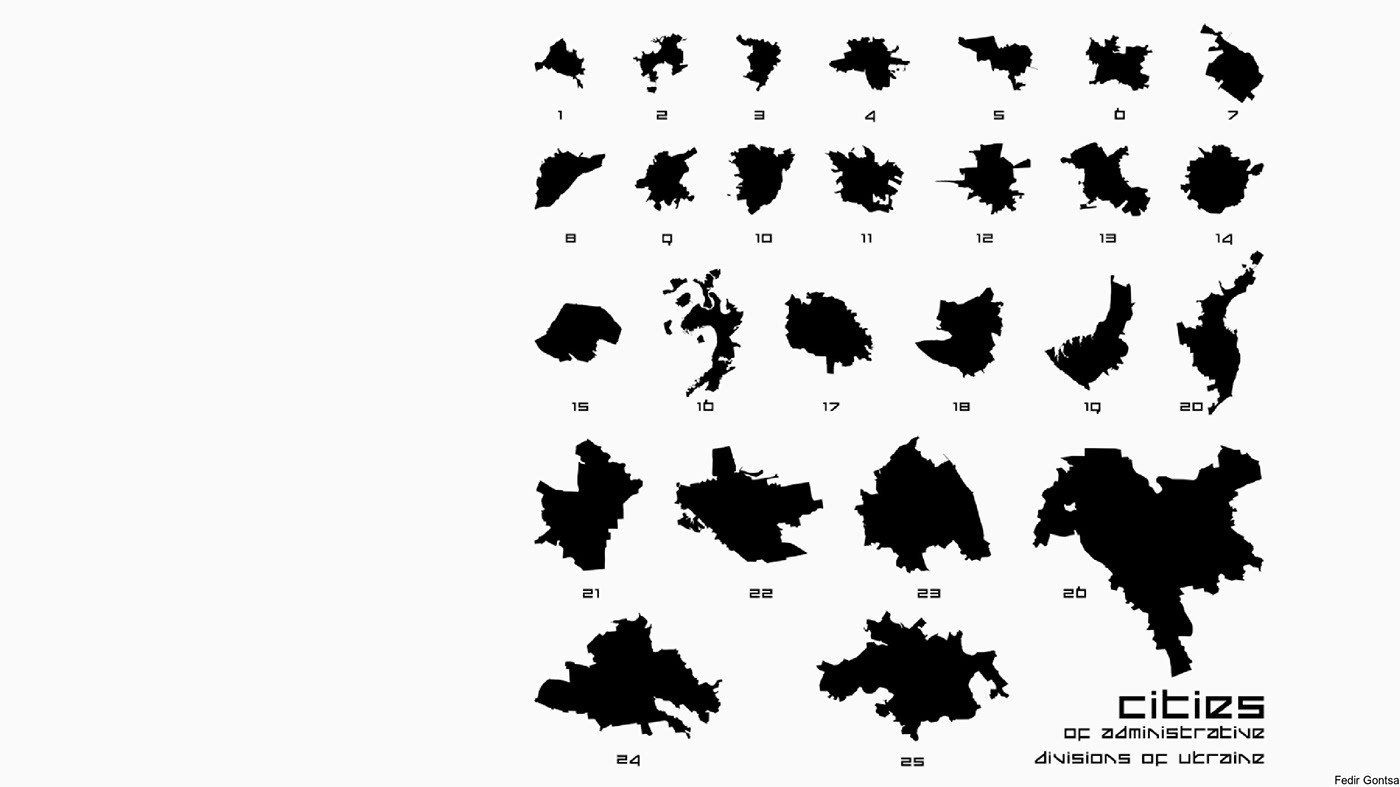
What is your city number?
Cities of Administrative divisions of Ukraine. Sorted by area.
Cities of Administrative divisions of Ukraine. Sorted by area.
Ukraine is divided into several levels of territorial entities. On the first level there are 27 regions: 24 oblasts, one autonomous republic, and two "cities with special status".
This scheme presents a comparative analysis of cities by their area.
In the West - a small area of the city, in the East - large.
The largest city is Kyiv.
Scale: 1:2 500 000
Software: QGIS + Inkscape
Data: OpenStreetMap
This scheme presents a comparative analysis of cities by their area.
In the West - a small area of the city, in the East - large.
The largest city is Kyiv.
Scale: 1:2 500 000
Software: QGIS + Inkscape
Data: OpenStreetMap
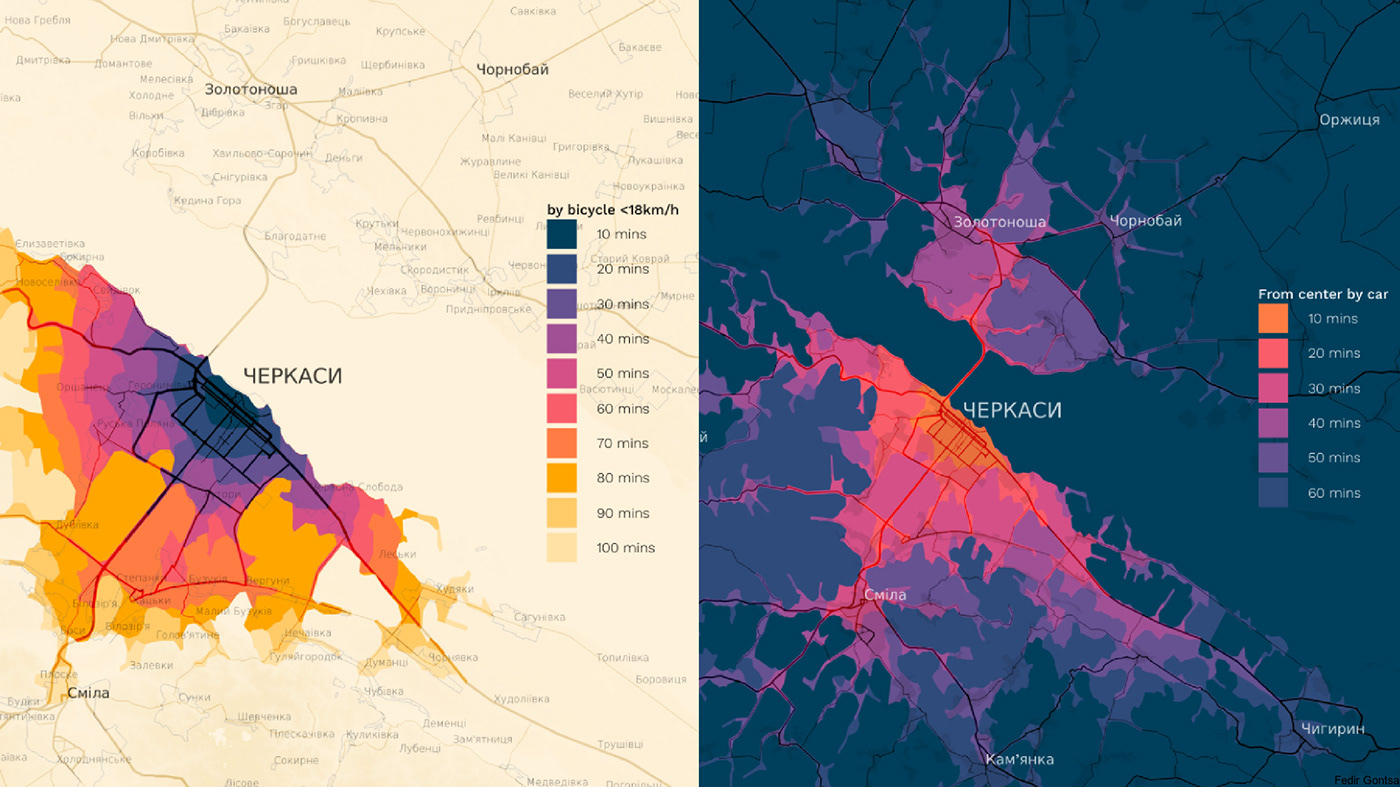
Isochrone map
Data: OpenStreetMap
Software: QGIS + OpenRouteService + Python
Data: OpenStreetMap
Software: QGIS + OpenRouteService + Python
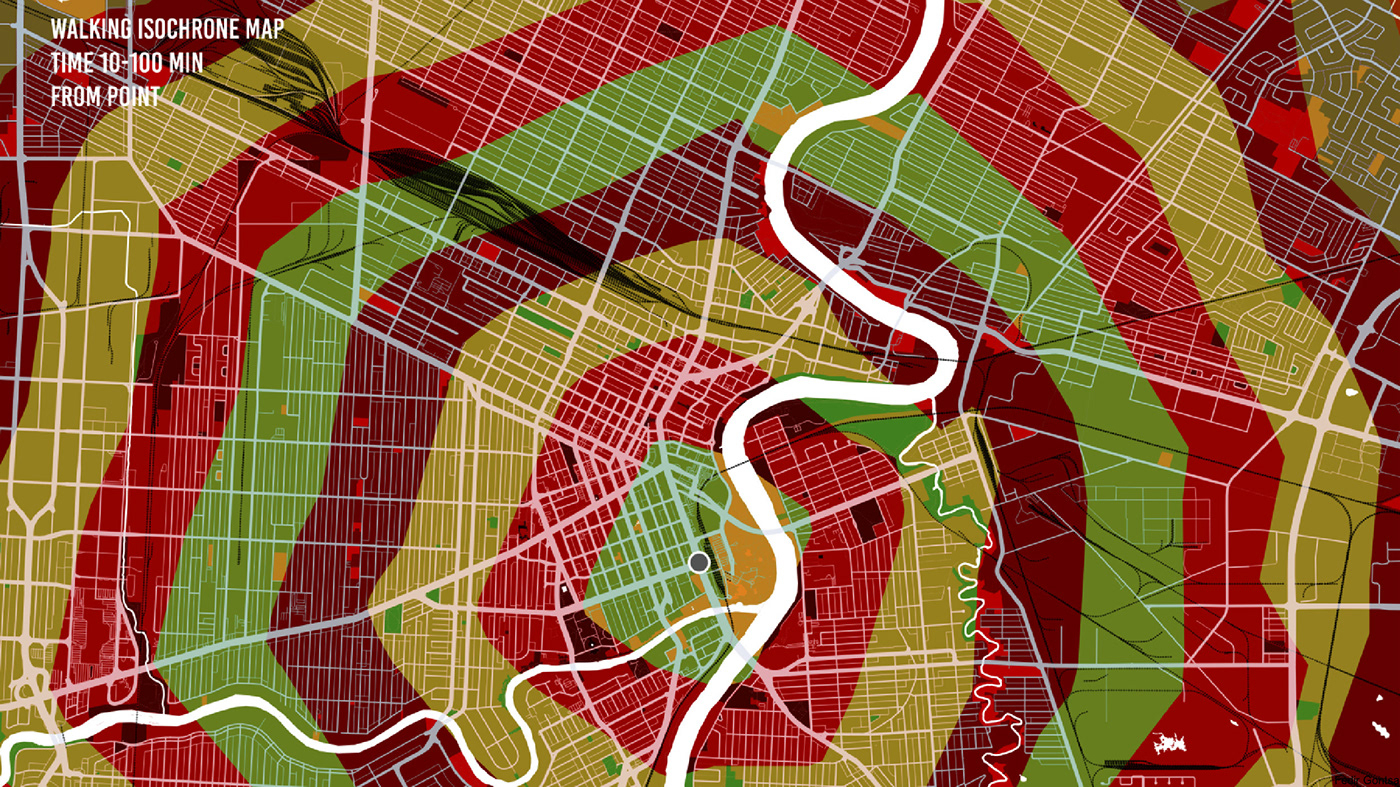
Walking Isochrone map (for the competition)
Data: OpenStreetMap
Data: OpenStreetMap
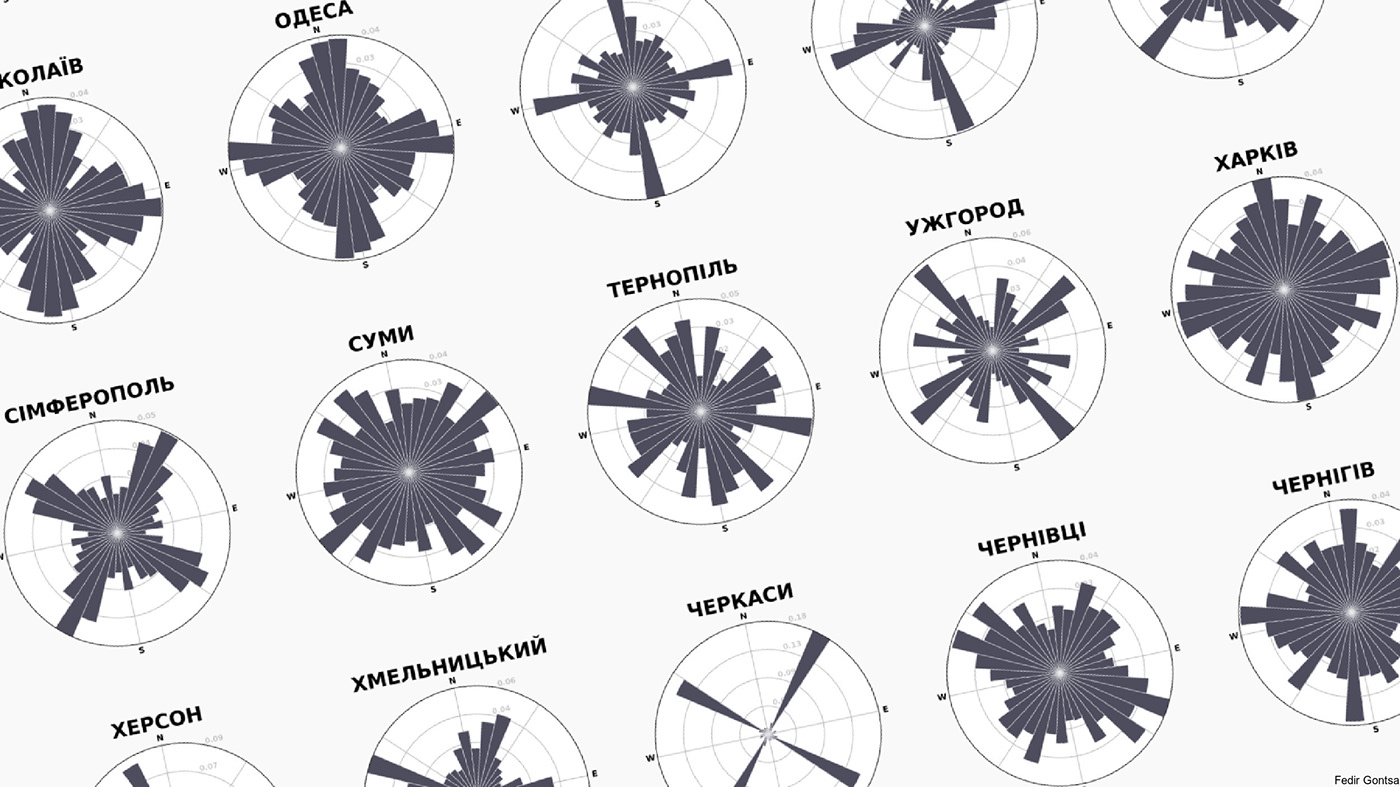
As part of a Maparnya team (together with Petro Nek and Alexander Kubov) have been developed a project to Comparing Ukraine City Street Orientations in Ukraine.
The text of the research and other images are available on the Medium (in Ukrainian only)
Data: OpenStreetMap
The text of the research and other images are available on the Medium (in Ukrainian only)
Data: OpenStreetMap
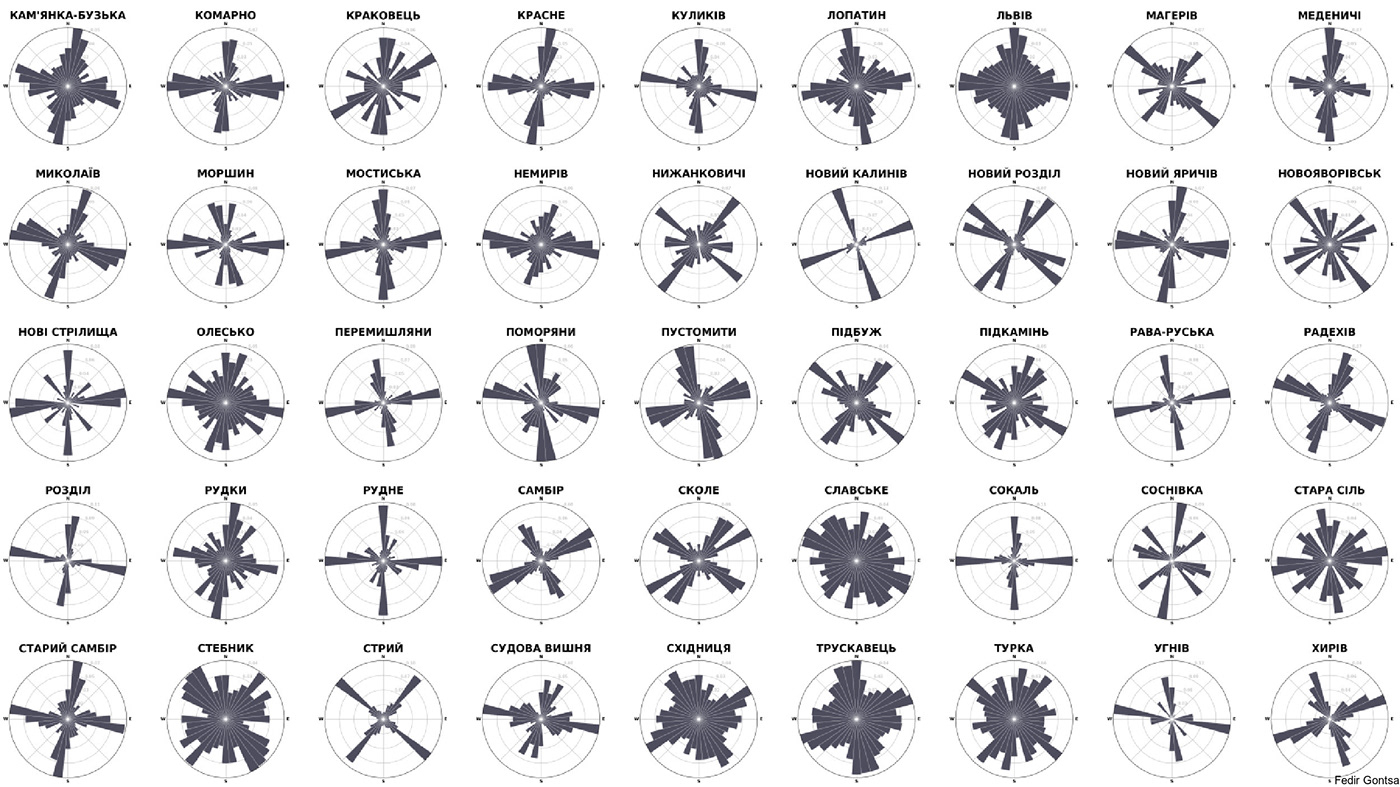
Comparing City Street Orientations by Lviv region
Data: OpenStreetMap
Data: OpenStreetMap
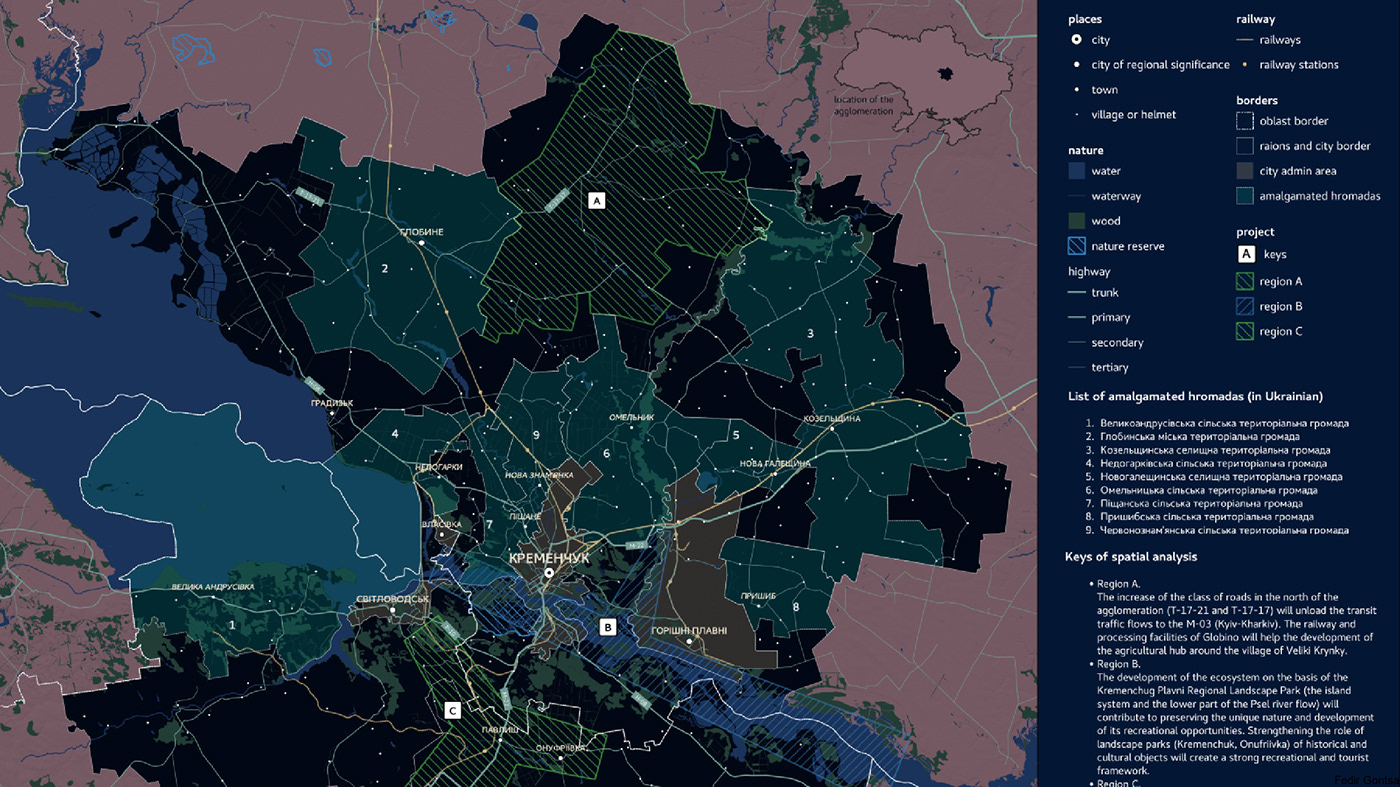
This project is a test task.
Used in the design of dark colors are not typical for this kind of projects.
Data: OpenStreetmap
Used in the design of dark colors are not typical for this kind of projects.
Data: OpenStreetmap
Thank you for viewing!

