
The Sunday Times – Elections and Referendums
Working for a national newspaper during a turbulent period in modern global politics, I have had several opportunities to art direct infographic features previewing and analysing major political events
By applying a focus on research in my design process, I have let the characteristics of electoral processes guide how to display the results of particular events
By doing so, I have helped to shift the Sunday Times away from an 'out-of-the-box' mindset to using graphics in election coverage, in favour of a tailored, more informative use of data visualisation that better reflects the events they analyse

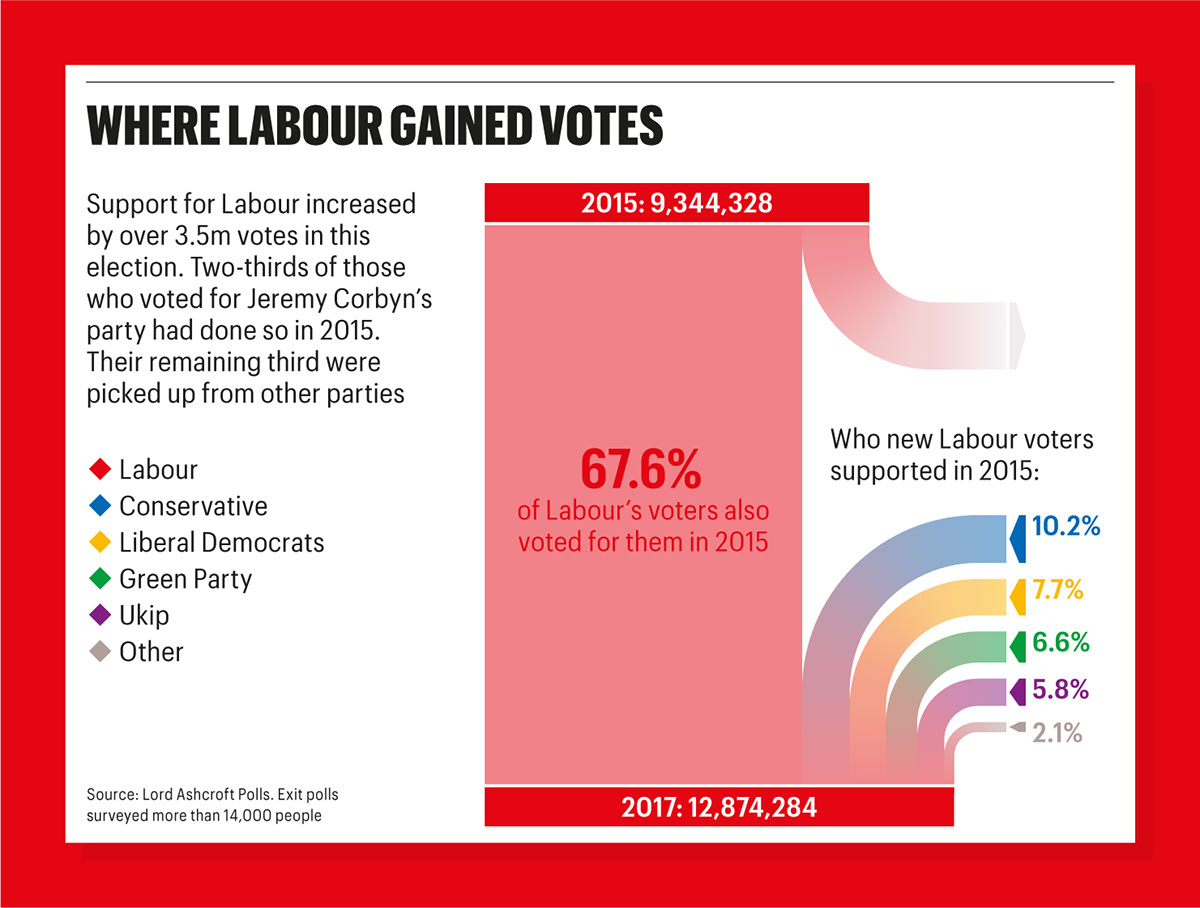
2017 UK General Election
General Election results are traditionally shown using a geographical constituency map. However, boundaries of these constituencies are based on population, not geography, leading to areas with lower population denisity – like in the Scottish highlands – appearing much larger than those with higher densities – like Greater London
Under the first-past-the-post system, every constituency is equally as important to the final result as any other. Consequently, I pushed to use a more appropiate way of visualising this data
For the first time in it’s history the Sunday Times’ post-election results coverage led with a proportional cartogram in place of the traditional constituency map. By presenting each constituency at the same shape and size, we were able to accuratley display the results, eliminating geographic skew
This feature won a Malofiej Award of Excellence for Newspaper Graphics


In the weeks leading up to the election I created a strong visual identity for the publication's coverage. It centered around a bold use of party colours, a distinctive duotone image treatment and a logo that linked everything with the results cartogram
One week ahead of polling day, I art directed a graphics-heavy feature that analysed key target seats for all major political parties, and acted as a guide to help readers follow events on election night


2018 Irish Presidential election
Irish Presidents are elected using a 'Single Transferrable Vote'. Under this system, every vote cast is counted up and a winner is decided if a candidate receives over half of the vote
Accordingly, and in stark contrast to the publcation's previous approach, I designed the results of the 2018 election with visual emphasis on the overall vote, shown as a large, bold pie chart
Although the county-by-county breakdowns in votes doesn't effect the final result, the extensive editorial coverage referred to regional narratives. County results were shown, but took a back seat in the page display


2015 EU Referendum
The in/out referendum on the UK's membership of the EU was decided on a count of all votes cast nationwide
Despite being irrelevant to the final outcome, the editorial team frustratingly insisted that the focal point of the feature should be a map of results broken down by-region
I balanced this out by displaying the final result as the largest bar chart the Sunday Times has ever printed, effectively using it to underline everything else
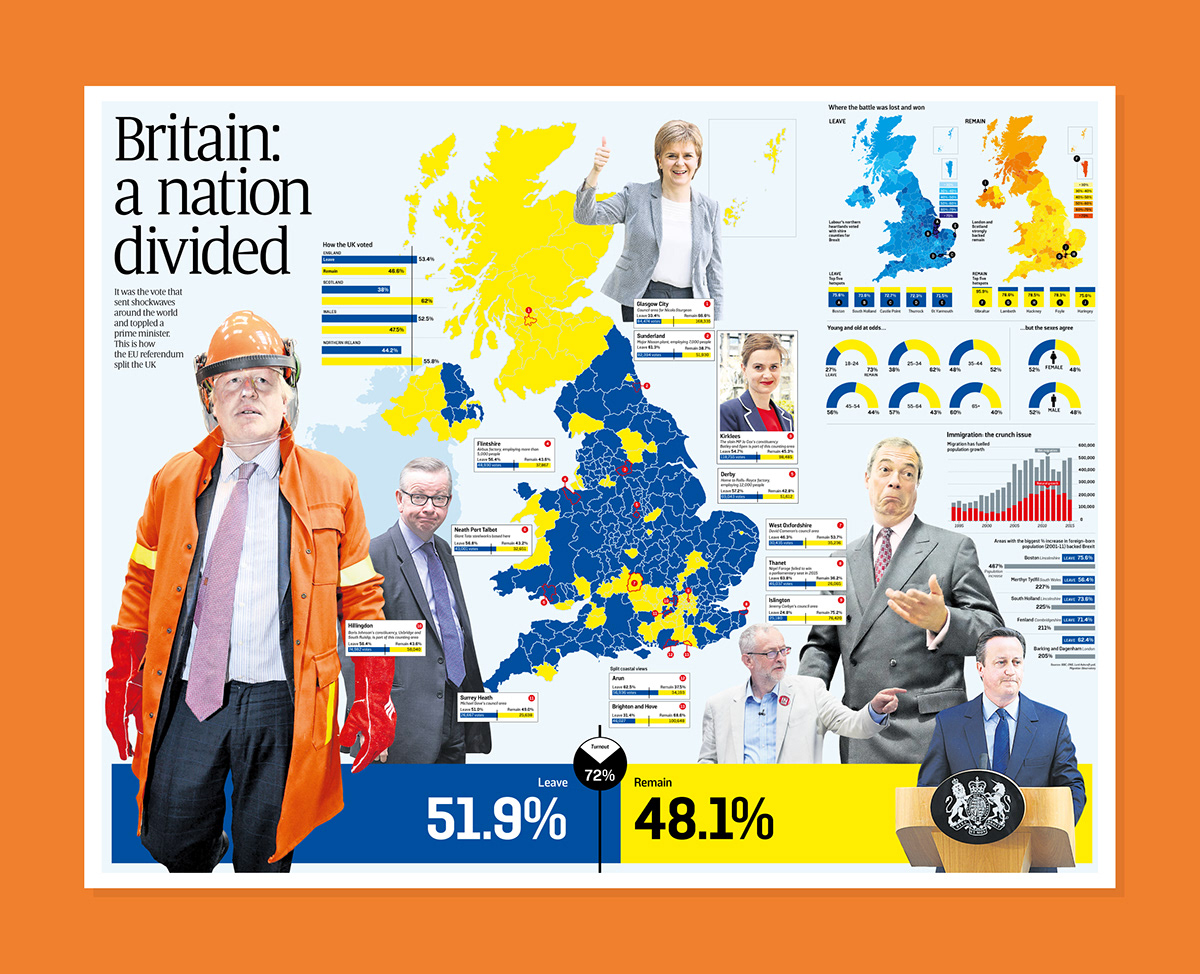
Published three days after the result shocked the world, smaller visualisations helped to add sober context and reason, exploring themes such as how voters of differing age and gender voted
Rejected as the main focus for the feature, two smaller maps of the UK showed how magnitude of leave and remain votes varied across the nation. They highlight how votes to remain were concentrated in Scotland, Northern Ireland and London, whilst coastal areas, especially in the North East, favoured Leave


