Work from 2010-2012 MA in Communication design at Central Saint Martins.
The MA project consists of theory, practical experiments and user involvement. The work is gradually developed, and in this portfolio I show examples of various experiments which support my theoretical thesis.
The work is developed around the challenge of how behavioural psychology may affect communication of climate change. Mainly challenging the idea of how we design information and how we as designers research our subjects.
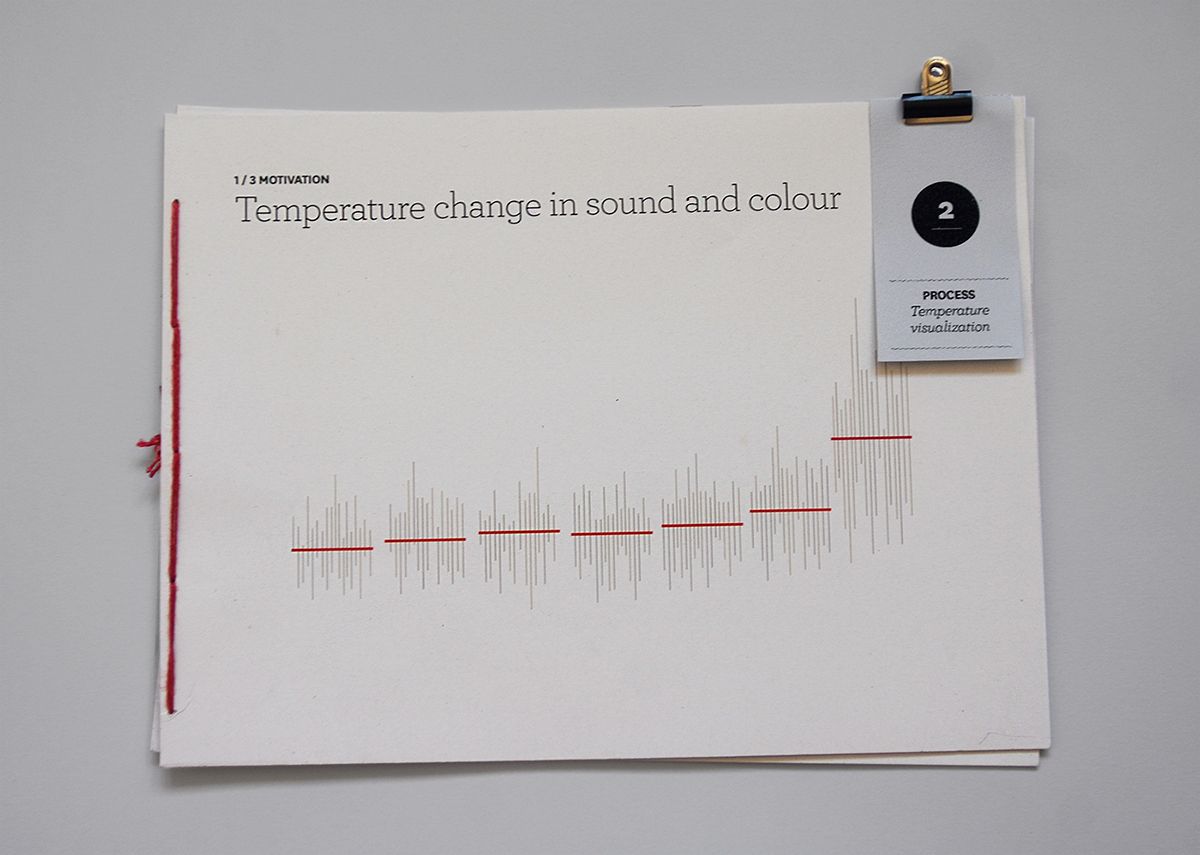
Creating motivation through sensory means
In this experiment it is explored how to translate data of Central England Temperature (1659-2011) to sound.
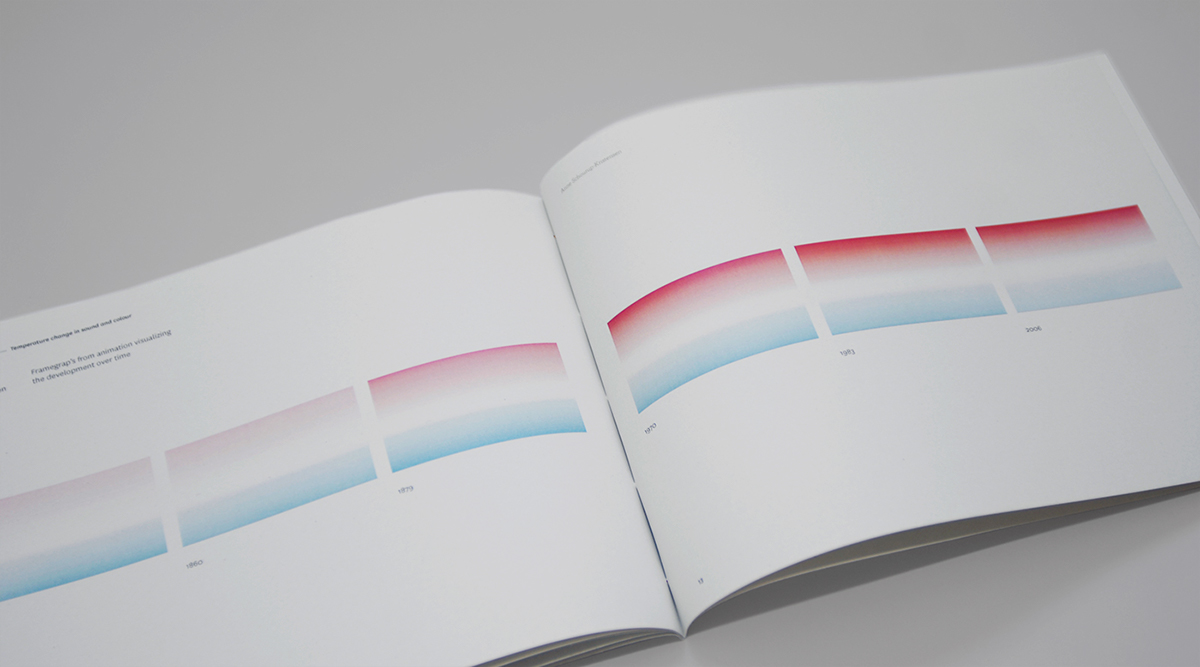
Temperature is in this case an indicator of climate, visualized to communicate how the temperature changes over time. The booklet outlines the data processing resulting in a final outcome of a 2 min. animation of sound and colour.Sound and colour is chosen as sensory and abstract visual mean in order to create a less predictable experience.
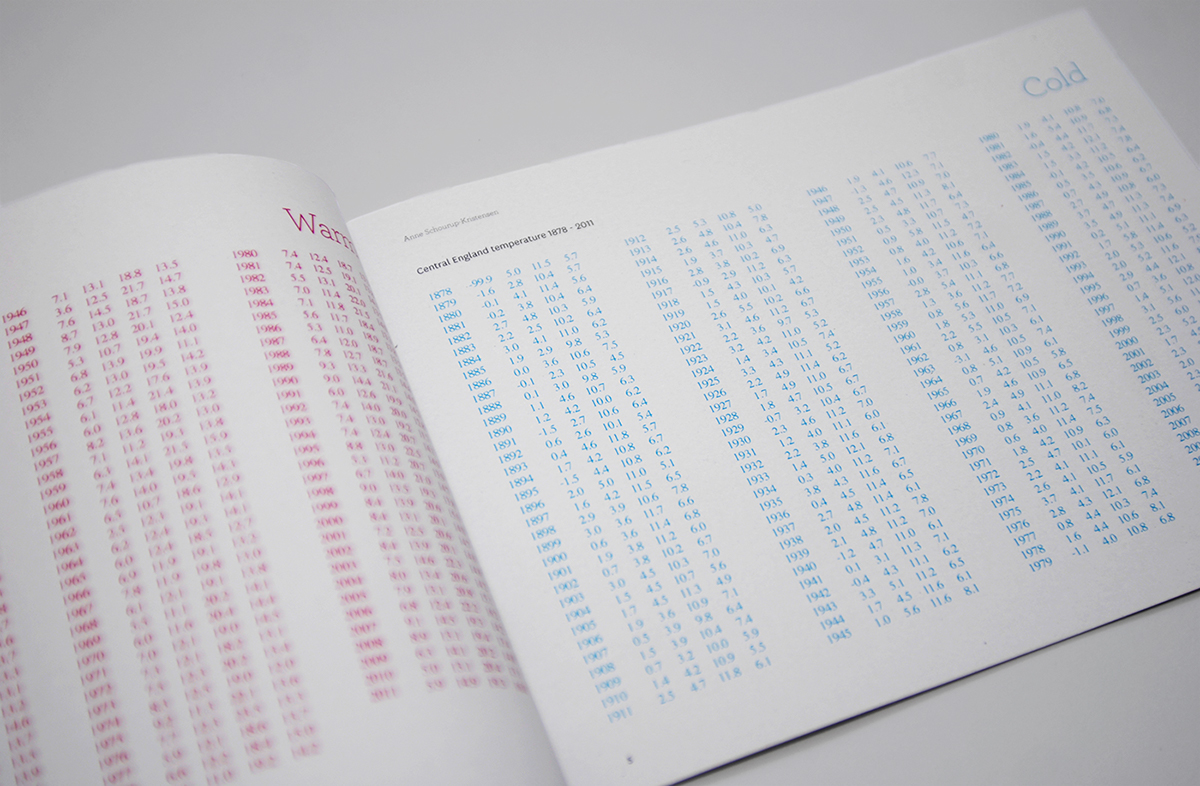
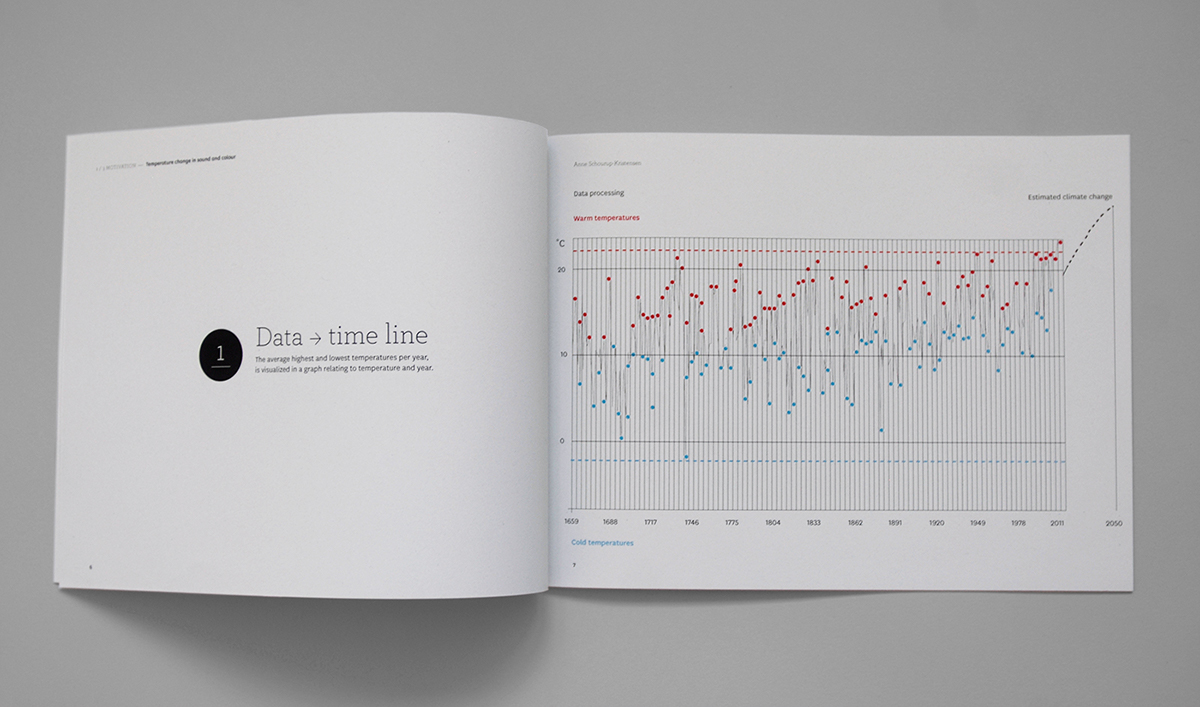
Data. Average warm and cold yearly temperatures (1659-2011).
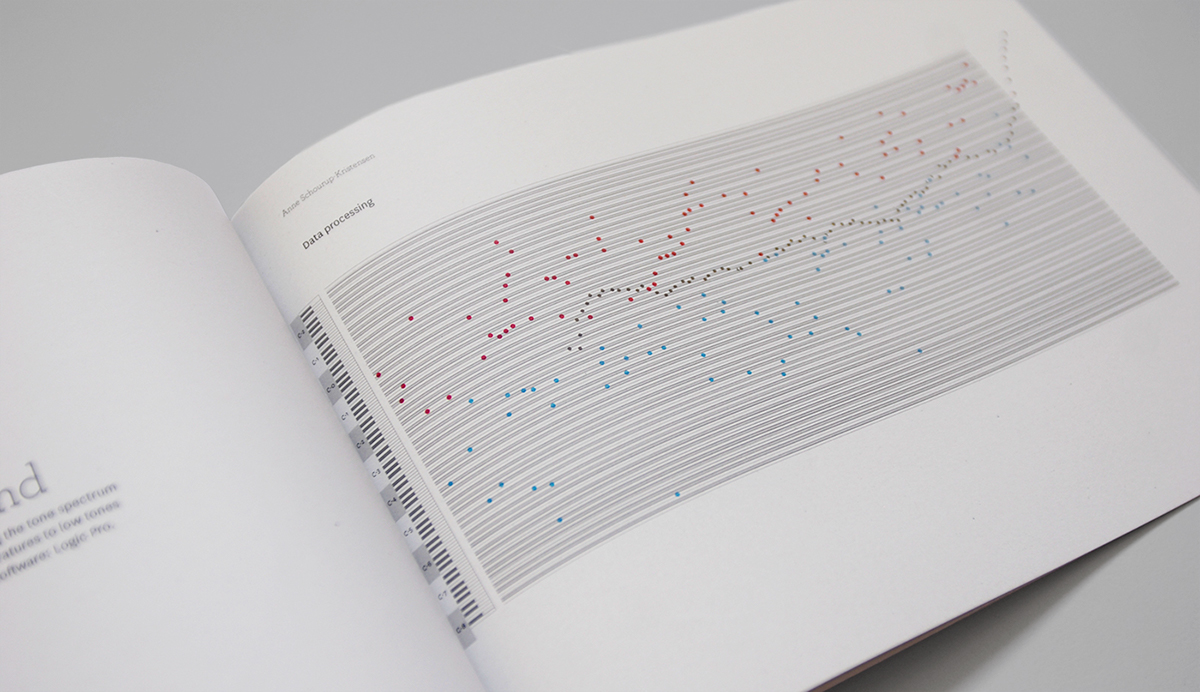
The data is translated to tones using the tone spectrum from a piano, relating warm temperatures to low tones and cold to the high. Composing software: Logic Pro.
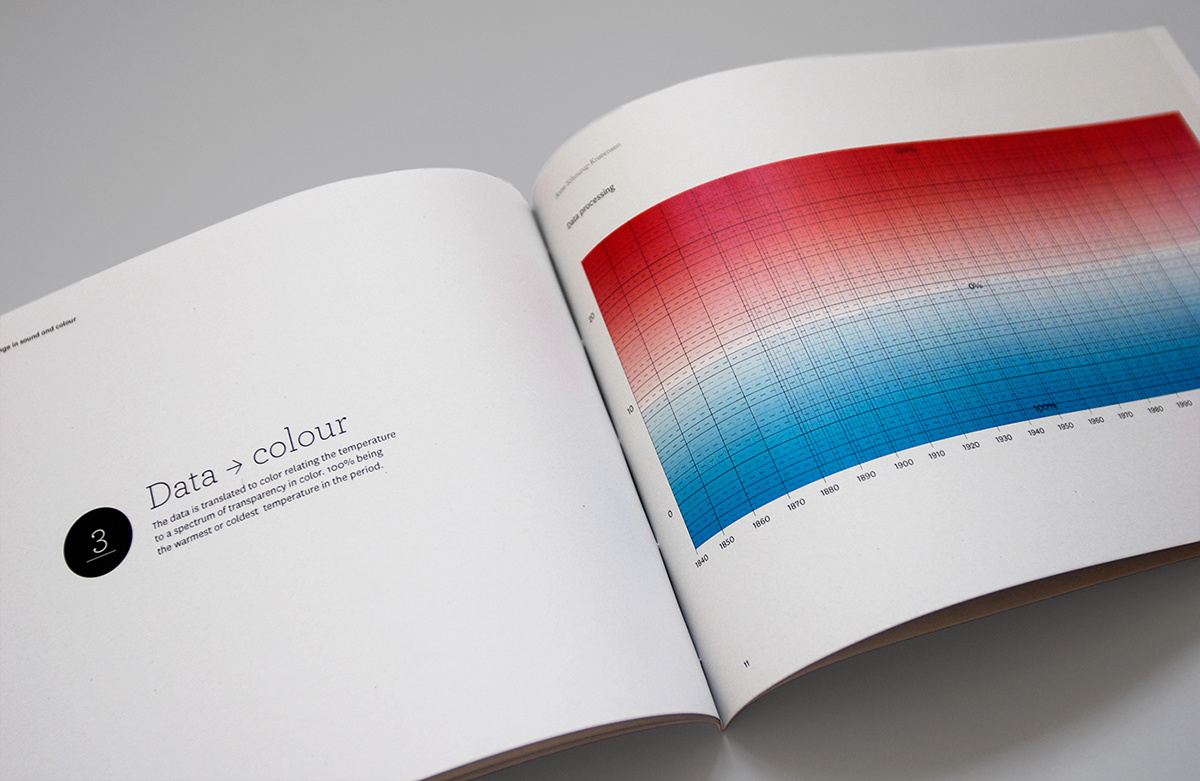
The data is translated to color relating the temperature to a spectrum of transparency in colour. 100% being the warmest or coldest temperature in the period.
Experiment outcome: 2 min. visualization of data with use of sound and colour.


