For my senior capstone project, I made an interactive experience for an exhibit at the University of Colorado Natural History Museum. The exhibit is about research done at the university dealing with climate change's effects on grasshoppers in Colorado.
Background:


Gordon Alexander (left) and César Nufio. Photos courtesy of Don Van Horn and César Nufio.
Starting in 1958, Dr. Gordon Alexander at the University of Colorado began surveying grasshopper species in the area around Boulder, CO all across the elevation gradient. HE and his team collected over 24,000 specimens. The collection remained untouched for nearly 50 years until César Nufio rediscovered the impressive collection. Nufio decided to resurvey the sites Alexander collected from to see how climate change affected the grasshoppers. The survey sites were near weather stations, meaning climate data was readily available. The new study found the insects were being affected in a variety of ways, including their phenology, performance, and distribution.
The Project:
I created the interactive using p5.js, HTML, CSS, and Javascript. There are three parts for each of the major areas of study: Phenology, Performance, and Distribution.
Performance
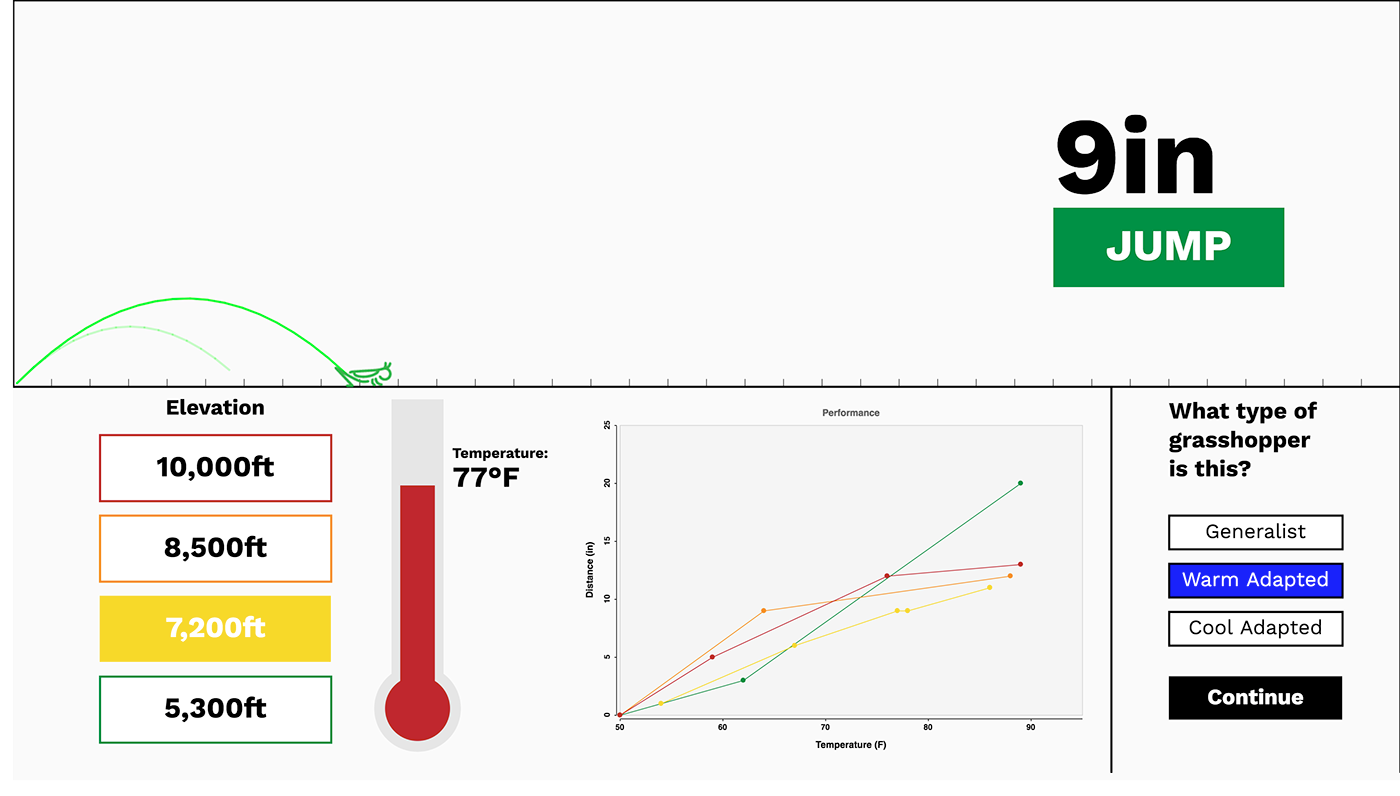
This portion deals with the grasshopper's ability to perform, or more specifically hop, at different temperatures and elevations. The user changes the elevation and temperature to affect the distance the grasshopper jumps. The graph logs each jump so the user can see the overall trend. The goals is to figure out what temperature range this grasshopper is best suited for.
Phenology
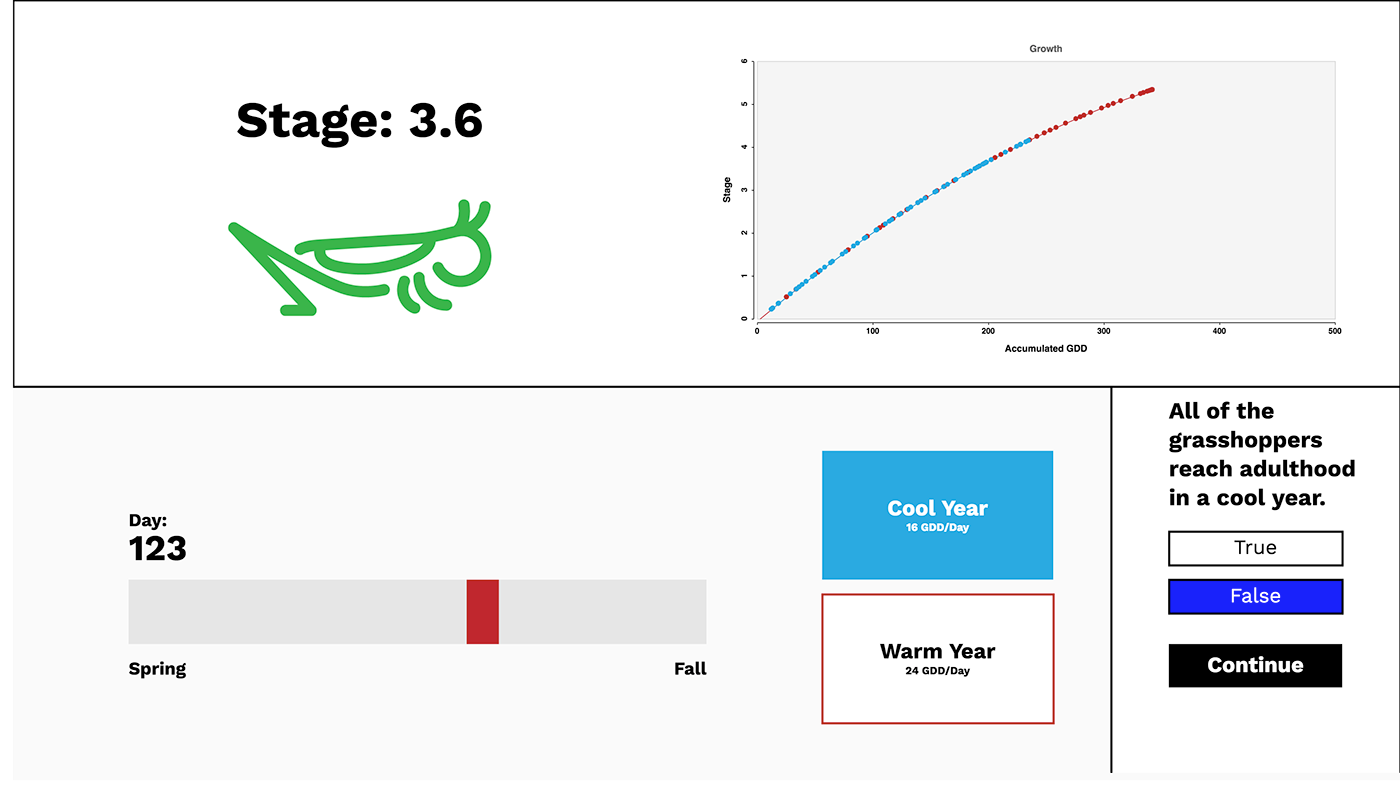
This portion deals with the grasshoppers' rate of growth based on temperature. The user decides how many heat units or growing degree days (GDDs) the population of grasshoppers has available to them to grow with. The stage refers to the average life stage, out of 6, the population is at the given day.
Distribution
The final portion deals with how different species are distributed. Throughout the year, the researchers would find grasshoppers from the prairie at higher elevations than they expected. These "accidentals" could be the beginning of a shift in population distribution.

Explanations
Each interactive portions also includes an introduction and conclusion page to guide the user along. The introduction introduces background information and the conclusion reiterates what they should have learned and expands on what was in the interactive.


The Process:
The UI went through several revisions before it was ready. The images below show how the performance interactive changed from prototype to final product.


The addition of the quiz question was an important step. Initially, the interactive was going to be more of a sandbox where the user explores the data freely. The quiz question made it more of a goal-oriented game when the user is trying to find an answer.
The graph was also an important addition because it helps the user visualize the trends the researchers found. One of the exhibit's goals is to encourage interest in science, and the graphs help encourage scientific thinking while using the interactive.