
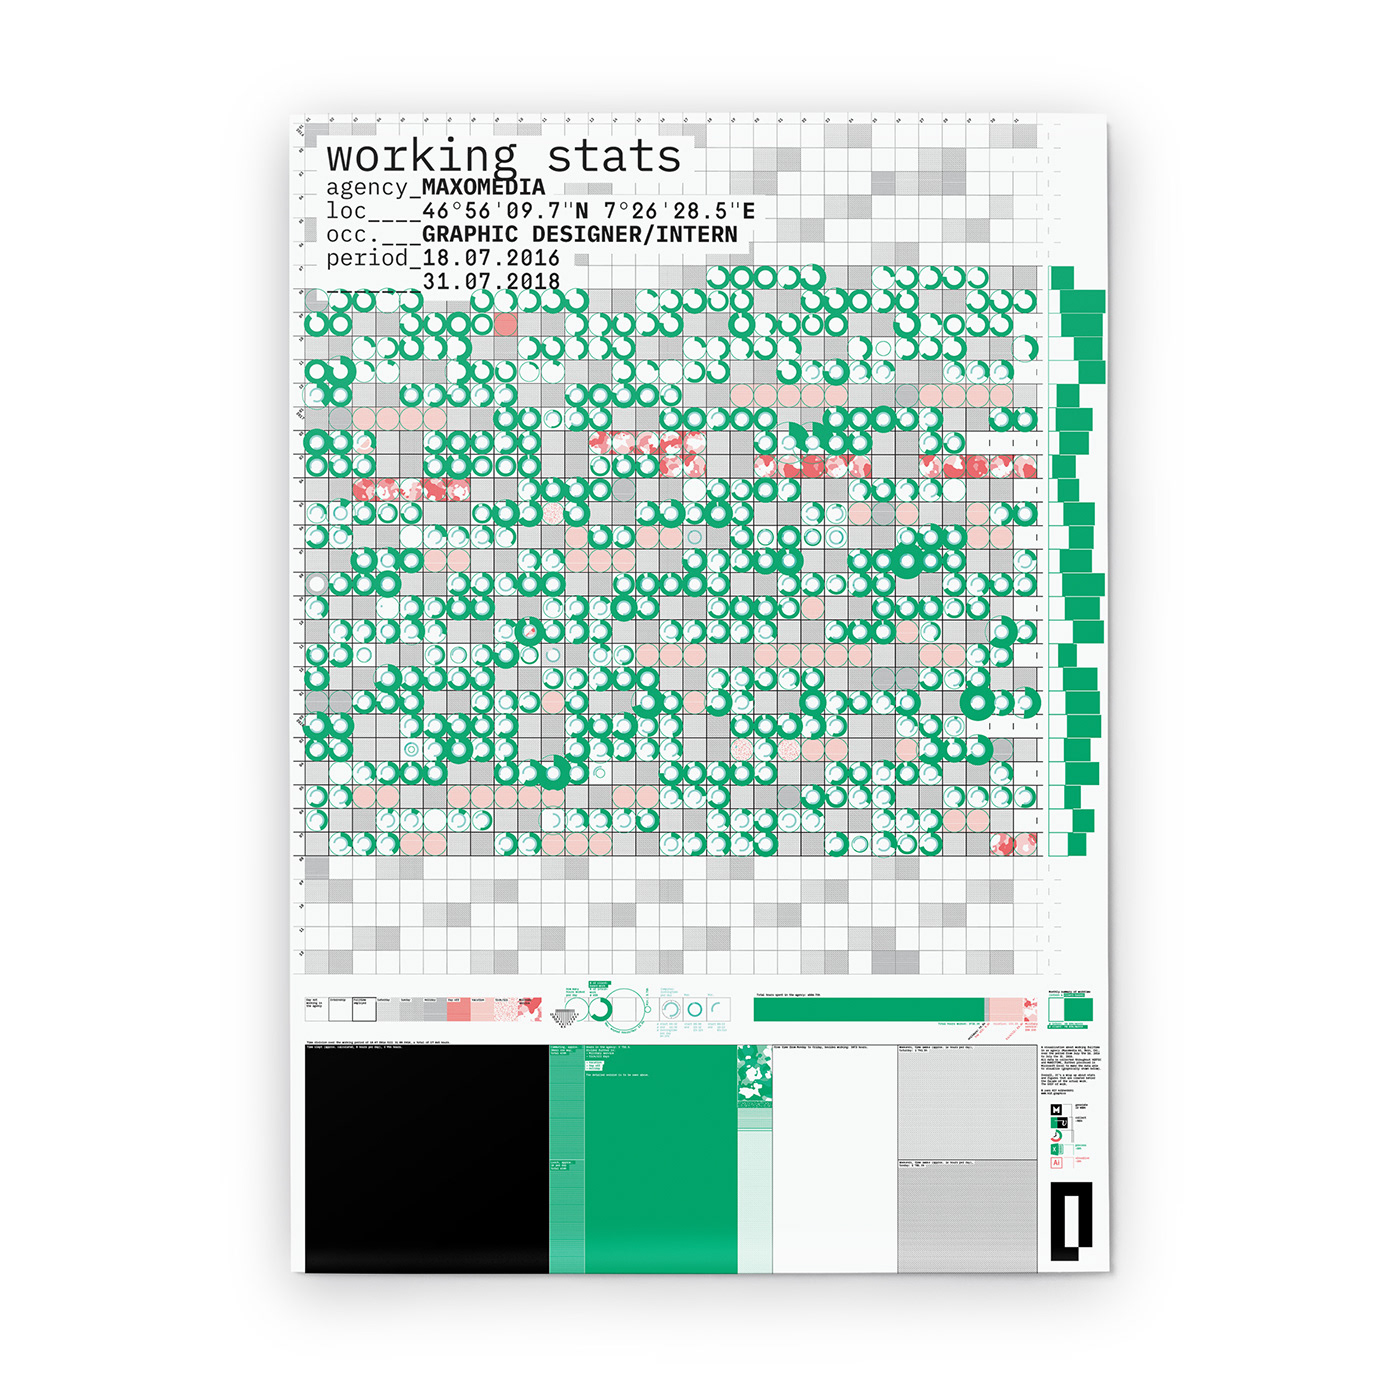
Nine to five, 2016/17/18
Graphic visualization poster about working in an agency over the period from mid-July 2016 to end of July 2018.
Below something about the process, which hopefully helps a bit to understand the densly packed pile of information.
So, this was the design and production process.
Of course as neat as seen...
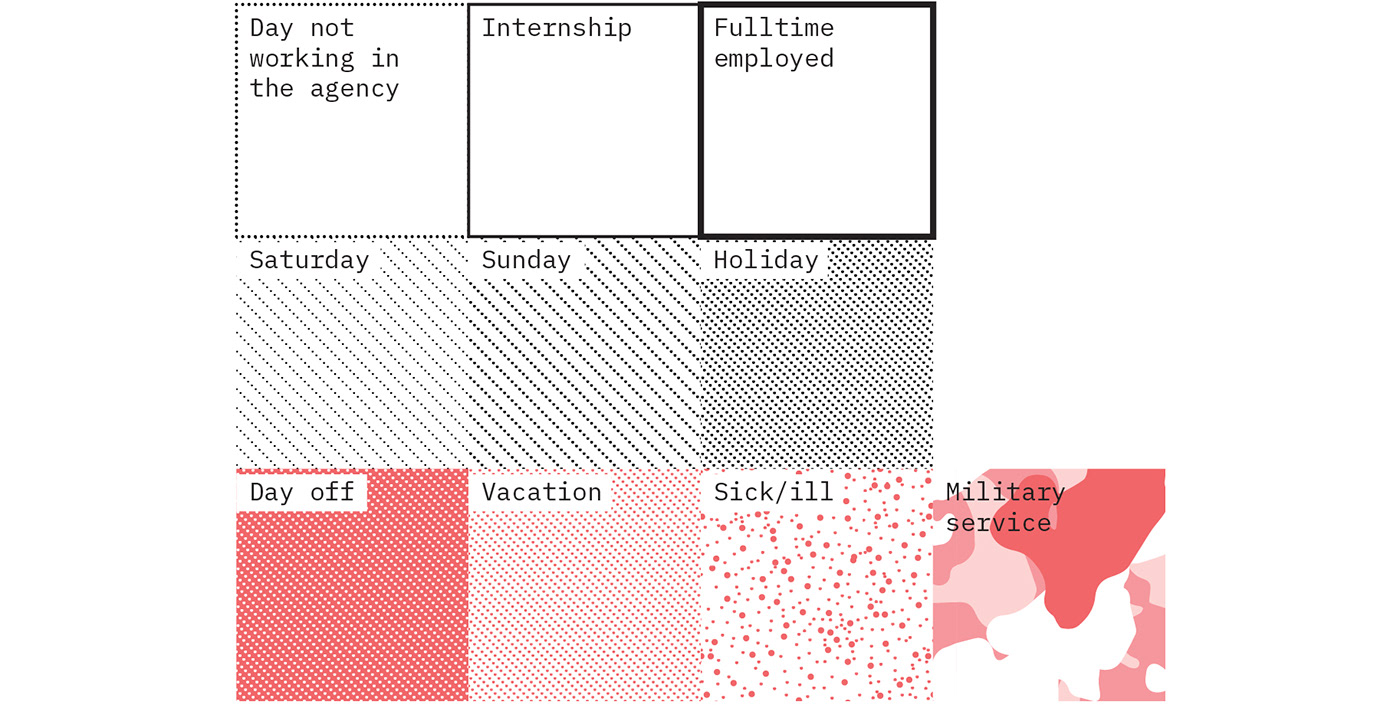
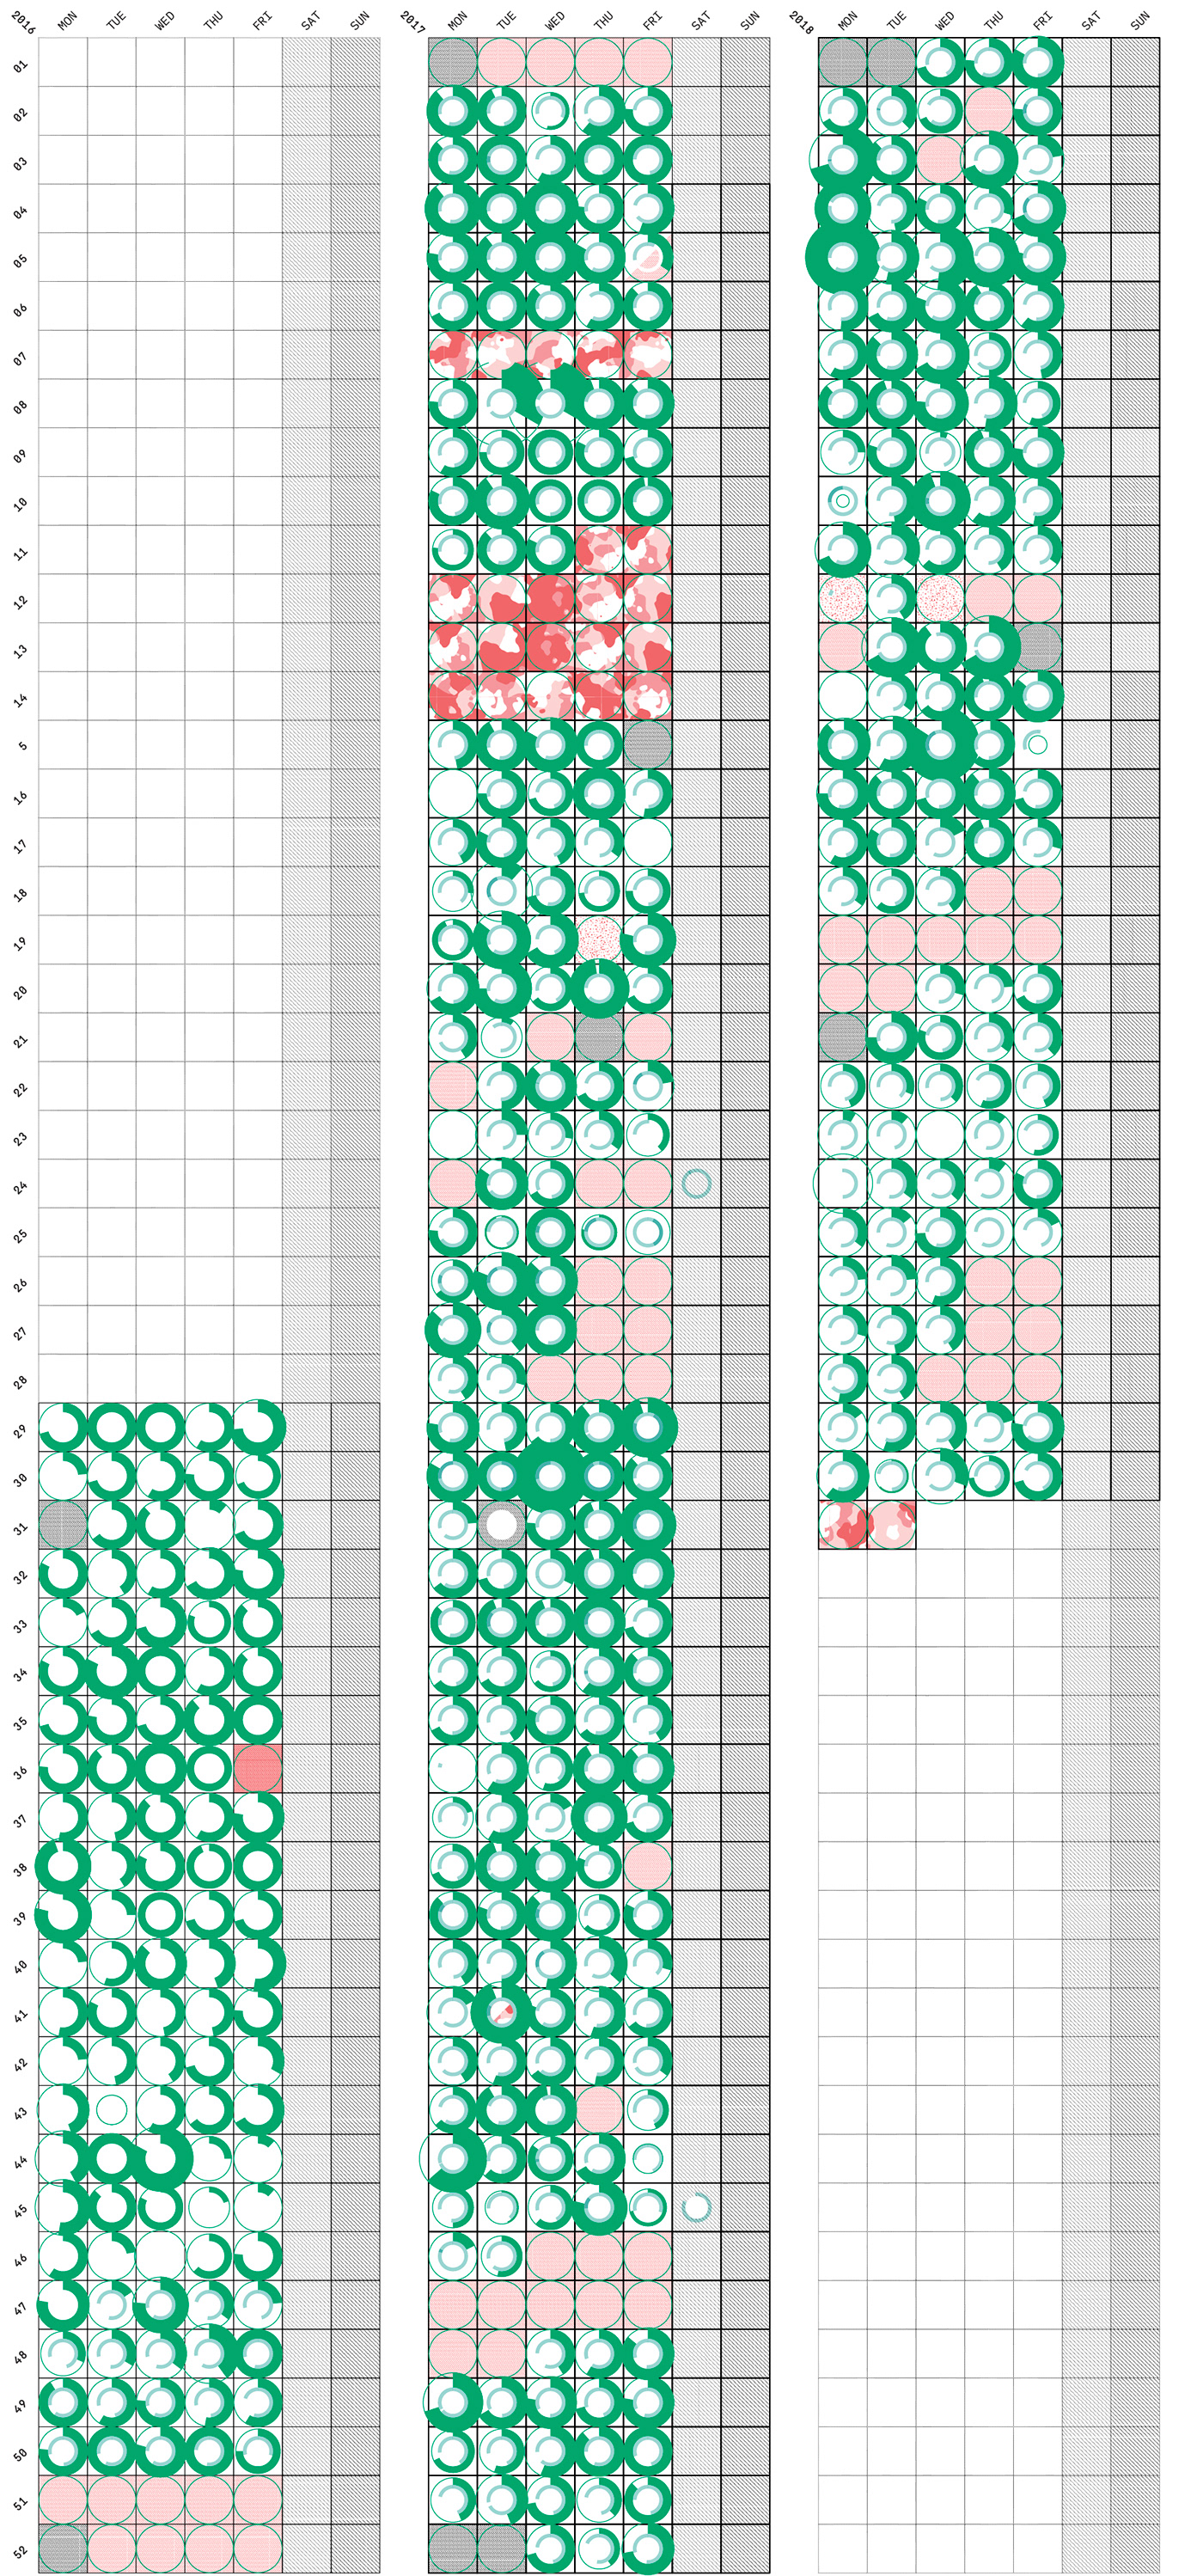
This leads to an individual appearance for each day over the working period.
Have fun with one thousand and ninteytwo squares!
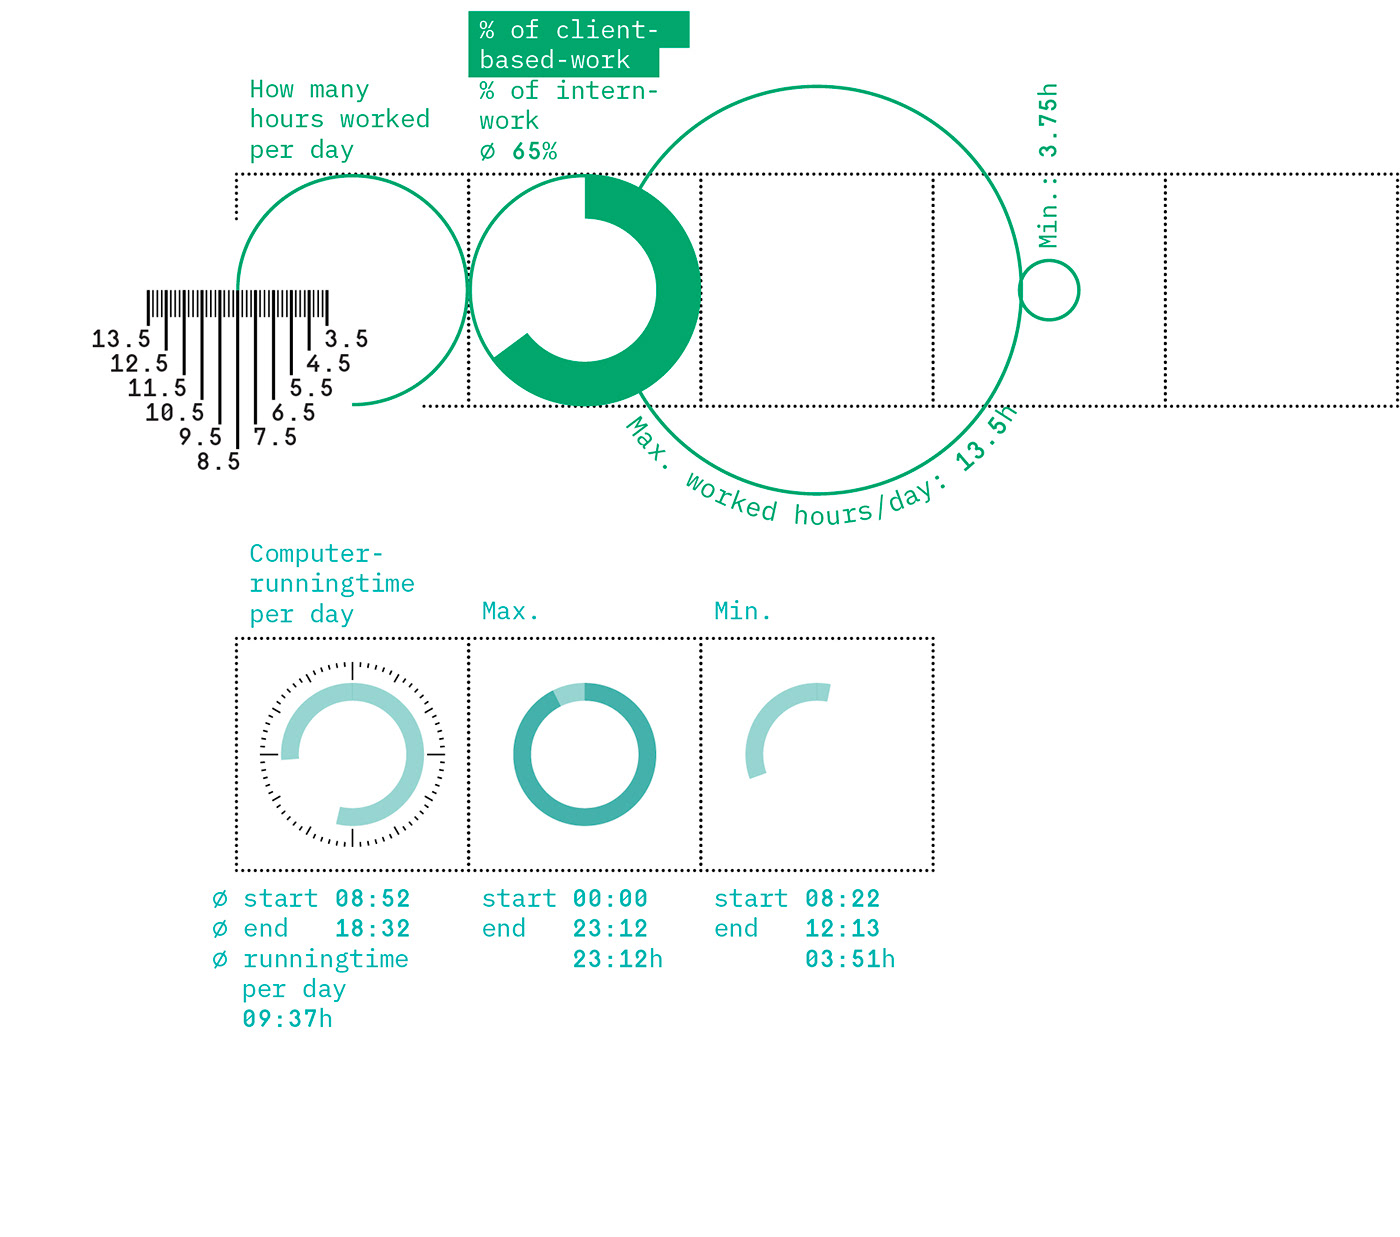
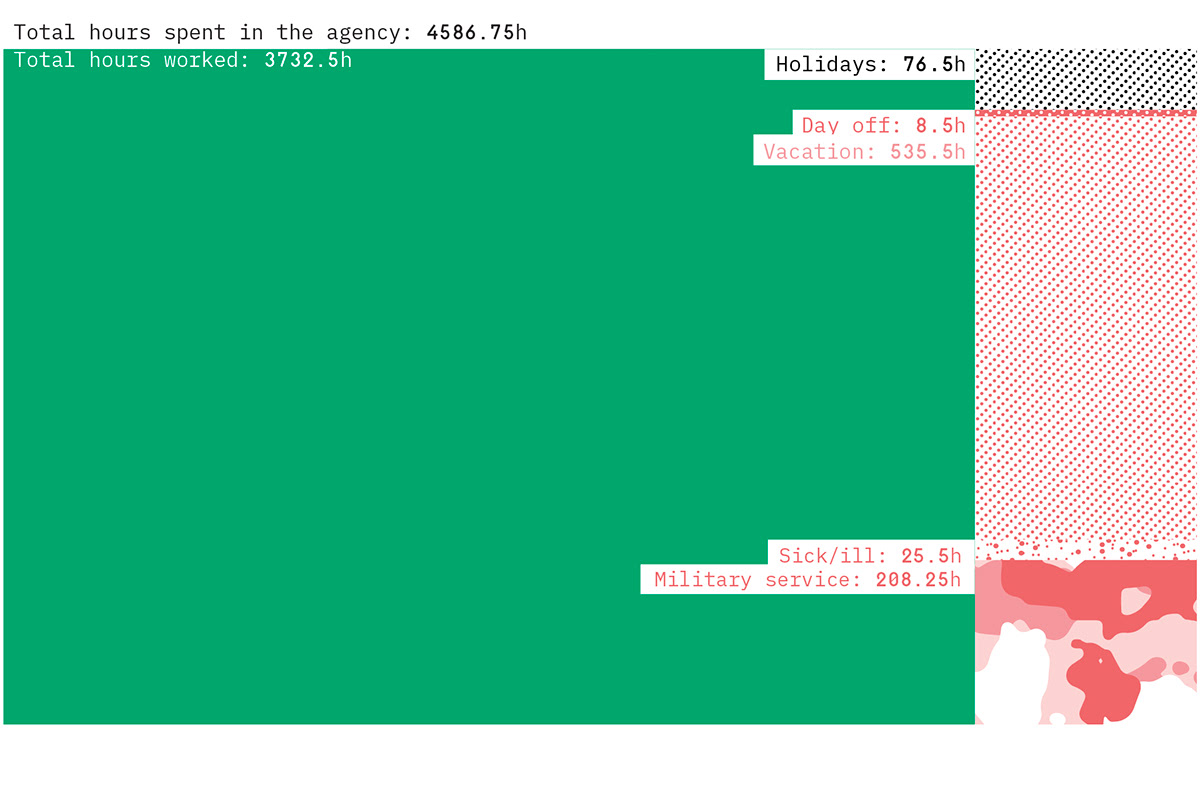
Summarised, you get a distribution of the worked or paid time like the following.
Calculated, or estimated over the whole 24 hours for each day, you get a distribution of about one third of time slept (well, unlikely to be true, because we all get eight hours of sleep, Amiright?). Then luckily more freetime than worked hours.

And of course, all the details would only be nicley visible on the full size F4 format.
So, how's the appearance of your days?
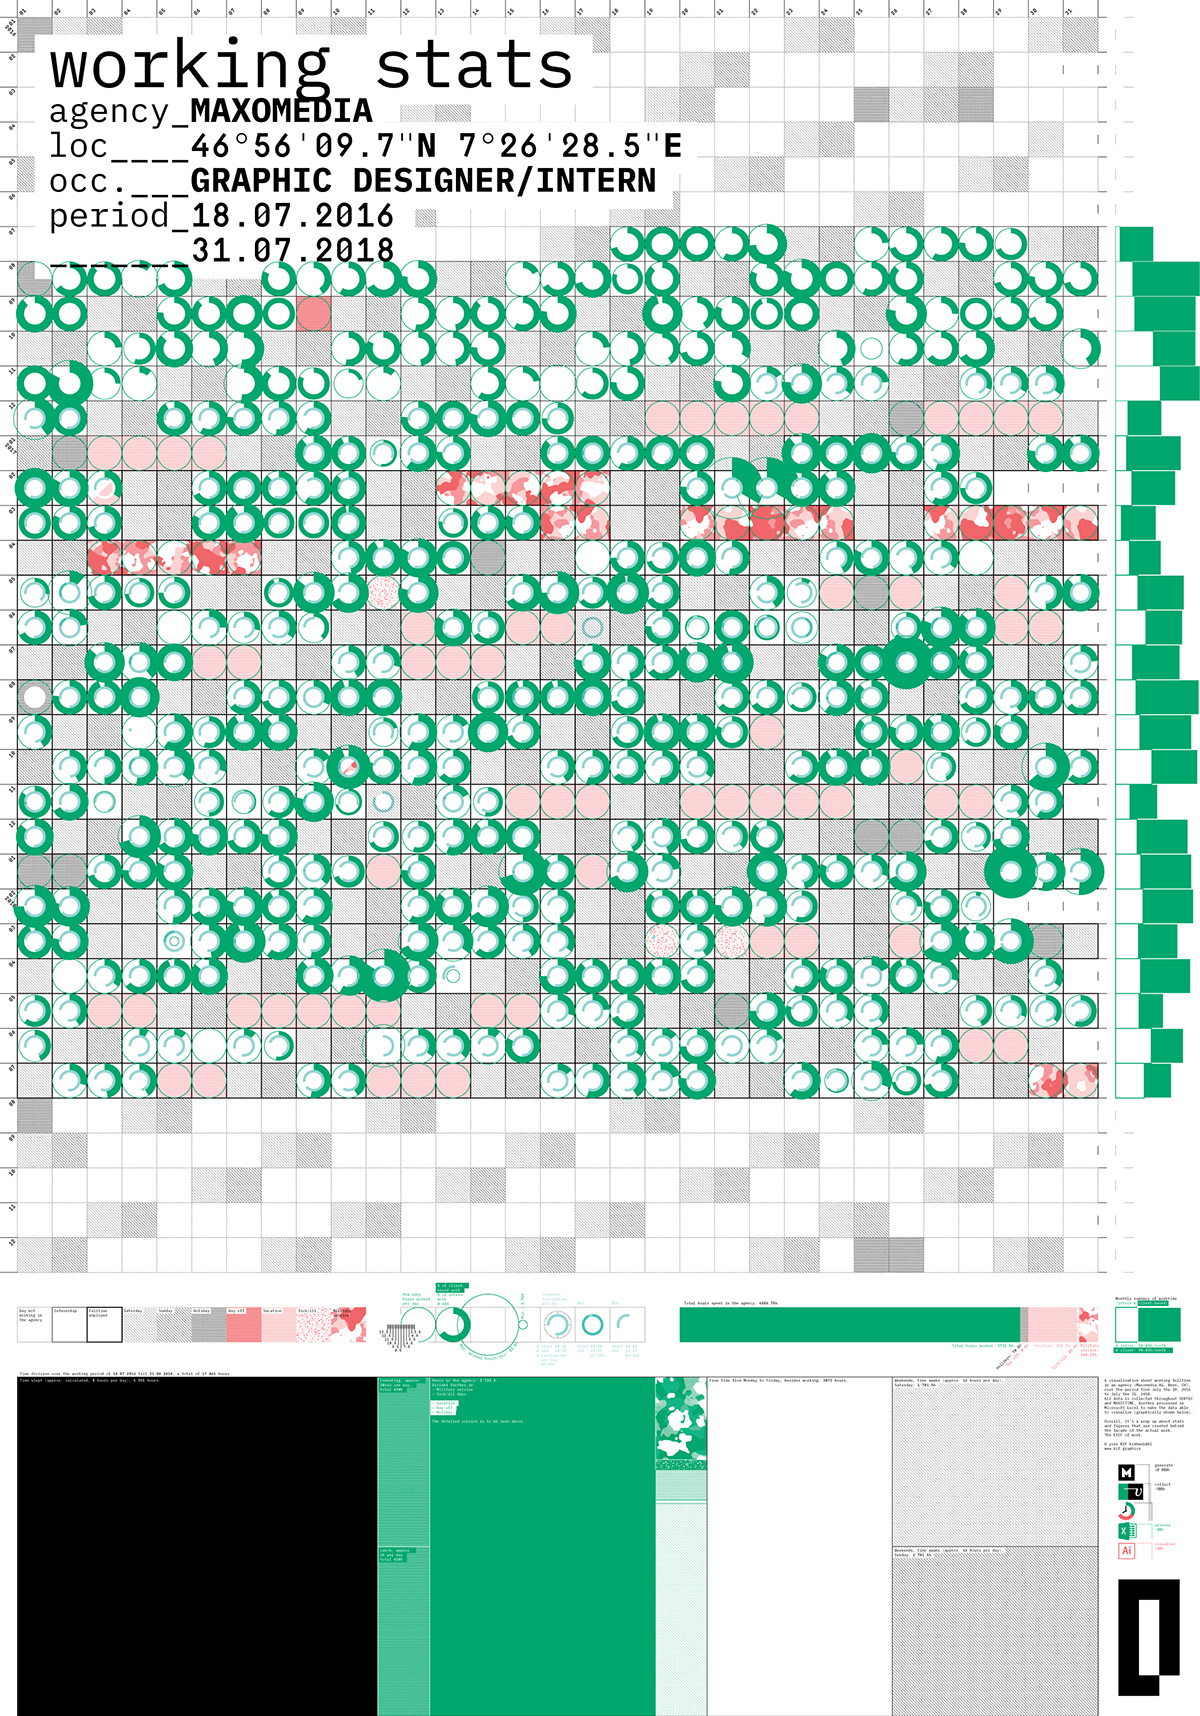
Conception & Production, KIF.graphics | insta


