
WORK SAFETY IN AUSTRALIA
Infographic Poster
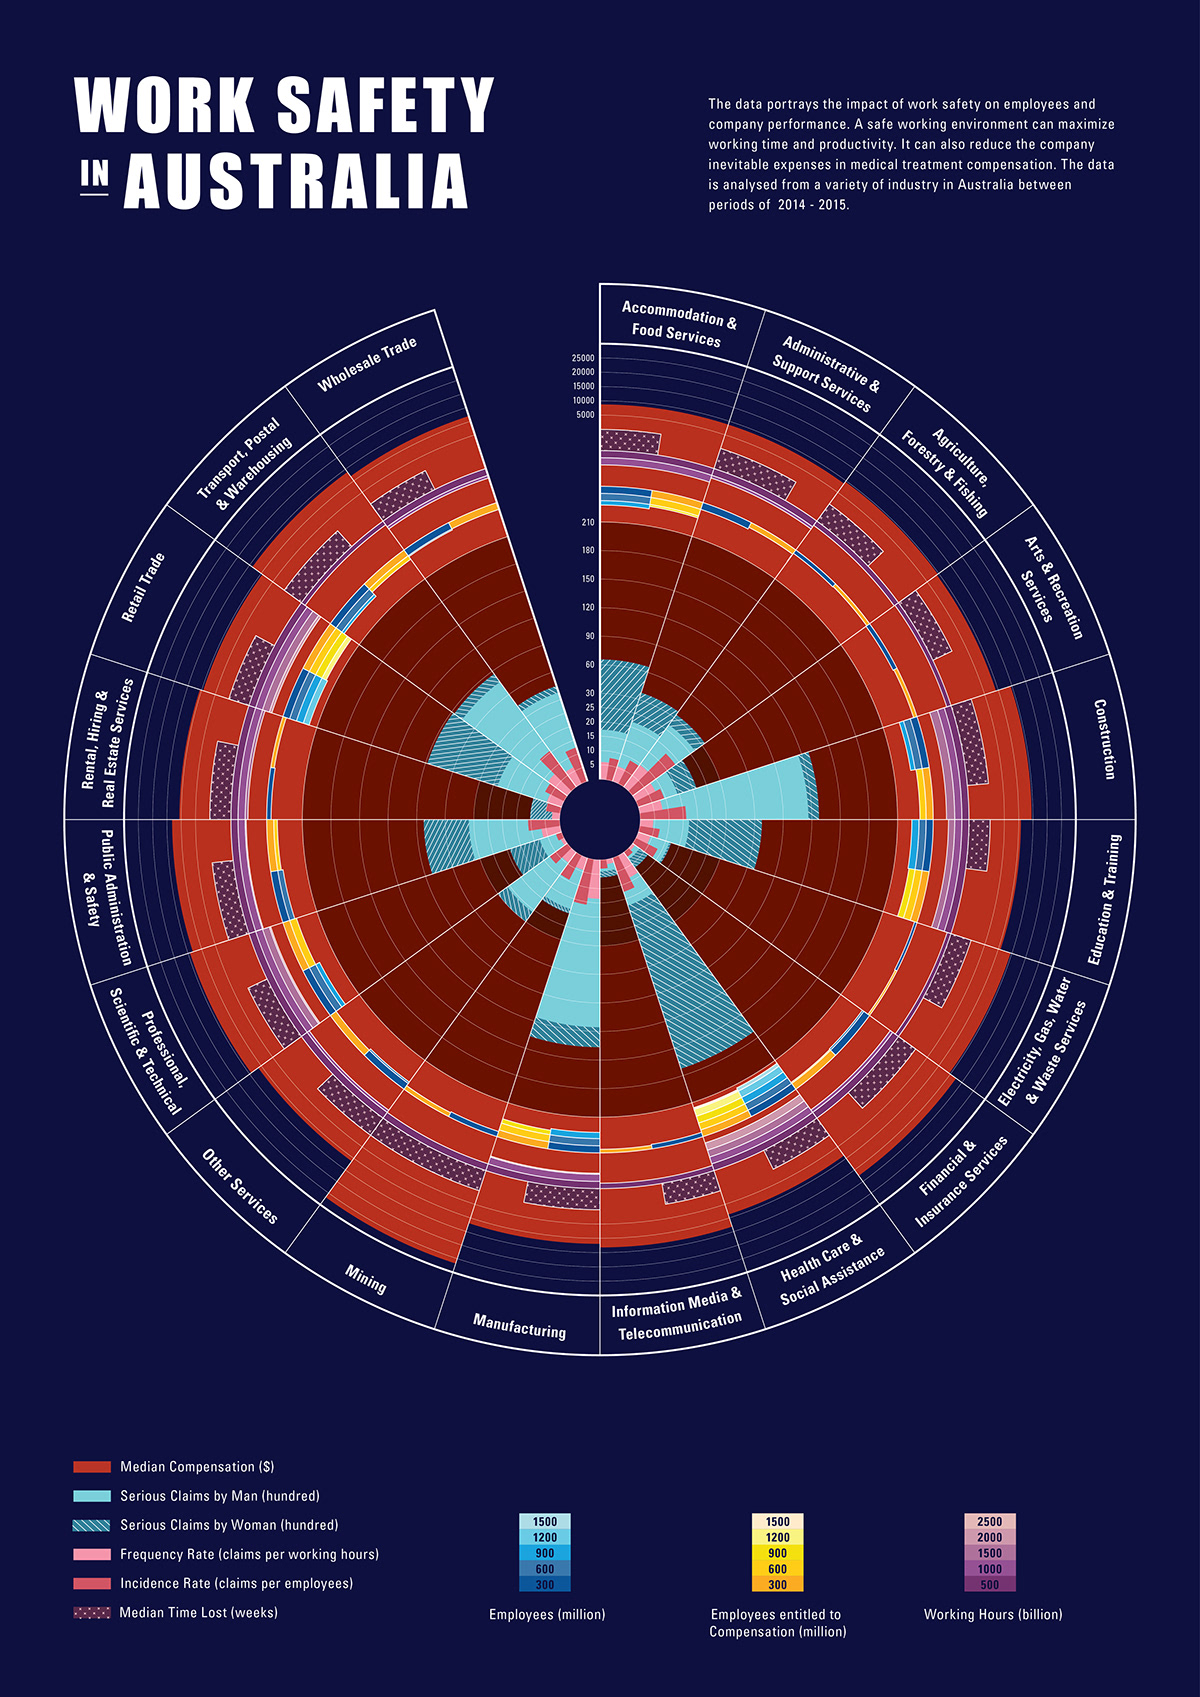
To create an infographic design based on the provided
big data to convey the message of a particular topic.
The infographic was presented using graphic elements
to show patterns and relation between the numbers.
It described the impact of work safety on employees
and company performance by analysing variables
such as: median compensation, number of the serious
claims, the frequency and incidence rate and
the median time lost of productivity.
The data was derived from Safe Work Australia
website (https://www.safeworkaustralia. gov.au/resources
_publications/Statistical-tables), which focused on
the year of 2014 - 2015.


