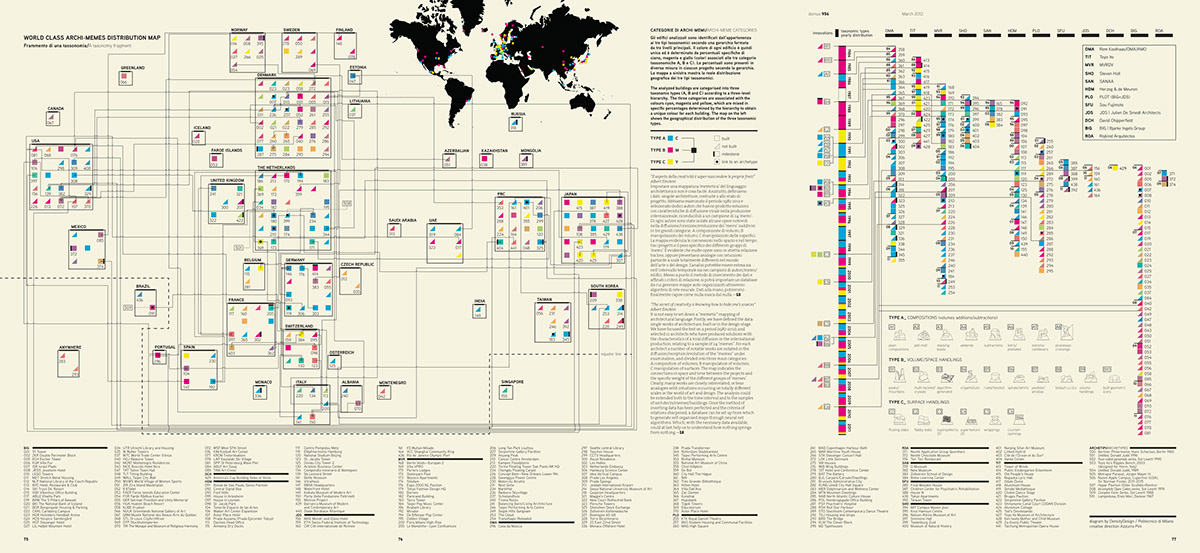
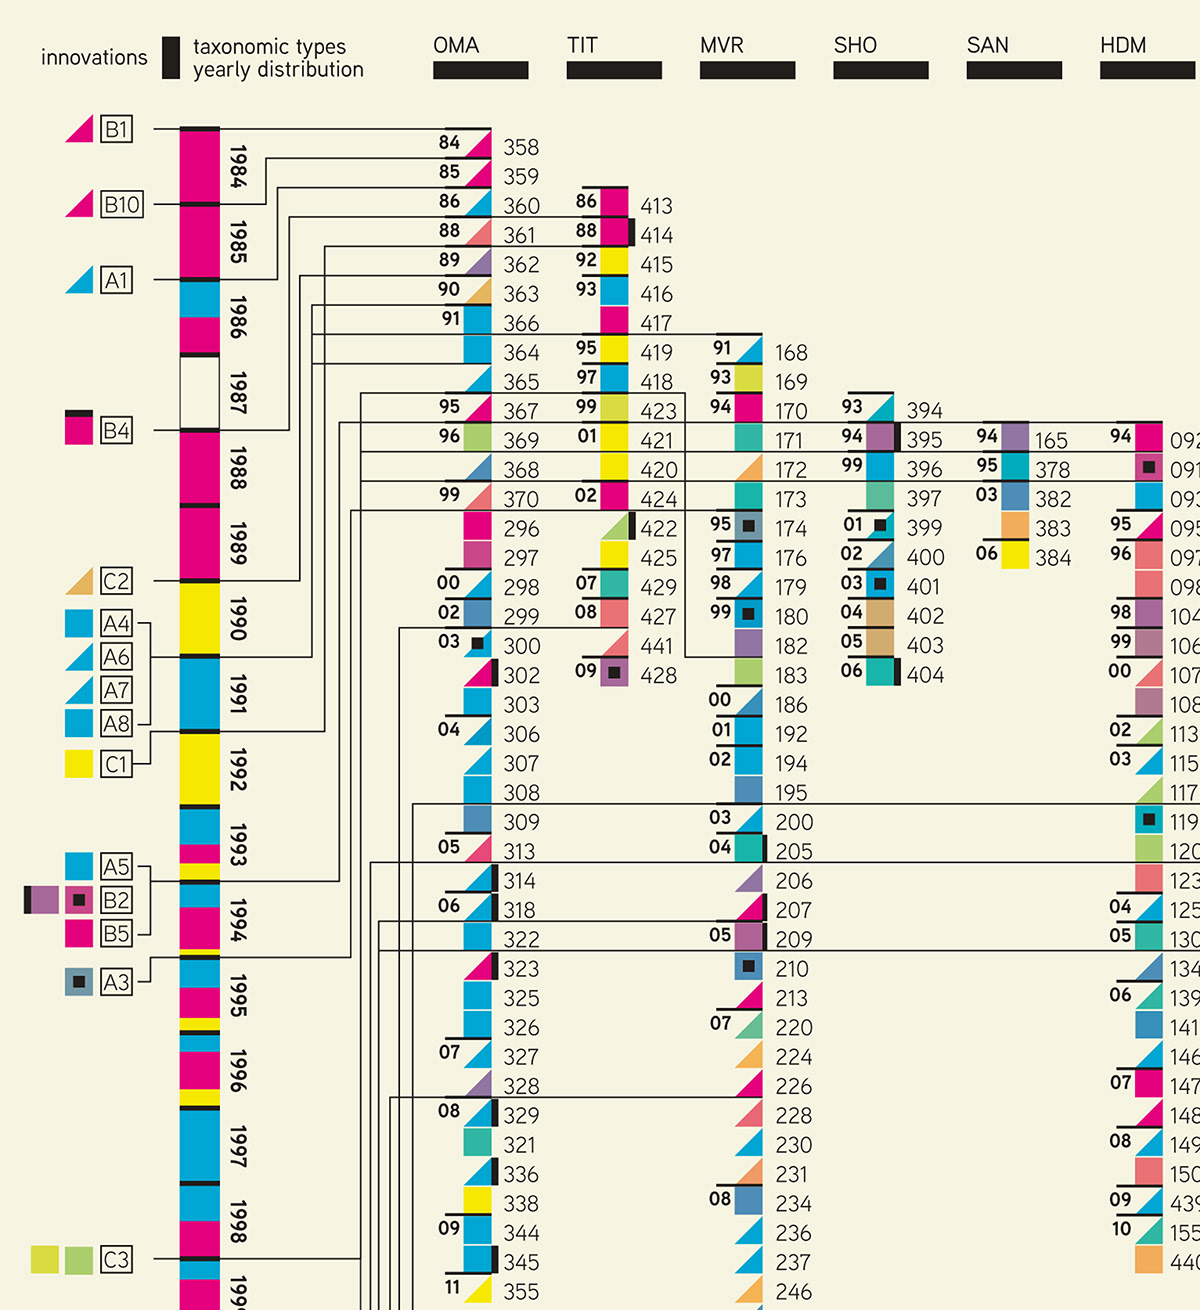
The diagram represents the distribution of archi-memes categories with respect to geography, time and author.
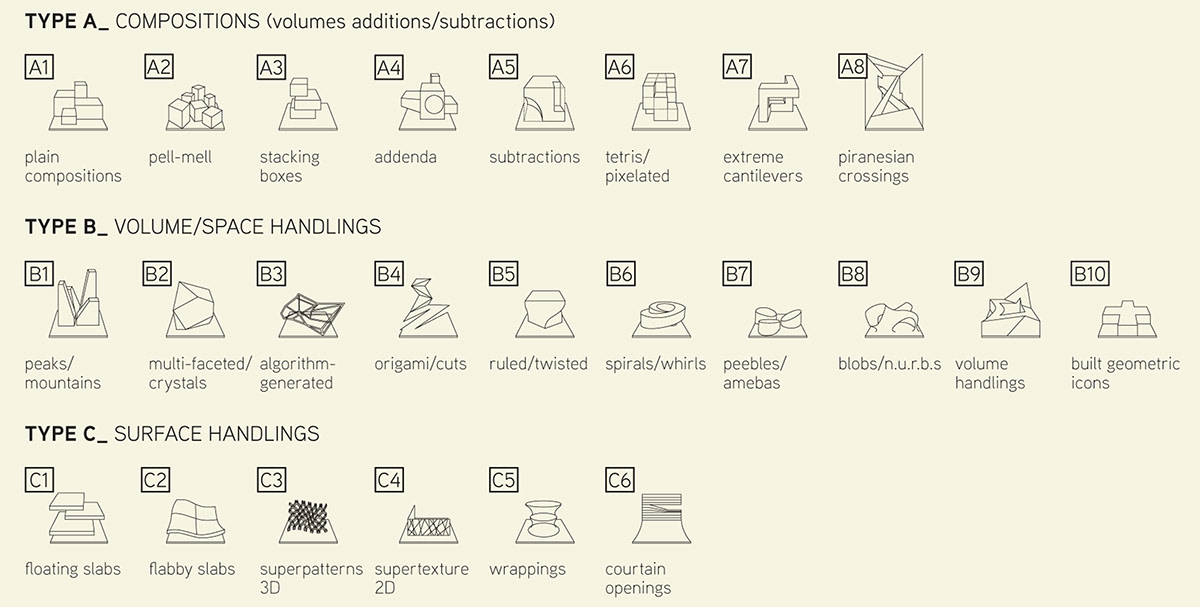
The analyzed buildings are categorised into three taxonomic types according to a three-level hierarchy. The three categories are associated with the colours cyan, magenta and yellow, which are mixed in specific percentages determined by the hierarchy to obtain a unique colour for each building.
The map shows the geographical distribution of the three taxonomic
types.