From reaches to rags
..........................................................................
Authors:
Mariangela Labranca
Carolina Mauri
This infographic has been created on the occasion of the Global Visualizing Marathon 2012. We have chosen the dataset on worldwide flights.
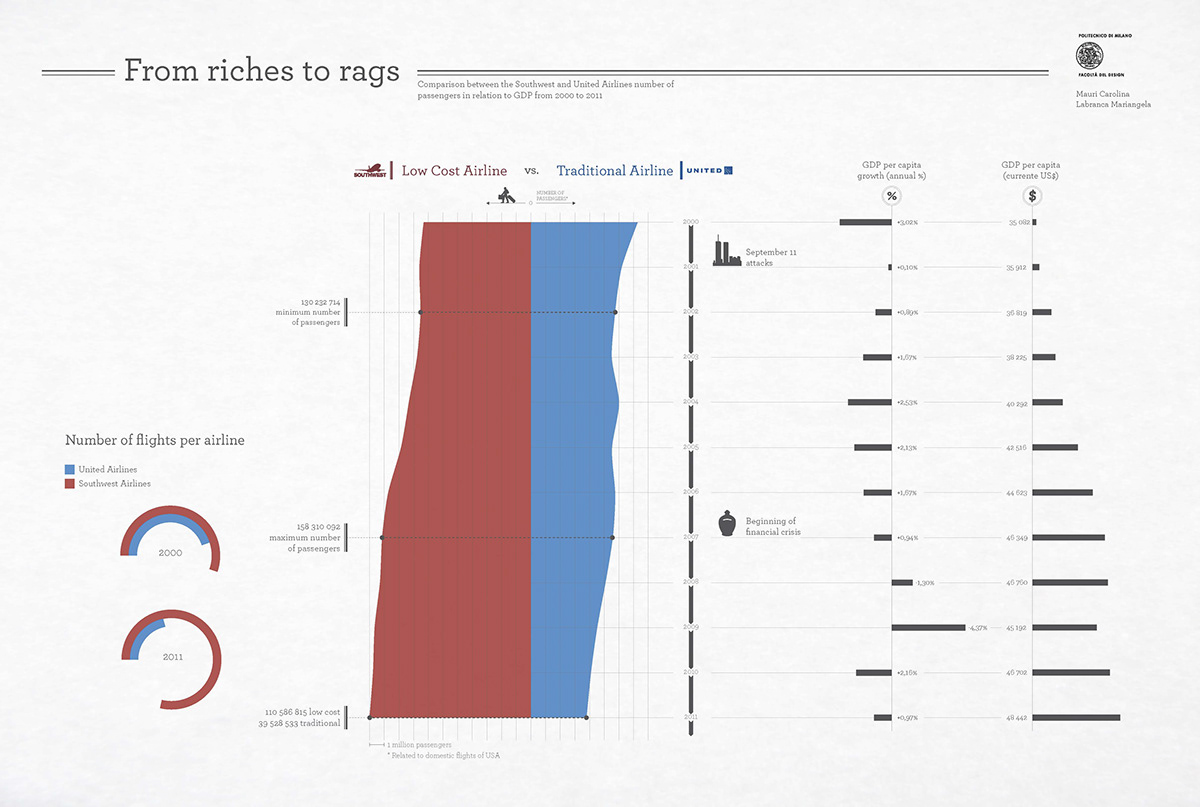
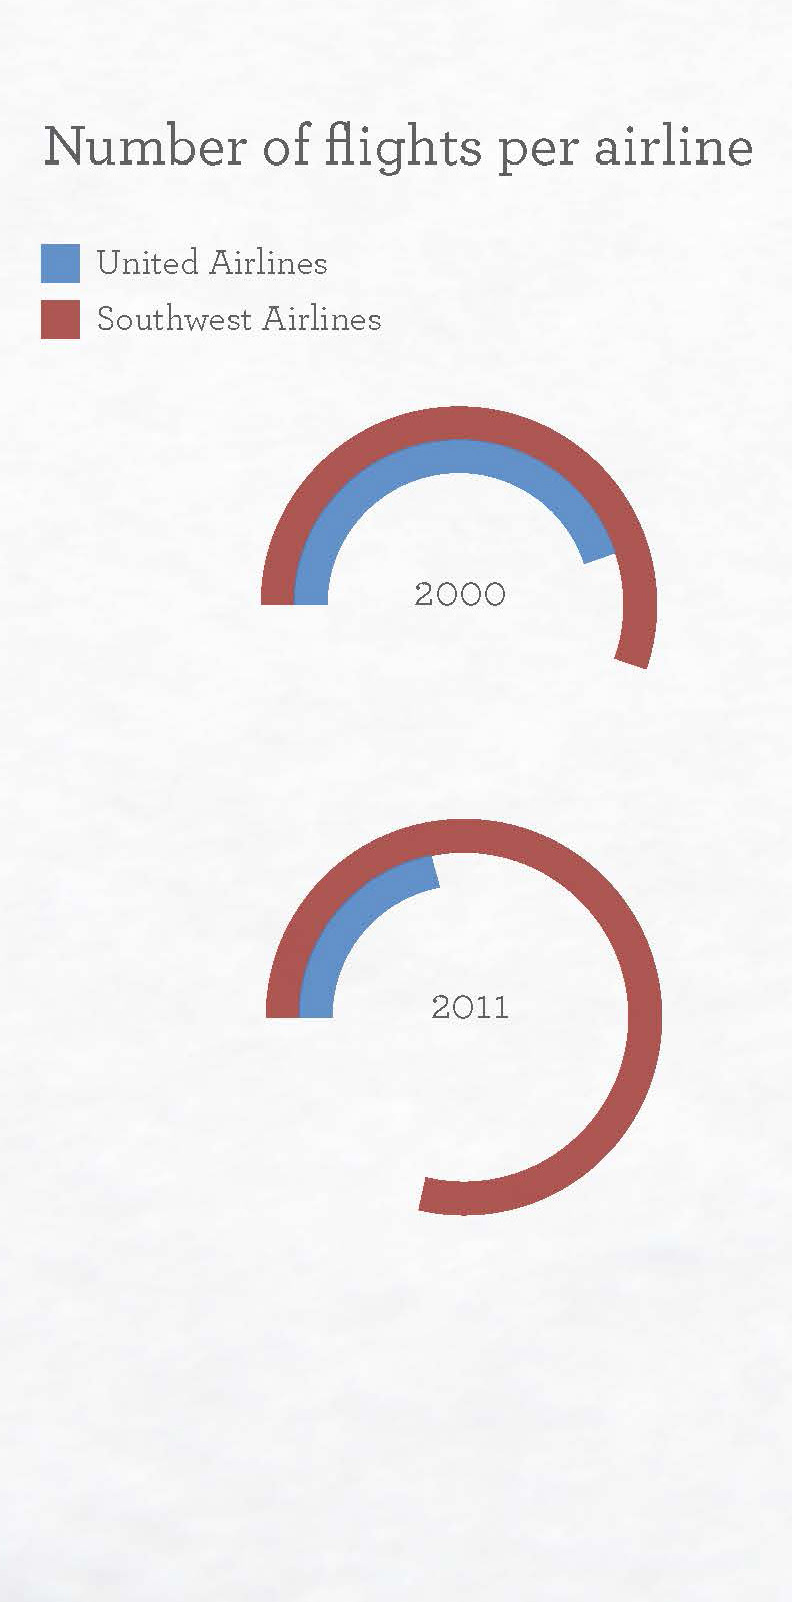
From the dataset we got the data to show the trend of two american airlines’ passengers: United Airlines’ and Southwest Airlines’, a national line and a low cost.
These data have been compared with those of the GDP (Gross Domestic Product): we can see how the scheduled airline’s passengers decreased, while those of the low cost airline increased. We can deduce that the economic crises actually influences these trends.