Infographics / dashboards: Q3-Q4 2012
Raconteur / The Times / The Sunday Times Newspaper Data Visualisation
.-.-.-.-.-.-.-.-.-.-.-.-.-.-.-.-.-.-.-.-.-.-.-.-.-.-.-.-.-.-.-.-.-.-.-.-.-.-.-.-.-.-.-.-.-.-.-.-.-.-.-.-.-.-.-.-.-.-.-.-.-.-.-.-.-.-.-.-.-.-.-.-.-.-.-.-.-.-.-.-.-.-.-.-
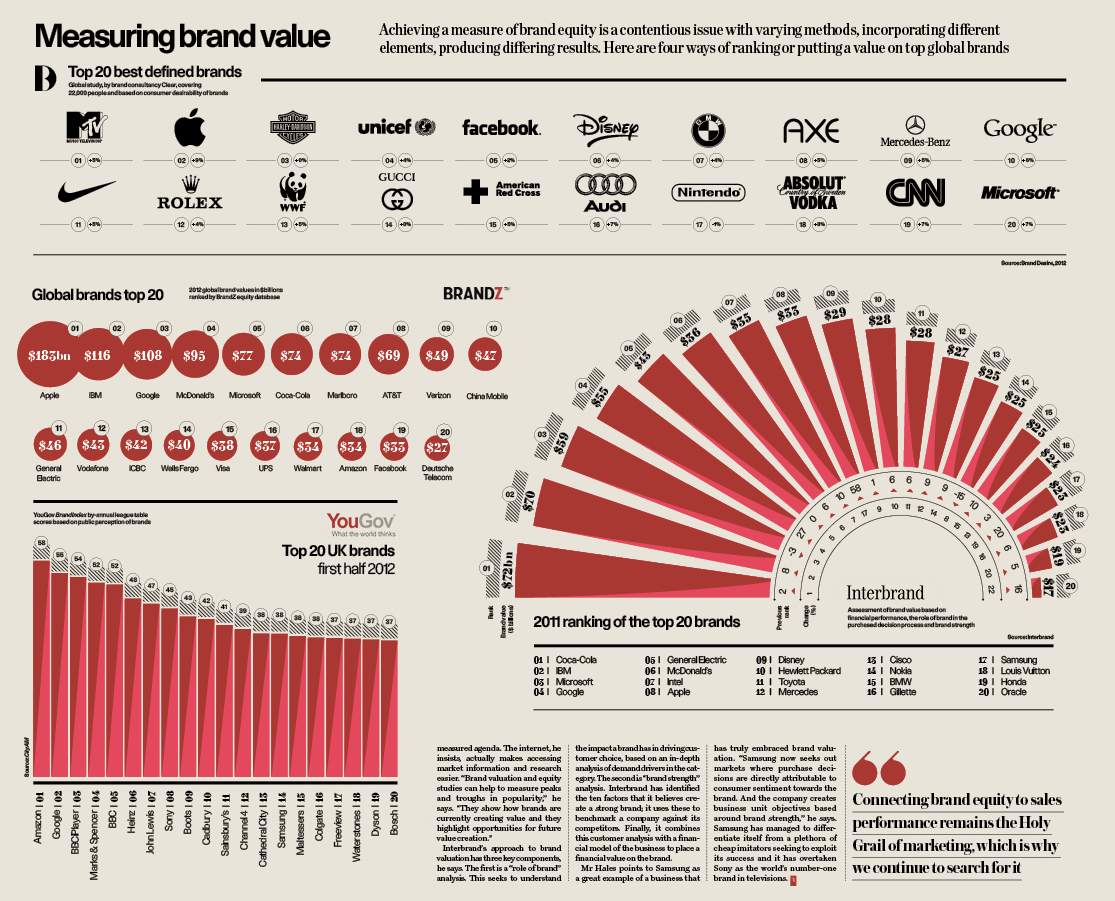
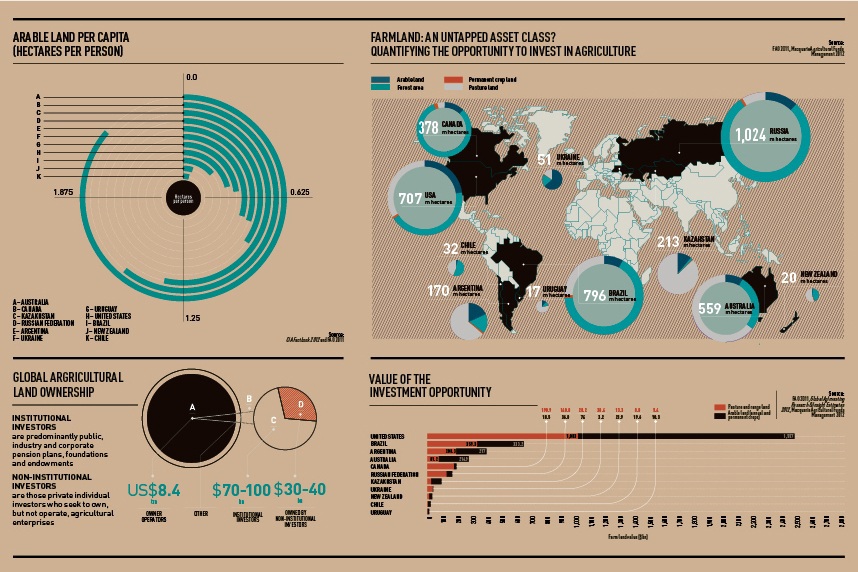
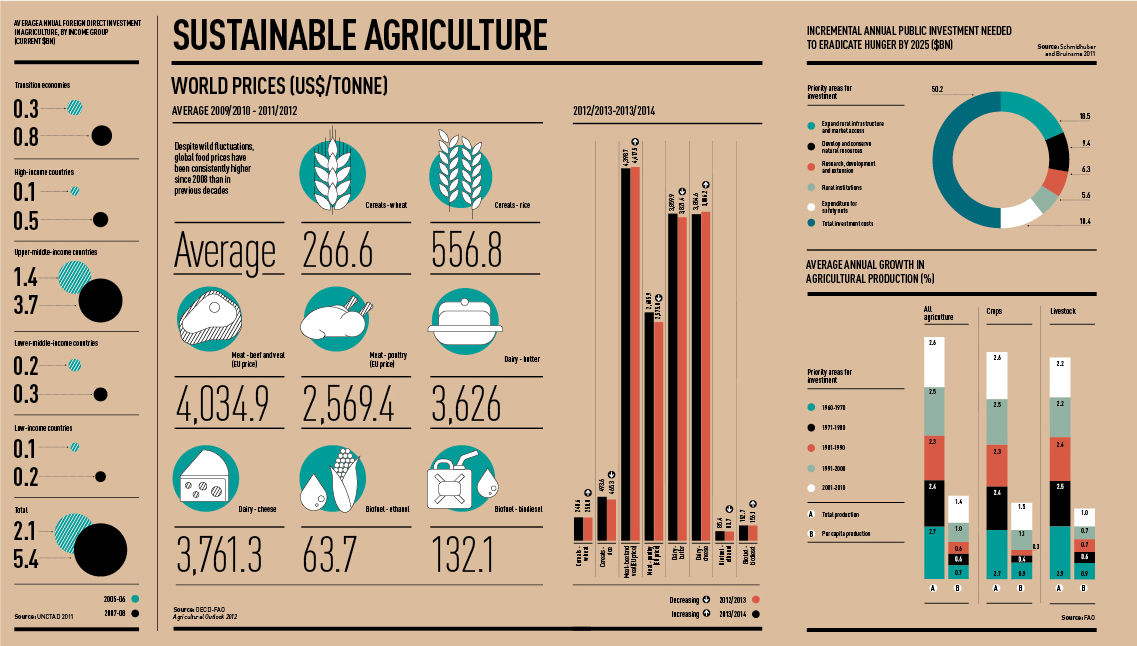
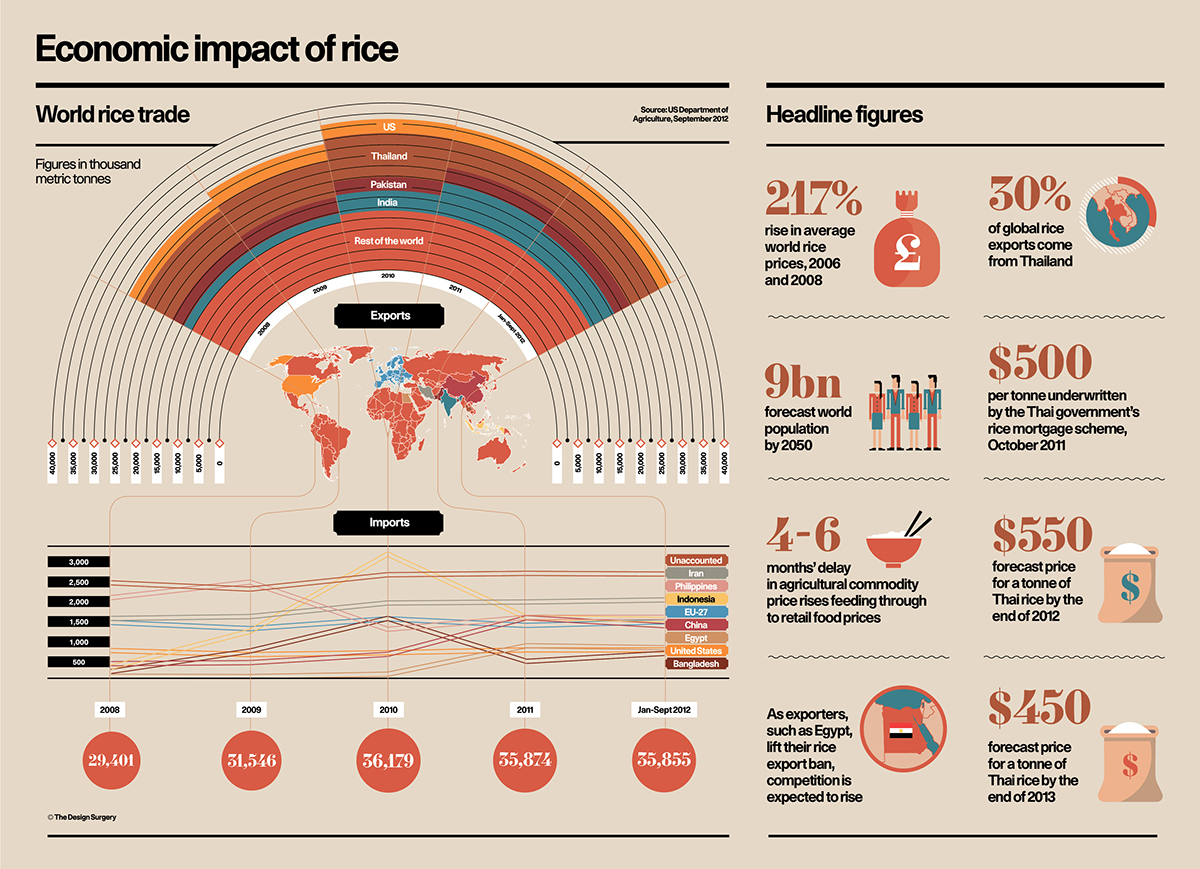
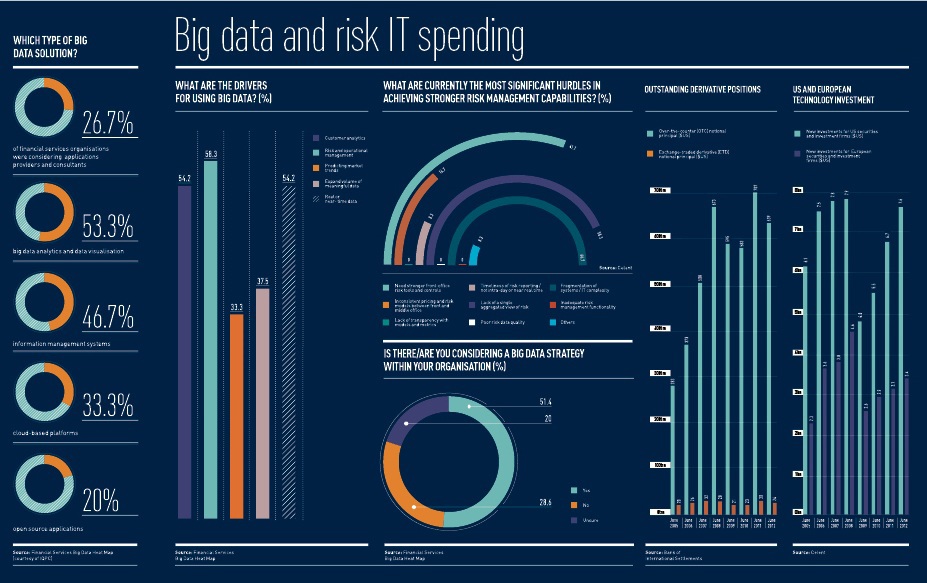
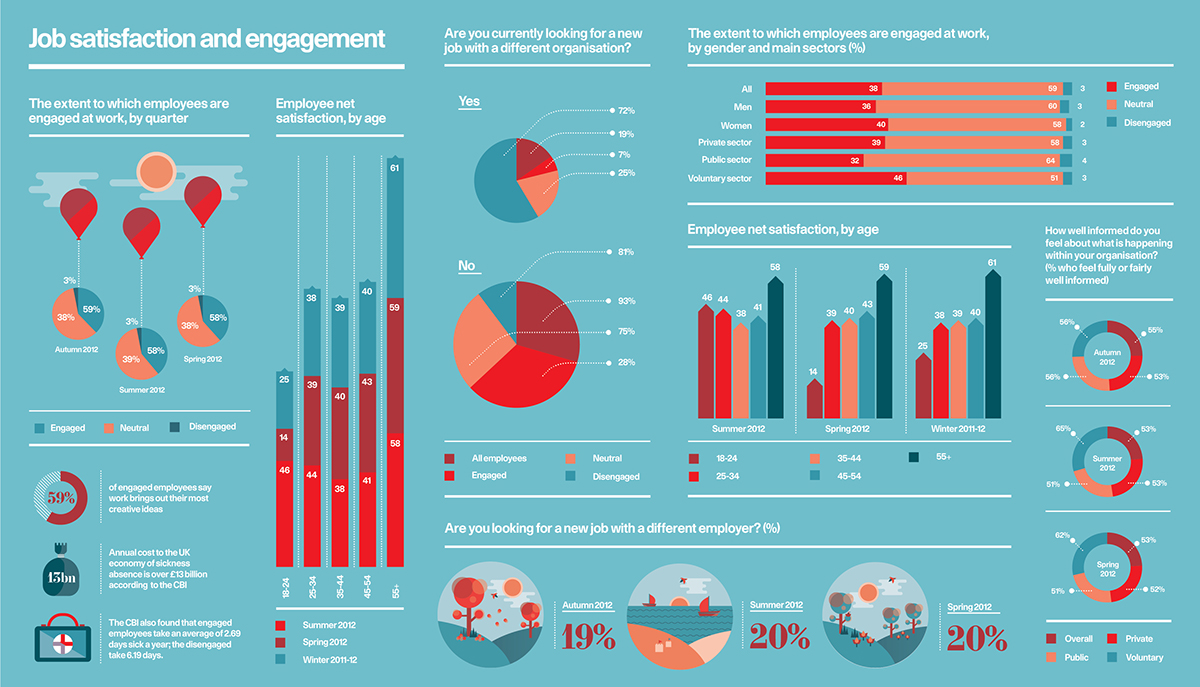
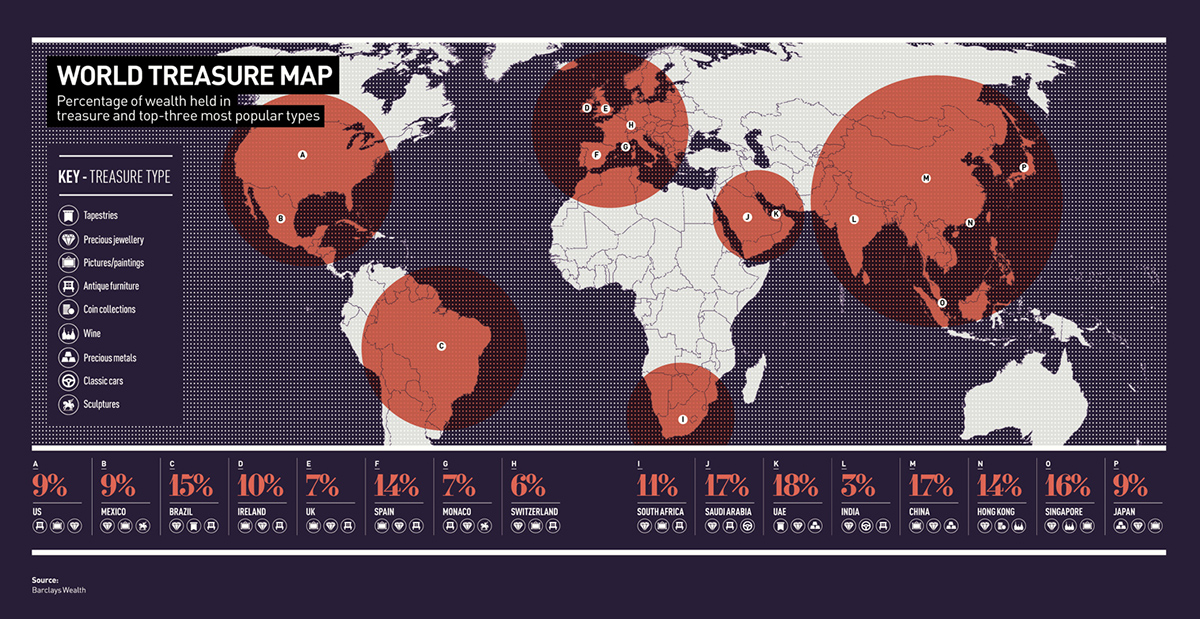
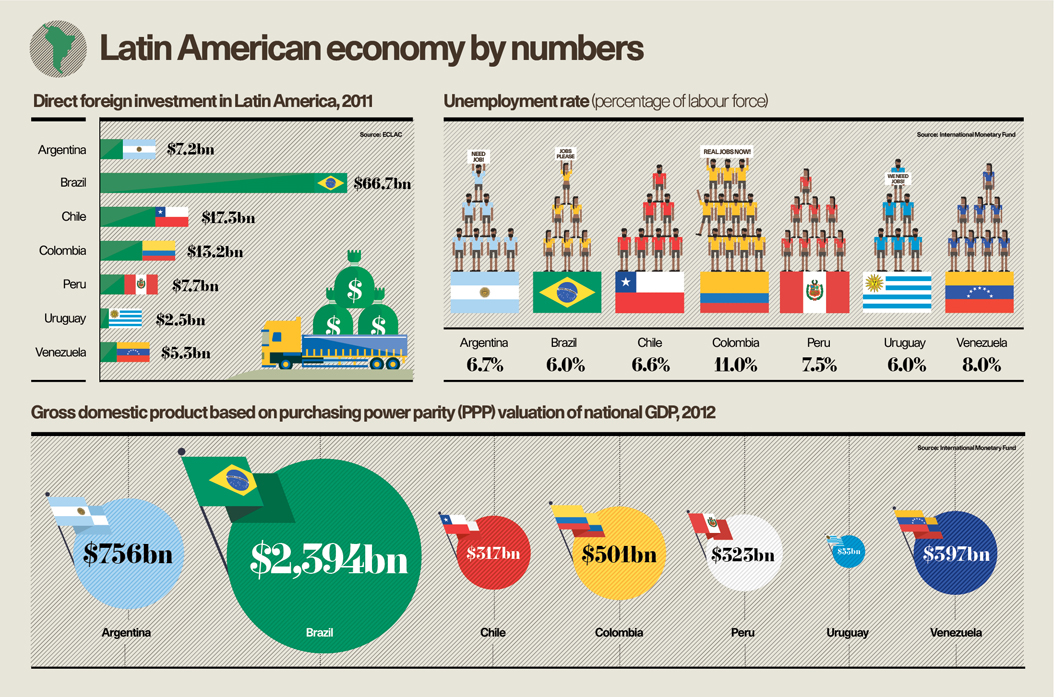
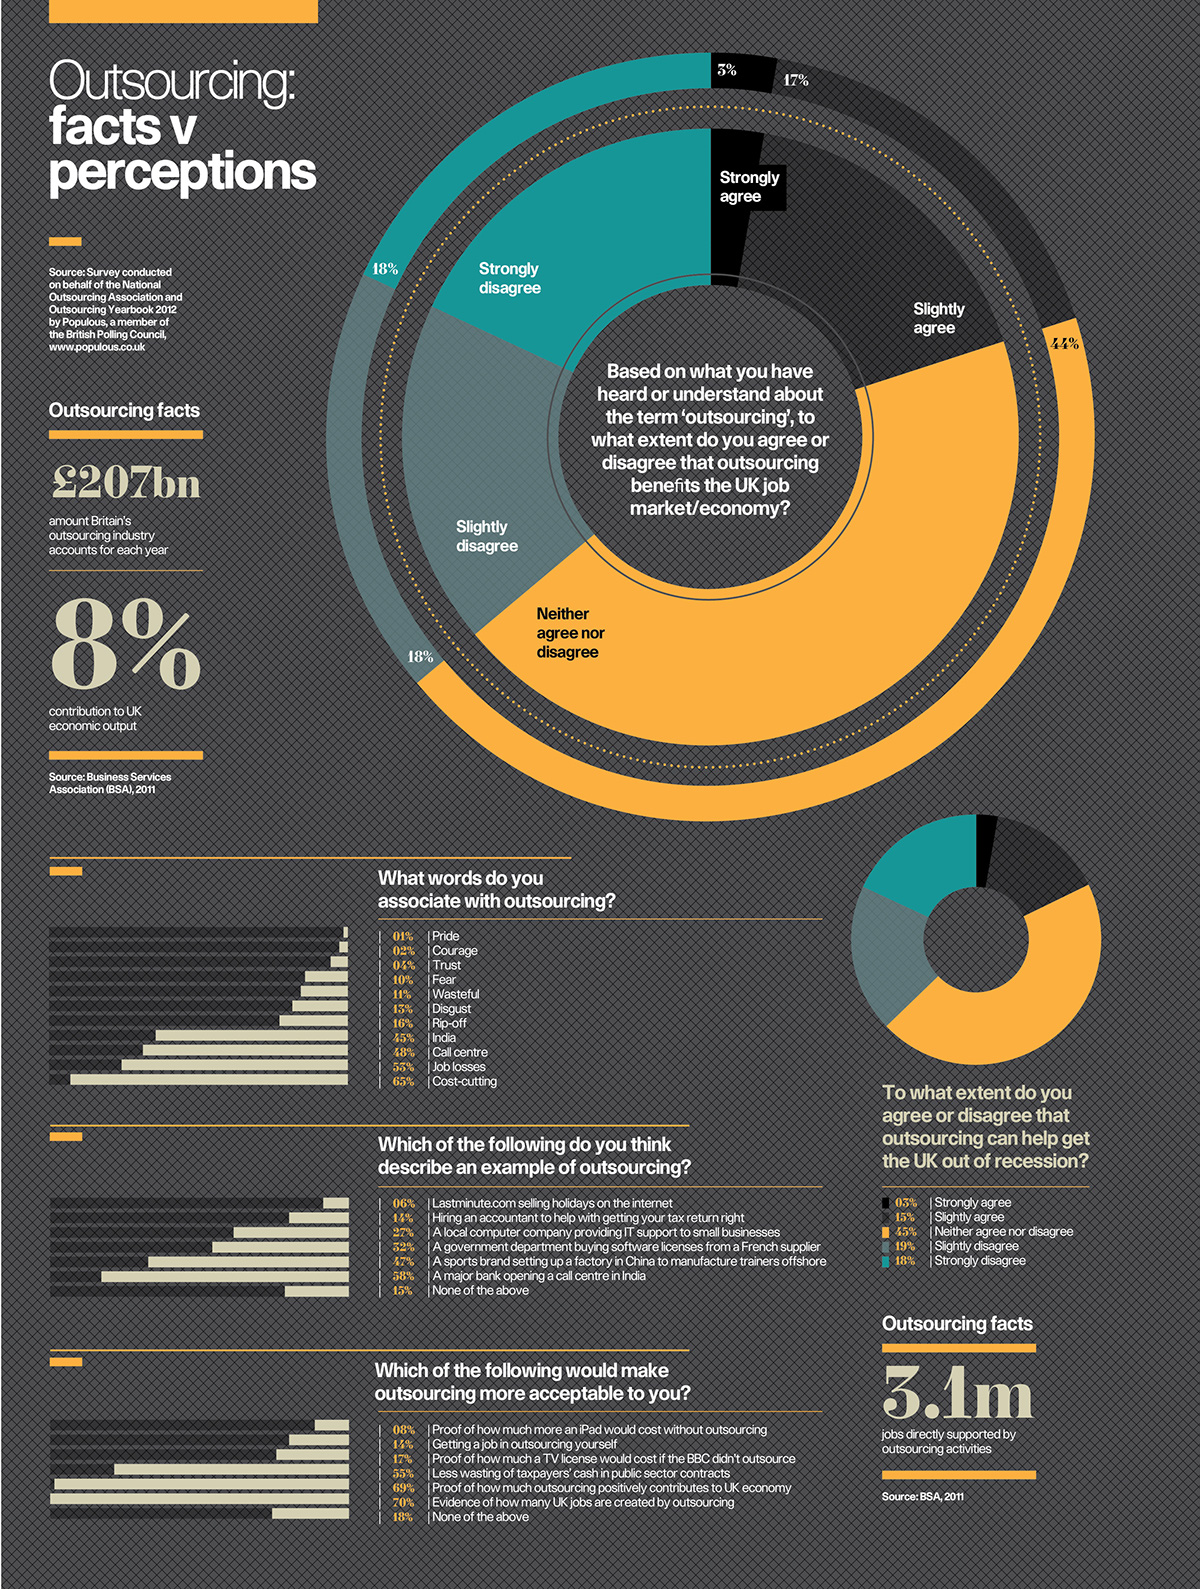
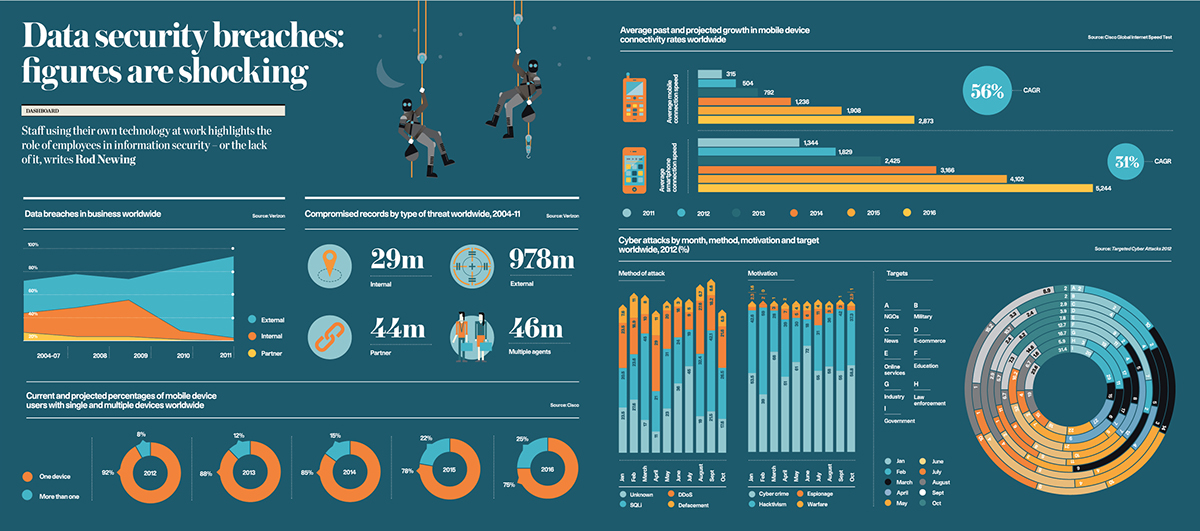
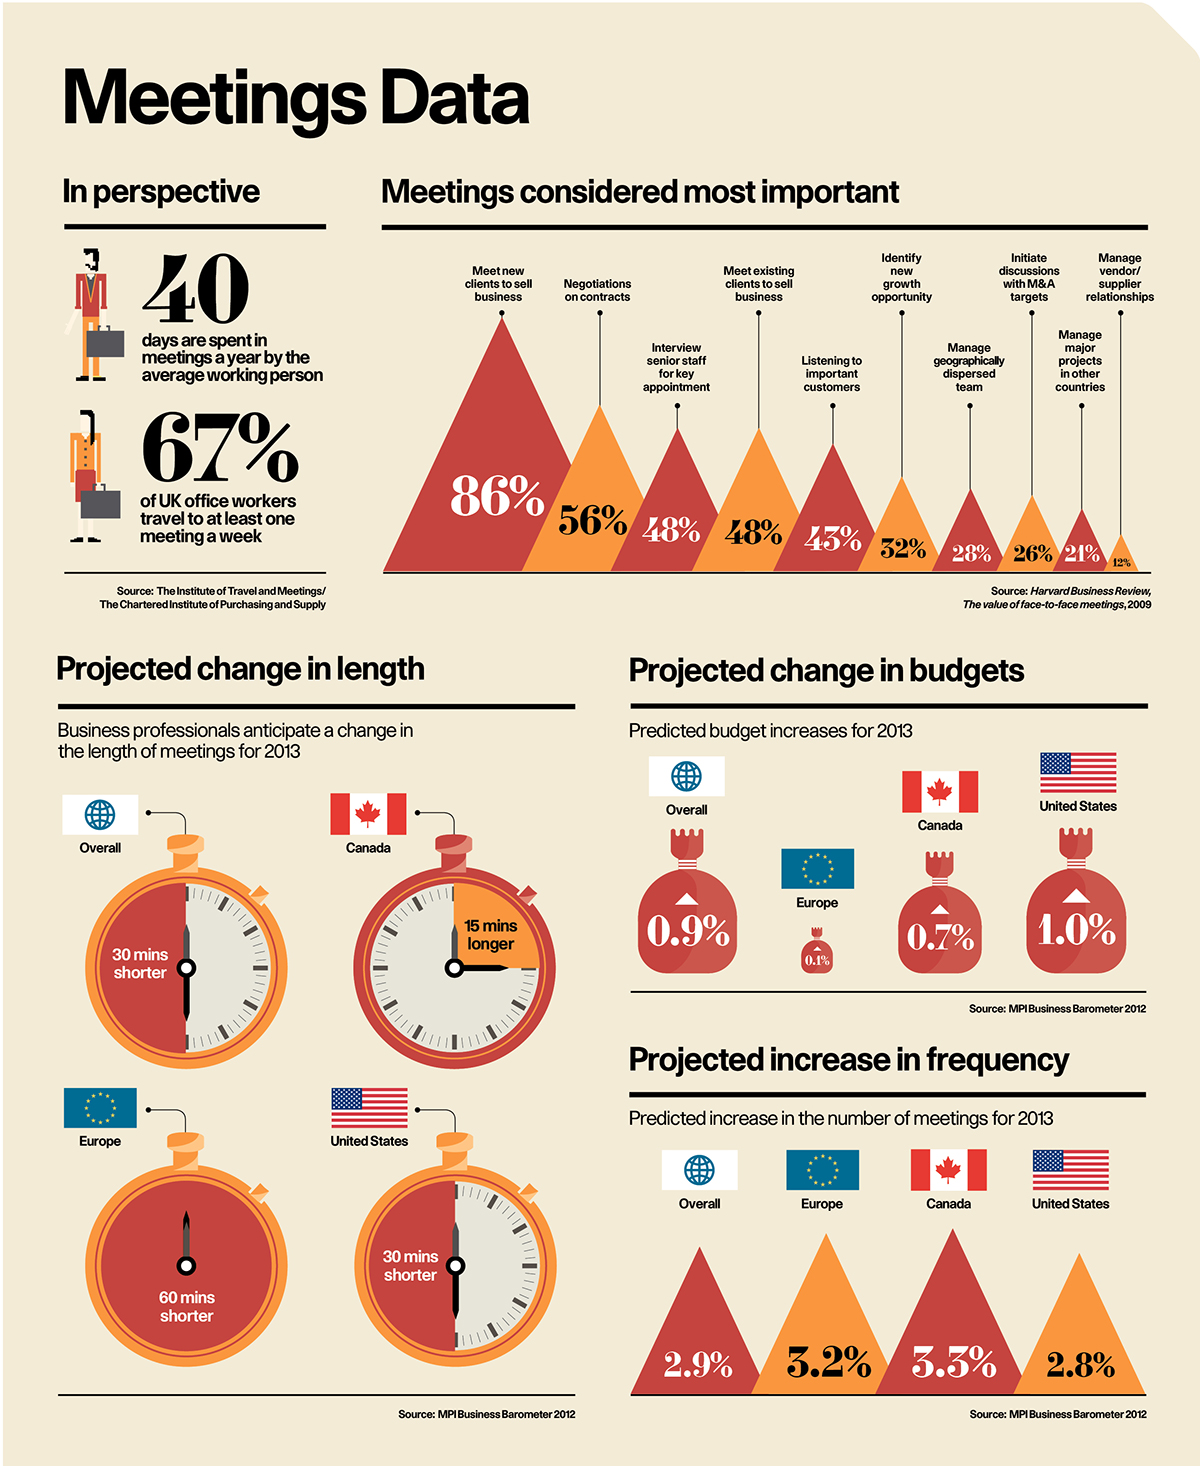
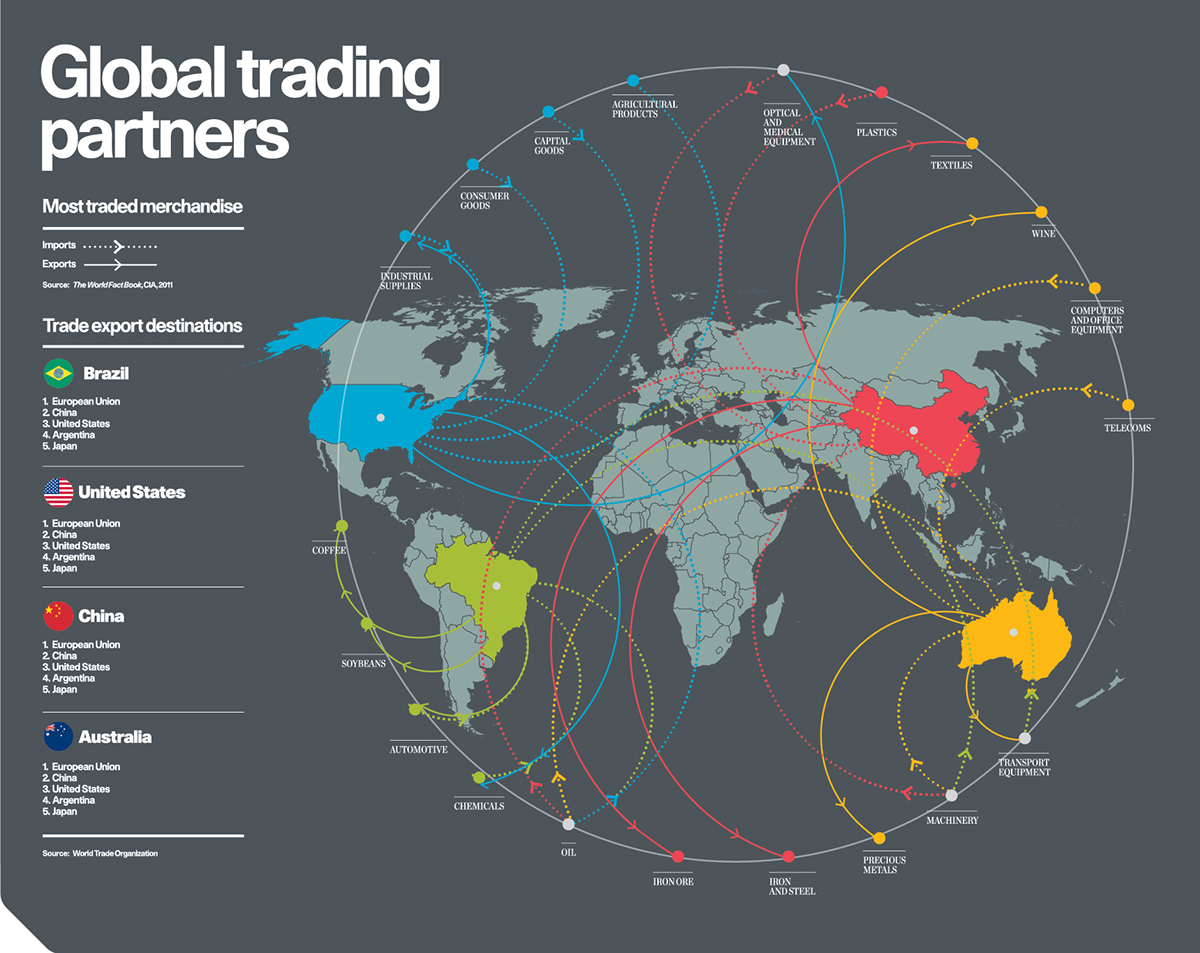
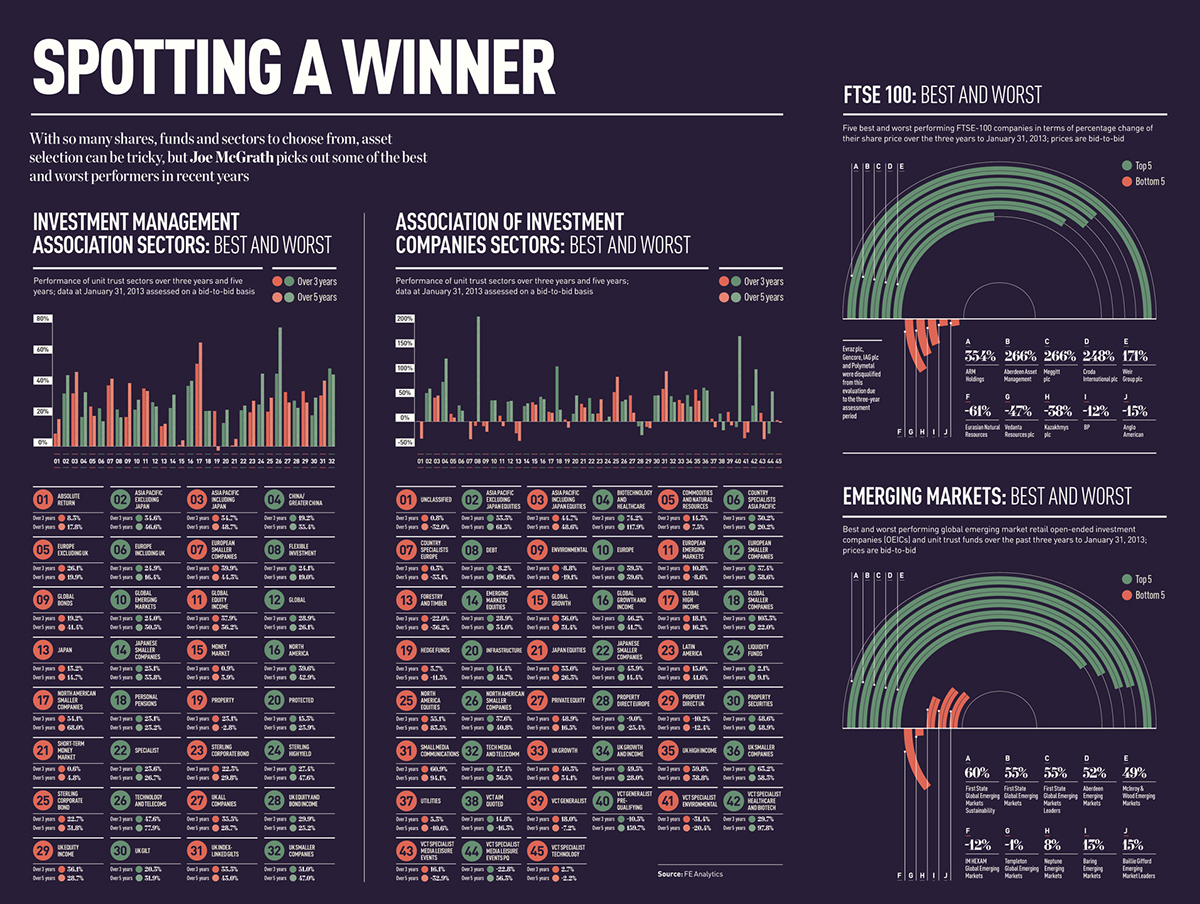
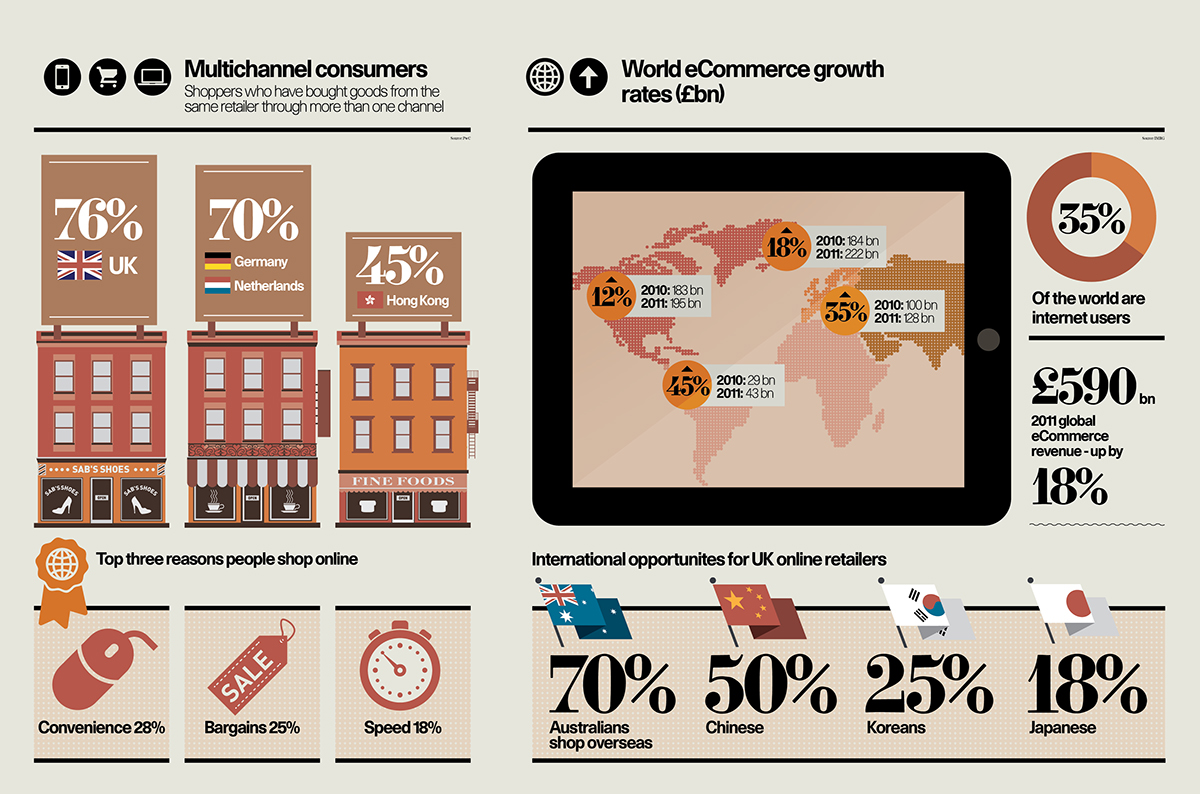
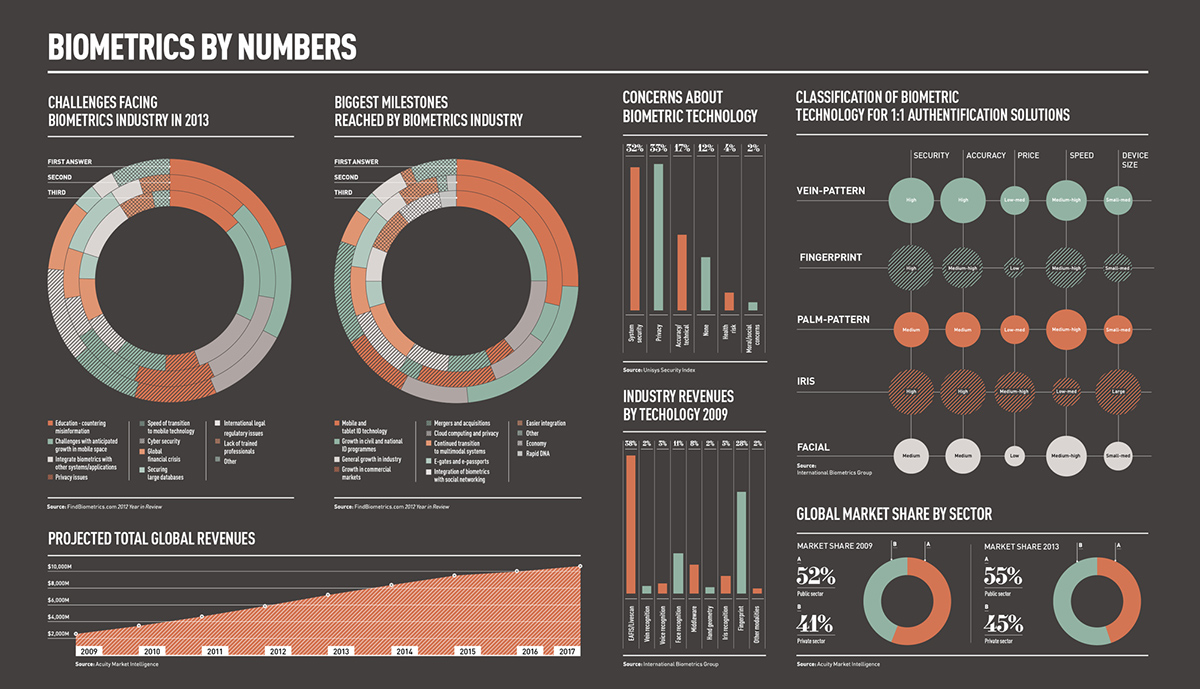
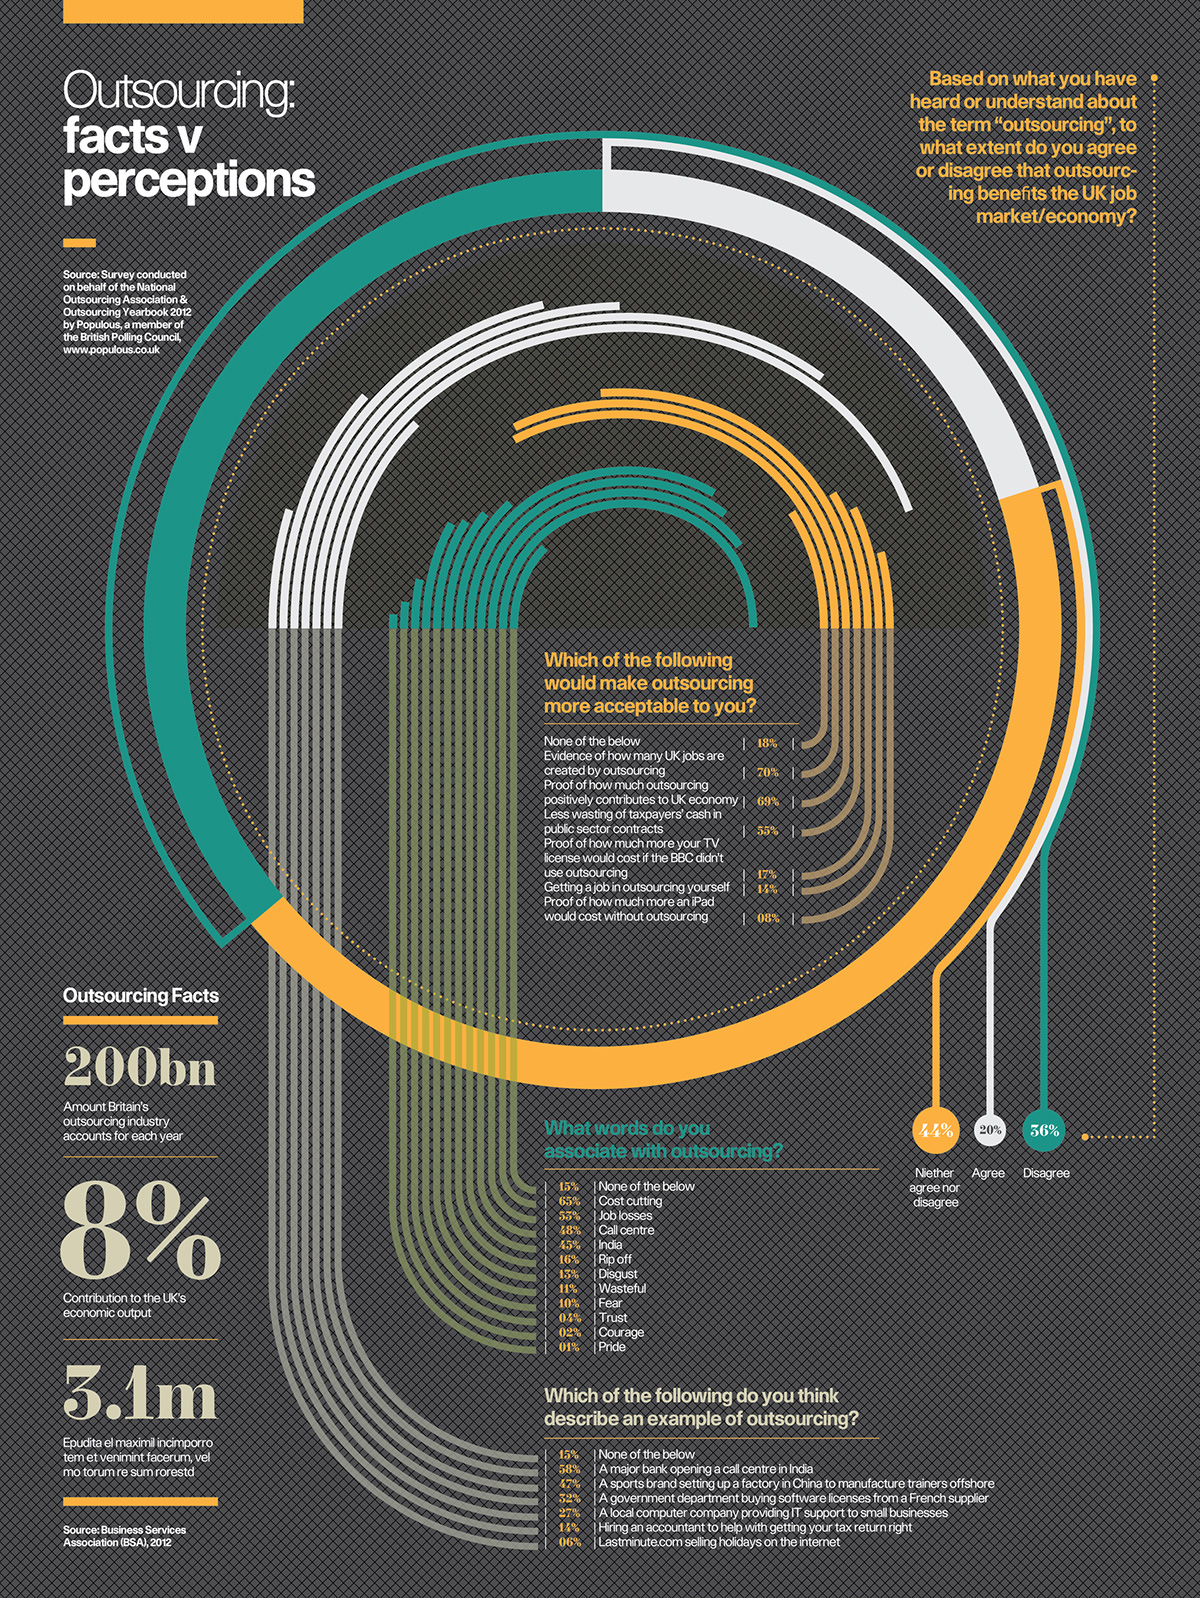
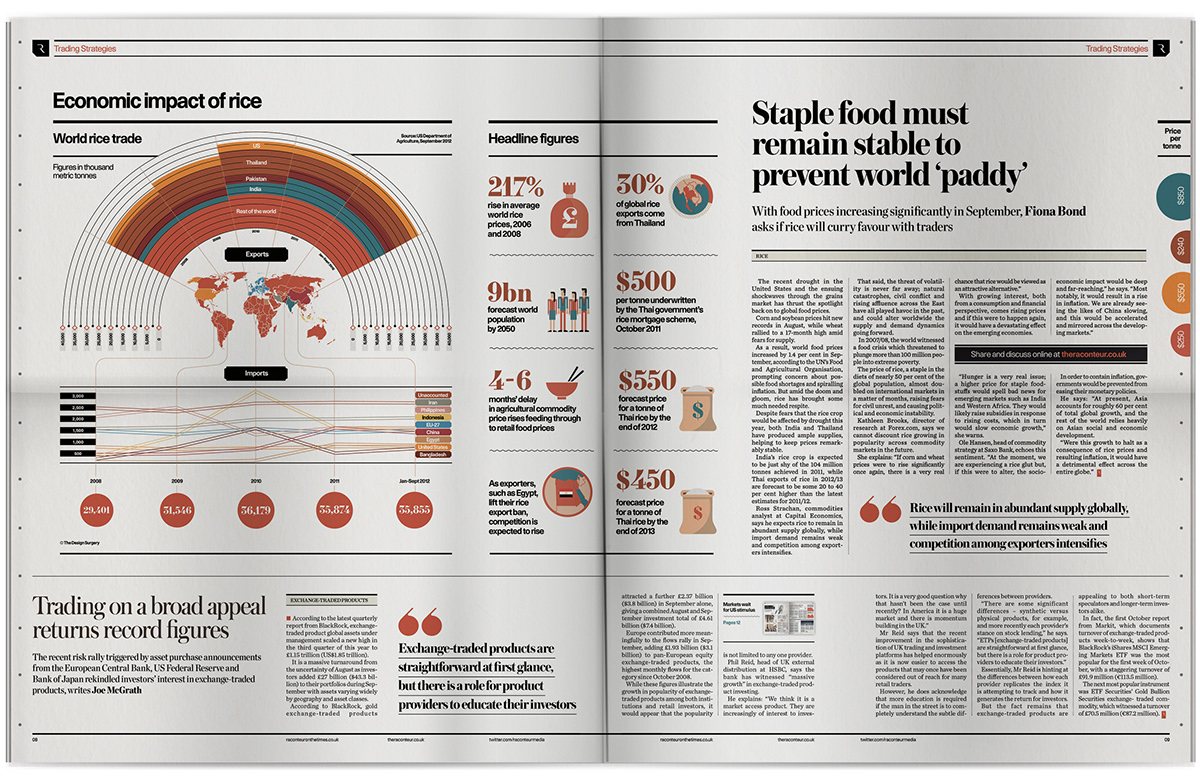
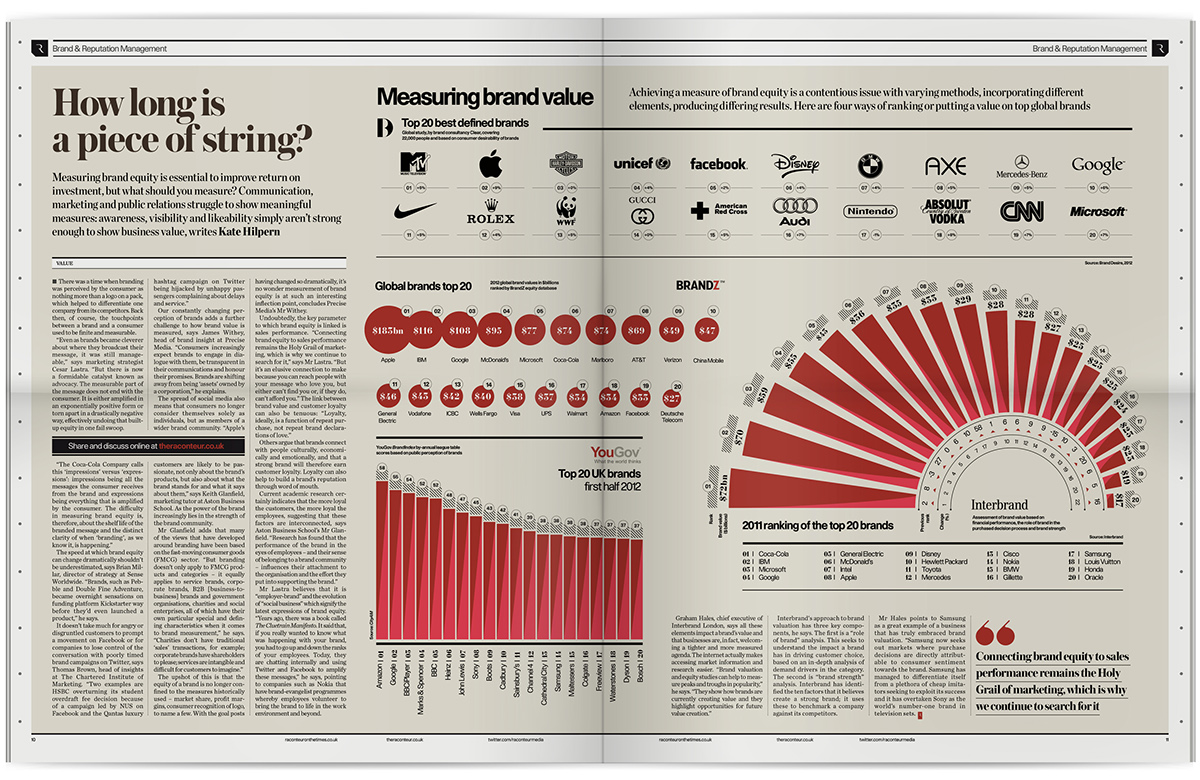
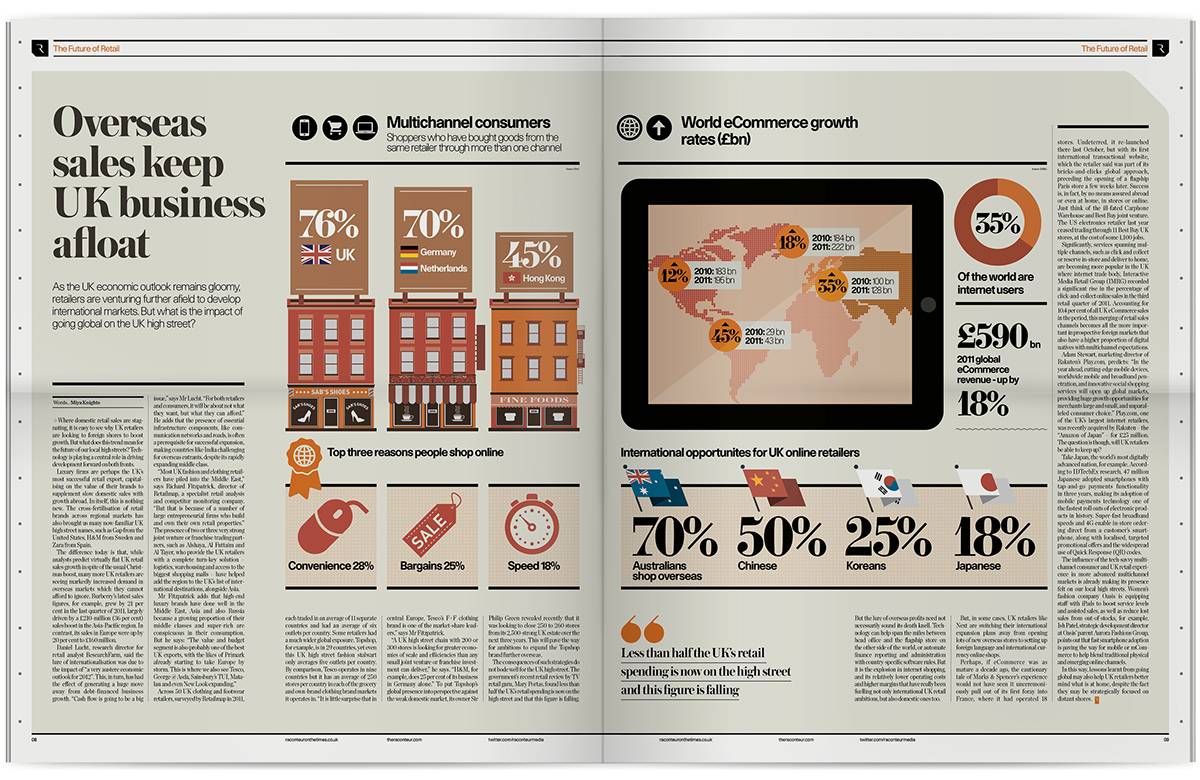
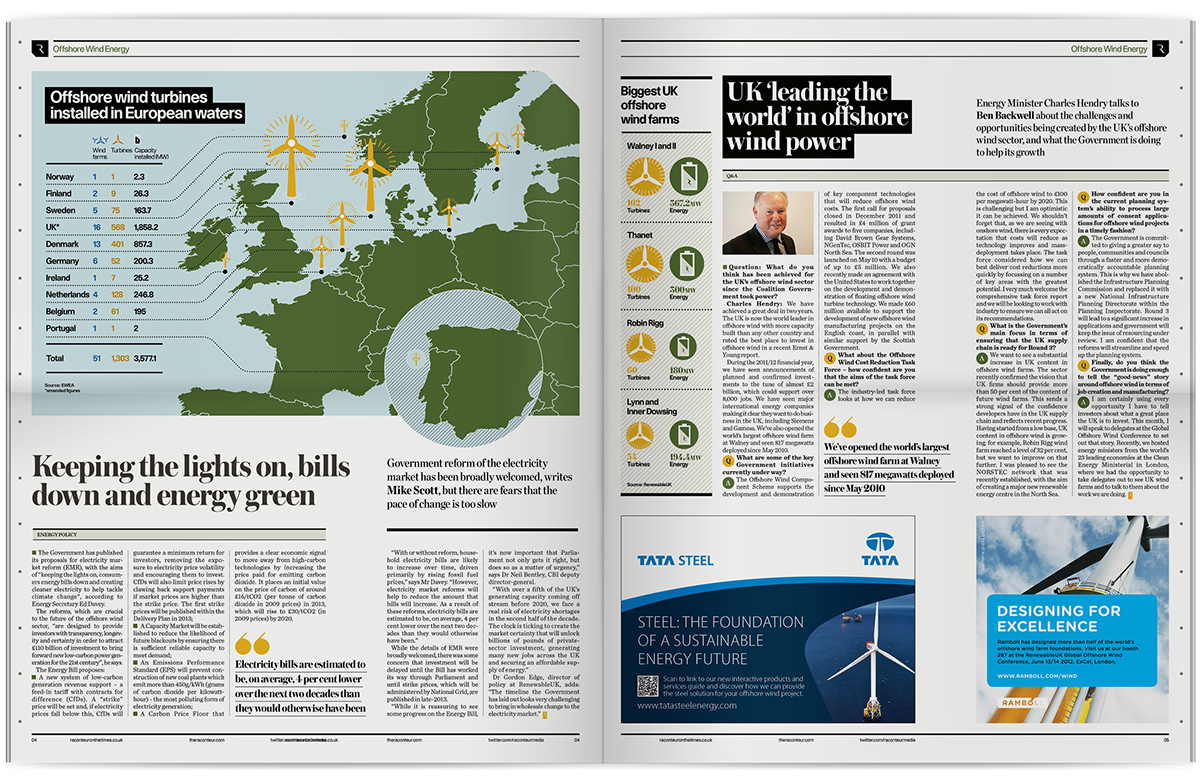
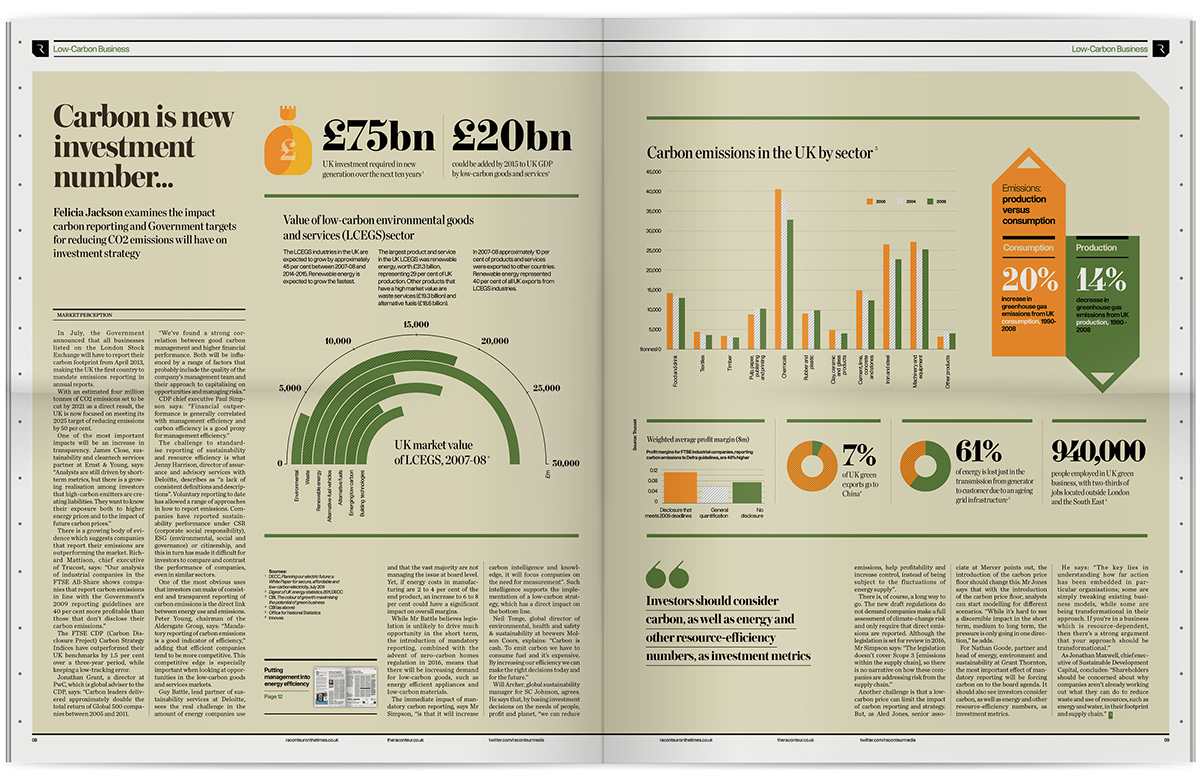
A series of infographics dashboards produced for Raconteur, a weekly 16-24 page special interest report supplement featured in The Times and The Sunday Times newspaper.
Each dashboard highlights interesting aspects of the data and combines this with engaging visuals from the topic. A minimalist approach makes the dashboard easy to read and understand.
Illustrated and designed by London design agency The Surgery, these reports provides companies and organisations with an effective, informative and powerful communications platform that allows them to directly reach their core audience.
Raconteur / The Times / The Sunday Times Newspaper Data Visualisation
.-.-.-.-.-.-.-.-.-.-.-.-.-.-.-.-.-.-.-.-.-.-.-.-.-.-.-.-.-.-.-.-.-.-.-.-.-.-.-.-.-.-.-.-.-.-.-.-.-.-.-.-.-.-.-.-.-.-.-.-.-.-.-.-.-.-.-.-.-.-.-.-.-.-.-.-.-.-.-.-.-.-.-.-
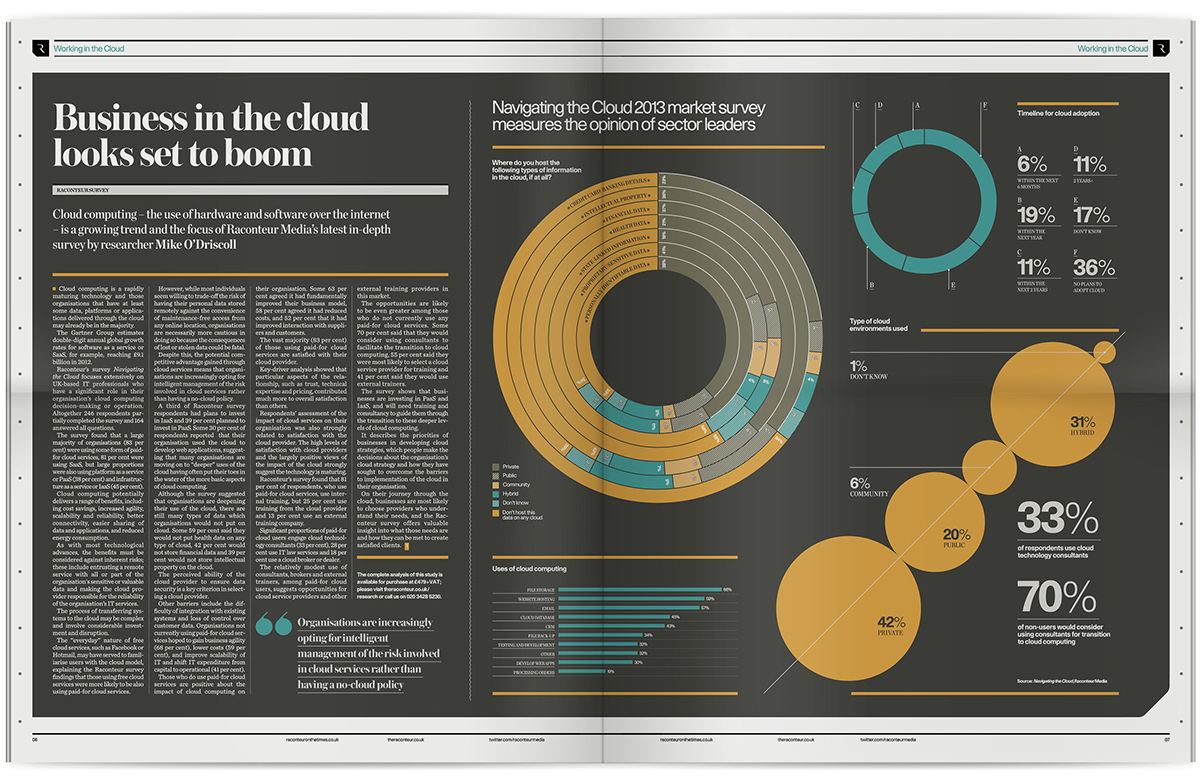
A series of infographics dashboards produced for Raconteur, a weekly 16-24 page special interest report supplement featured in The Times and The Sunday Times newspaper.
Each dashboard highlights interesting aspects of the data and combines this with engaging visuals from the topic. A minimalist approach makes the dashboard easy to read and understand.
Illustrated and designed by London design agency The Surgery, these reports provides companies and organisations with an effective, informative and powerful communications platform that allows them to directly reach their core audience.


Like The Surgery on Facebook
We regularly post other works on Facebook that we don't upload to our Behance page.
If you would like to receive a update in your news feed that we have posted new works and to discuss your thoughts around any of our projects with us, please like us on Facebook and follow us on Twitter.
If you would like to receive a update in your news feed that we have posted new works and to discuss your thoughts around any of our projects with us, please like us on Facebook and follow us on Twitter.


