
SLOW DOWN
Exhibited at ' Data Through Design' exhibition
2018 NYC Open Data Week
http://datathroughdesign.com/ellenoh.html
Do you feel anxious and unsafe crossing the streets of New York City? How many times have you turned your bike into a puddle to avoid pedestrians? Are you constantly on high alert on the road to avoid bikers, pedestrians, or other drivers while driving? Pedestrians, bikers and drivers are stressed on the busy road. Are we safe from traffic accidents?
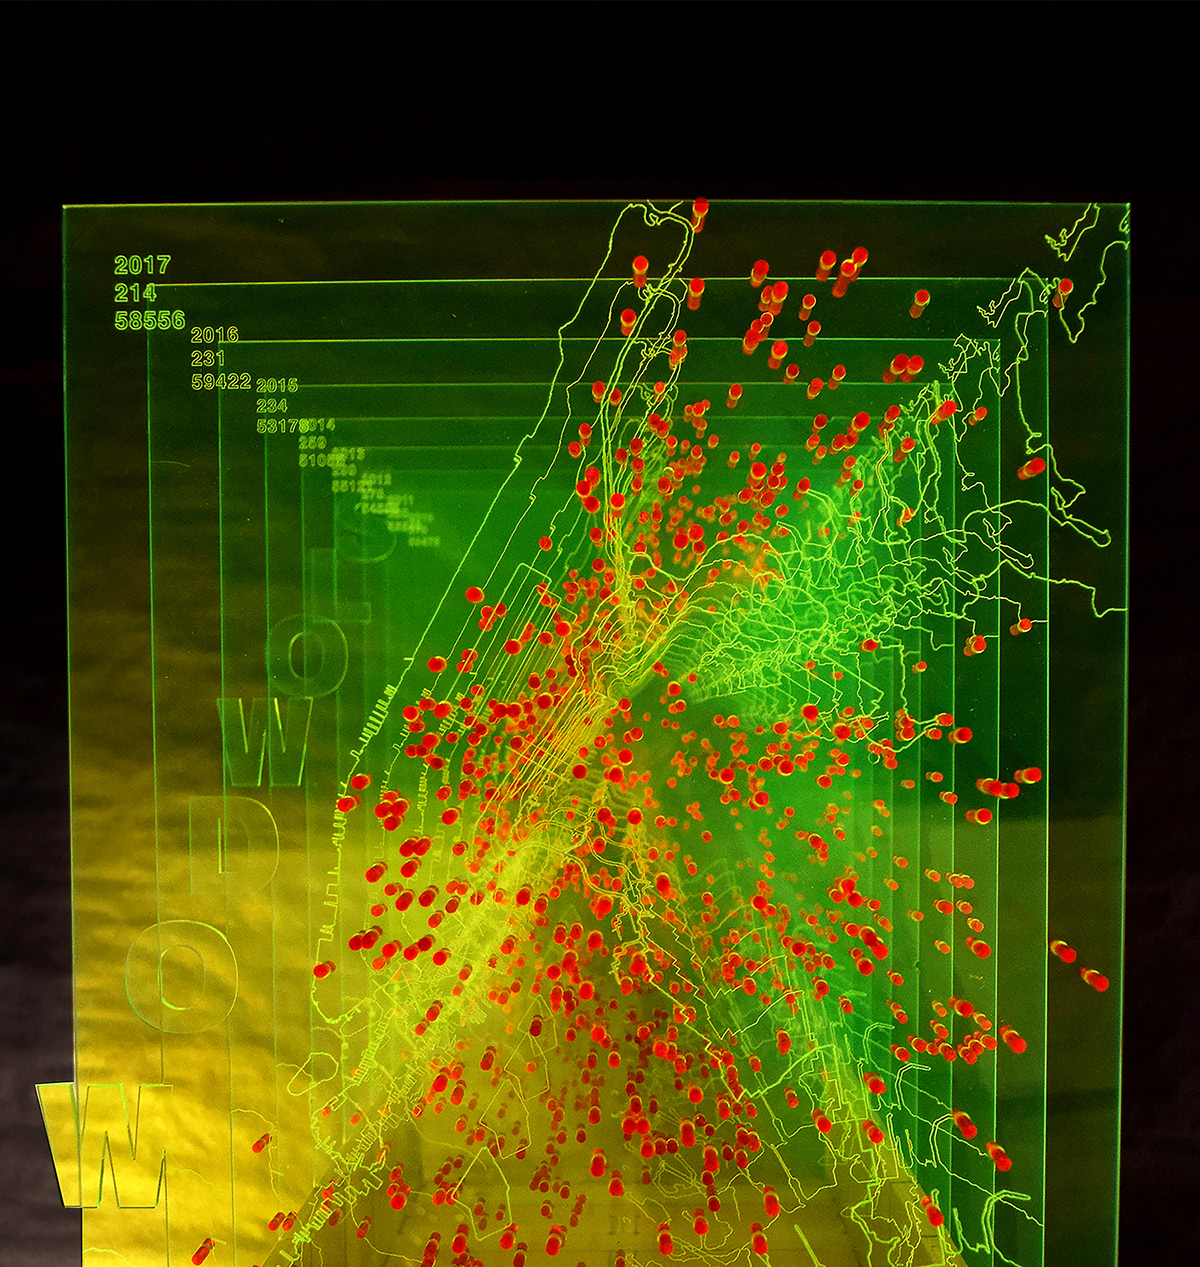
Slow Down is an physical data visualization installation that visualizes 8 years of traffic crash fatalities in New York City from 2010 to 2017 on fluorescent and transparent acrylic panels. Data is collection of 8 years of traffic crash fatalities and injuries by NYC Department of Transportation and New York Police Department. Streets are the largest and busiest infrastructure of New York City. Based on personal experience, walking the crowded and busy New York City streets occupied by pedestrians, bike riders, and cars may cause anxiety and fear. Evidently, NYC Open Data confirms fatalities and injuries by traffic crash occur everyday and with more than 200 fatalities and 50,000 injuries total every year.
Slow Down aims to bring awareness to this public infrastructure and transportation safety issue and hopes to reduce accidents by slowing down the pace and making safer choices. This Installation is also dedicated as a memorial piece to those thousand of lives lost and their families.


