
This project asked to look into the rain data of the United Kingdom (whether whole or just a particular city) and then summarise this data through some sort of data visualisation.
I went through the data available on MetOffice and decided that because there was so much data I wanted to narrow my line of enquiry to just London. I collected data for each month of 2015 and begin to analyse this data and the values that it was demonstrating. One problem that I realised particularly when dealing with so much data is that you tend to get lost within all the values and CSV files.
London is well known for its terrible weather so I thought it was interesting how when it rains everyone is always unhappy and at home however imagine if the rain was actually money falling from the sky? Would your still behave the same?
I decided to simplify the process and make it much more related to what we are so accustomed to. I wanted people when viewing the data visualisation they’re able to understand exactly what the thousands of data points are about. To comprehend this, I had to understand what this data was talking about, understanding the rainfall and working out based on the area it had fell in and the height of the rainfall exactly how many litres of water exactly fell.
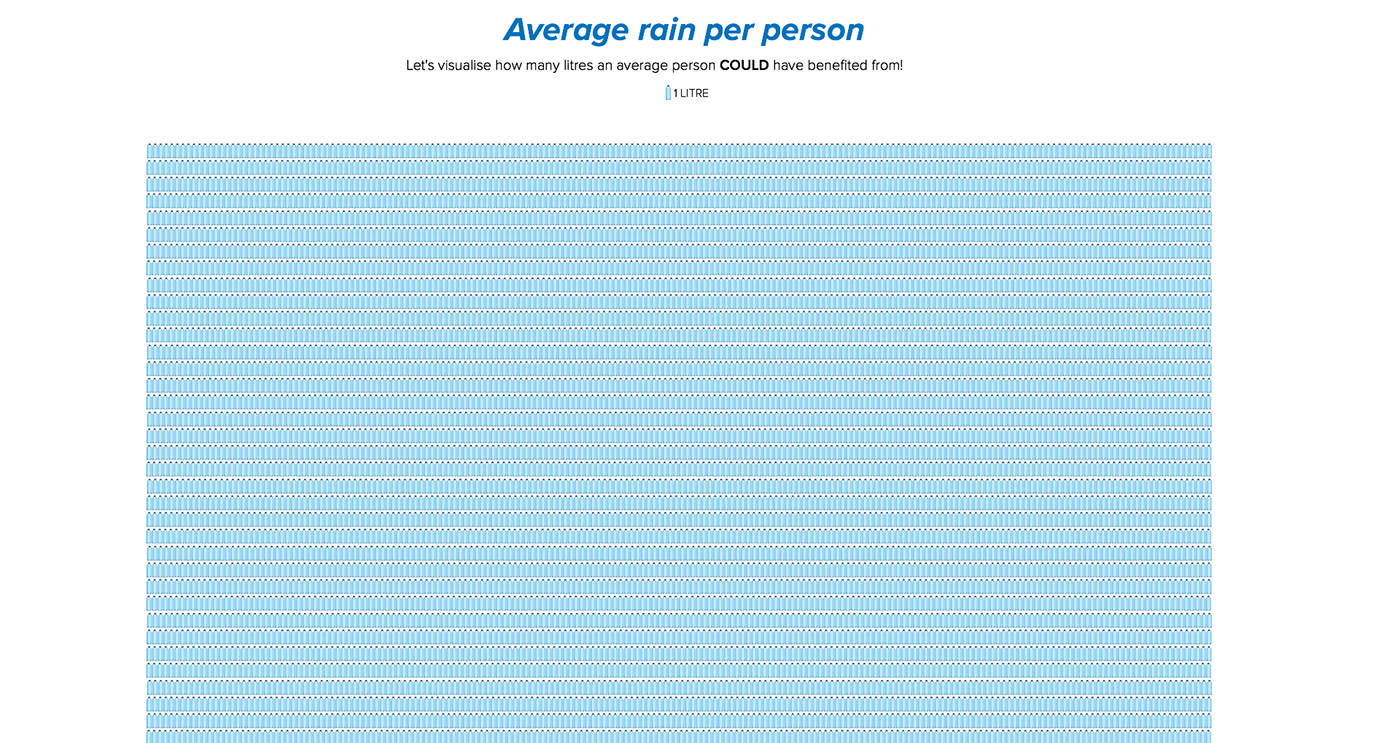
I then created a spreadsheet of the generated data and then decided to make it even more familiar to the user, I decided to place it against the average price of a 2L bottle in a supermarket to work out an economic value of the rainfall. This was surprising to find out how in some months there were as much as £10000’s worth of rain falling. I created an interface for a website where the user would endlessly scroll through and as the user went further along, it was understood which months had heavy rainfall and exactly how much of a value (to put an emphasis and meaning behind the data)
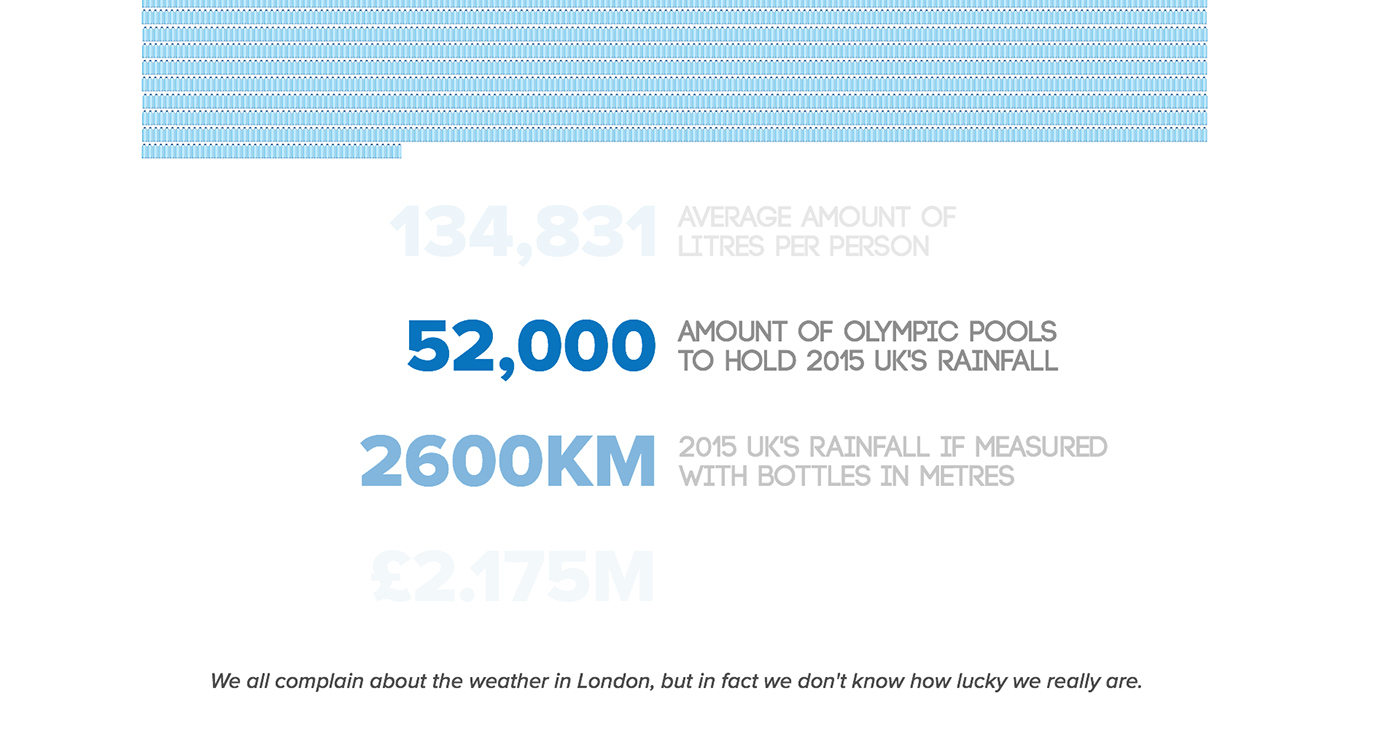
Towards the end I felt that with all this knowledge from the analyses data it was necessary to educate the user and create a call to action on how we can make use of the rainfall that London is well known for. I summed up at the end the average rainfall per person to truly get an understanding of the data to create a shock for the user. Furthermore I added points towards the end to summarise the points made and further emphasise the data.